A Change of Trend
It’s still early to call a top, based upon Elliott Wave methodology. However, here are some facts regarding Friday’s action:
- at 665 points, the DOW had the largest decline since Dec. 1, 2008
- more than eight times as many stocks on the NYSE closed down than closed up
- every single one of the 30 DOW stocks closed down
- 469 of 500 stocks in the SP500 finished the day lower
- in 5 days, the SP500 wiped out 2 weeks of upward progress
- the DAX has completed (or almost so) its first wave down.
AAPL has traced out an extended third wave and is poised to rally in a fourth wave of the first. TSLA turned down after a double-pronged second wave. FB turned down after spiking up in what looks like the final rally of an ending diagonal.
The wave structure of the USD currency pairs I follow don’t support a turn … yet. It looks like the US dollar has one more low to go before all the currency pairs turn. I would expect the turn here to happen as the second wave of the US indices reaches its high.
Oil looks to be topping. Gold and silver are heading down while USDJPY traces out an expected bounce.
Everything I’m seeing tells me a top is forming internationally.
The First/Second Wave Combo
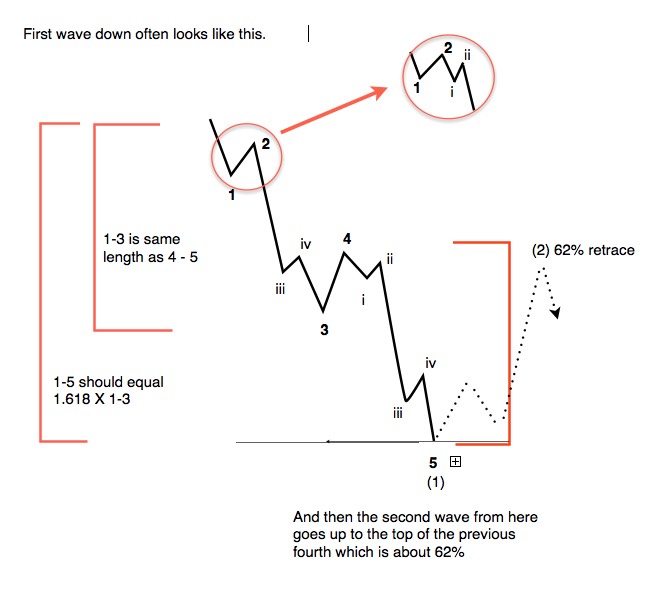
The above chart is not something you’ll find in the Elliott Wave Principle book. This is the typical configuration of a first impulsive wave down, with a second wave shown in dotted lines.
There are certain criteria that are critical in the determination of an impulsive first wave rather than a zigzag (a corrective wave):
- There must be two small first/second wave combinations at the start of the pattern (shown in the inset).
- The third wave must contain a subset of five waves.
- Wave 4 must retrace 38% of the progress down thus far from the top.
The current wave down seems to meet the above requirements. However, a further determinant of a change in trend is the need for a second wave retracing at least 62% with a subsequent drop to a new low. This is what we’ll be watching for over the next ten days or so.
In this week’s Chart Show (links at the bottom of the post), I’ll be providing the targets for entry for the next phase … the 5 year (at least) bear market we seem to be entering.
Turning the Ship — A Process
Let’s look at an update of the US Dollar.
I’ve been maintaining for the last couple of years that once the US Dollar found its low (it’s in a large fourth wave—a corrective wave), that it would mark the top of the US market.
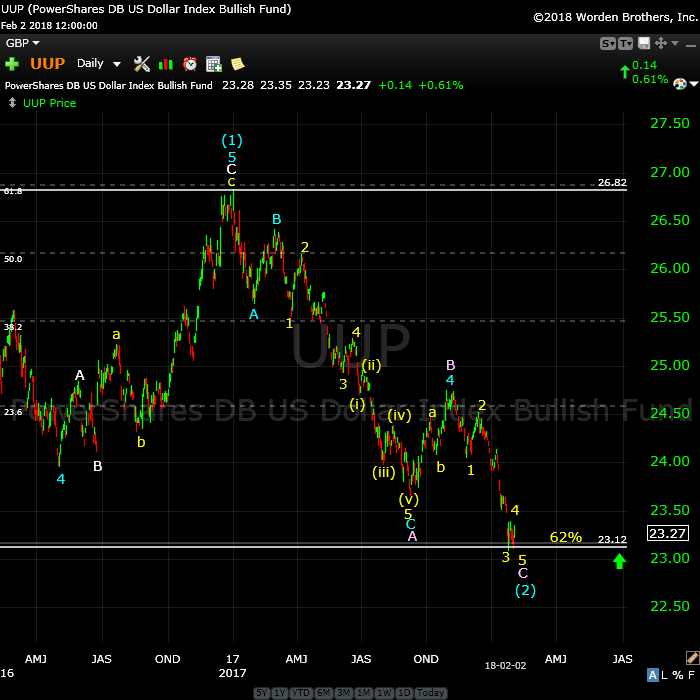
Above is the daily chart of UUP (US Dollar ETF). UUP is representative of the structure of DXY (the US index) and will provide an excellent predictor of the impending top in currency pairs and the US indices.
Last weekend, I wrote here that I was expecting a small yellow wave 4 and then a new low in a wave 5. We now have that pattern in place, but it doesn’t look quite complete yet, although very close. I’m expecting one more small final fifth wave down to conclude this trend, culminating in a turn up and leading eventually to a new high above 26.82 for UPP and a similar new high for the US Dollar.
The movement of the dollar strongly influences the movement of just about everything else, so it’s important to pay attention to what it’s doing on a large scale.
___________________________
The Tesla Train is Confirming a Trend Change
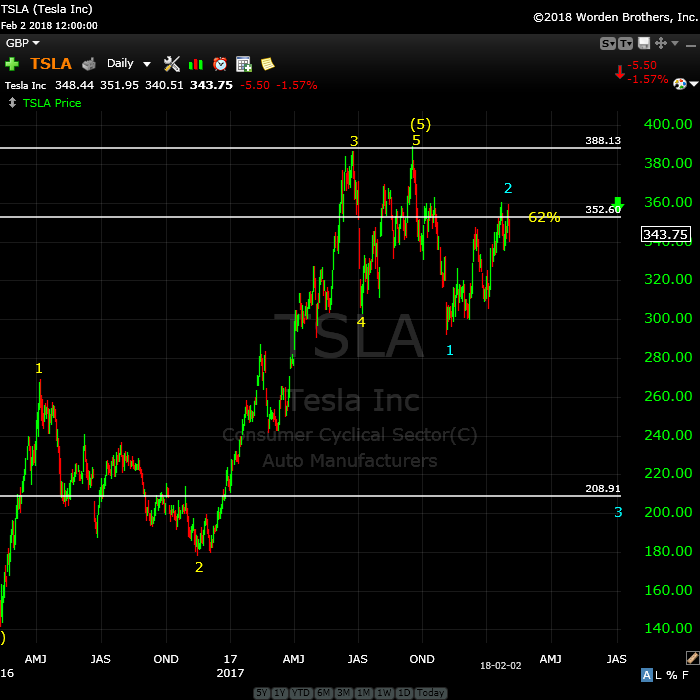
Above is the 2 day chart of Tesla, showing my prediction playing out. The top is not officially in here; we need a new low below ~290.00.
Last week, I suggested we’d head up in a “double-pronged” second wave, which is exactly what we’ve done. We’ve now potentially turned down into a third wave with a target in the 209 area.
There are potential variations to this pattern, but the ultiamate goal for a full first wave down should be below 140.00. (This includes the first and second waves already traced out, a large third wave down to about 209.00 and a further drop in a fourth and fifth wave.)
Apple Continues to Drop
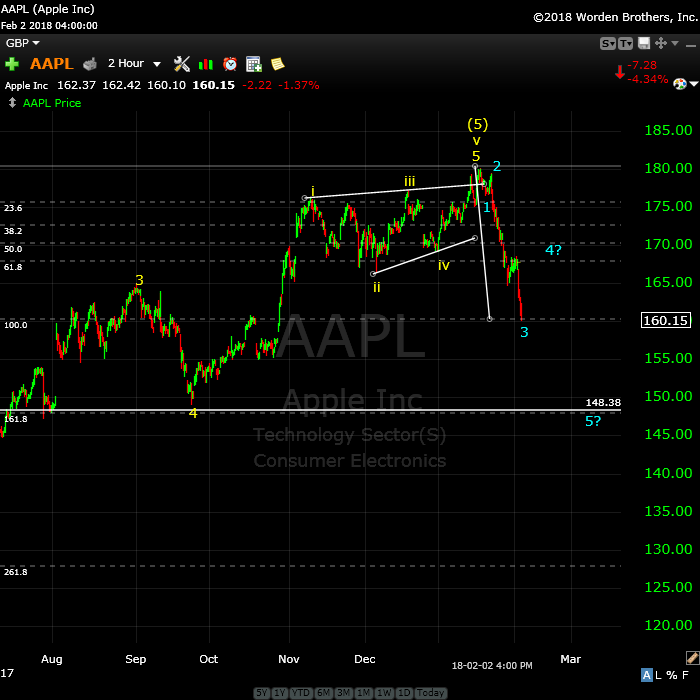
Above is the 2 hour chart of AAPL.
Last weekend, I identified a pending top here, with a third wave currently in progress. We’ve continued down in that third wave to the point where we have five waves down.
Expect and fourth wave bounce and then a drop to a new low. It looks like the target is indeed the 148.00 area, the same target I identified last week.
On Deck: Facebook
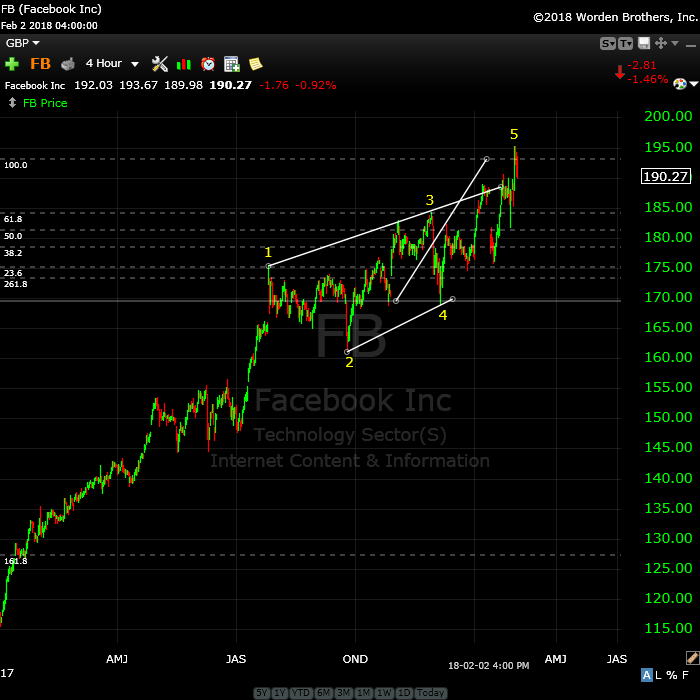
Above is the 4 hour chart of Facebook (one of the FANG stocks). This shows the final pattern I described last weekend, which is an ending diagonal. Ending diagonals gained that name because they form at the end of a trend. You can short a pattern like this when it drops below the lower trendline.
The bigger they are, the harder they fall. This is potentially the start of a first wave down, which should revert back to the beginning of the ending diagonal, the previous fourth wave, around the 145.00 area.
__________________________
I’m Moving (but hopefully, you won’t notice)
This last week, I had a big blow-up with my current hosting service (Bluehost). They have a bug on their server, but they refuse to acknowledge it. The WordPress code on my site doesn’t communicate with their php engine, which we’ve proven, BUT …
… so we’ll agree to disagree, and I’m forced to move the site to another hosting company, which should happen sometime this weekend.
My current site has been tested on the new server and it works just fine (as it does on two other servers we’ve tested it on). I’m hoping that the switch will be seamless, but if the site is down for a short period, that will be the reason.
Registration for Commenting
Want to comment? You need to be logged in to comment. You can register here.
If you register, it protects your information. It also allows you to comment without filling in your information each time. Once you’re registered, simply go to the home page and click on the login link top right in order to log yourself in. Usually, you’ll be logged in for several days before needing to be logged in again.
______________________________
Problem receiving blog comment emails? Try whitelisting the address. More info.
______________________________
The Market This Week
Here's the latest daily chart of ES (emini futures)
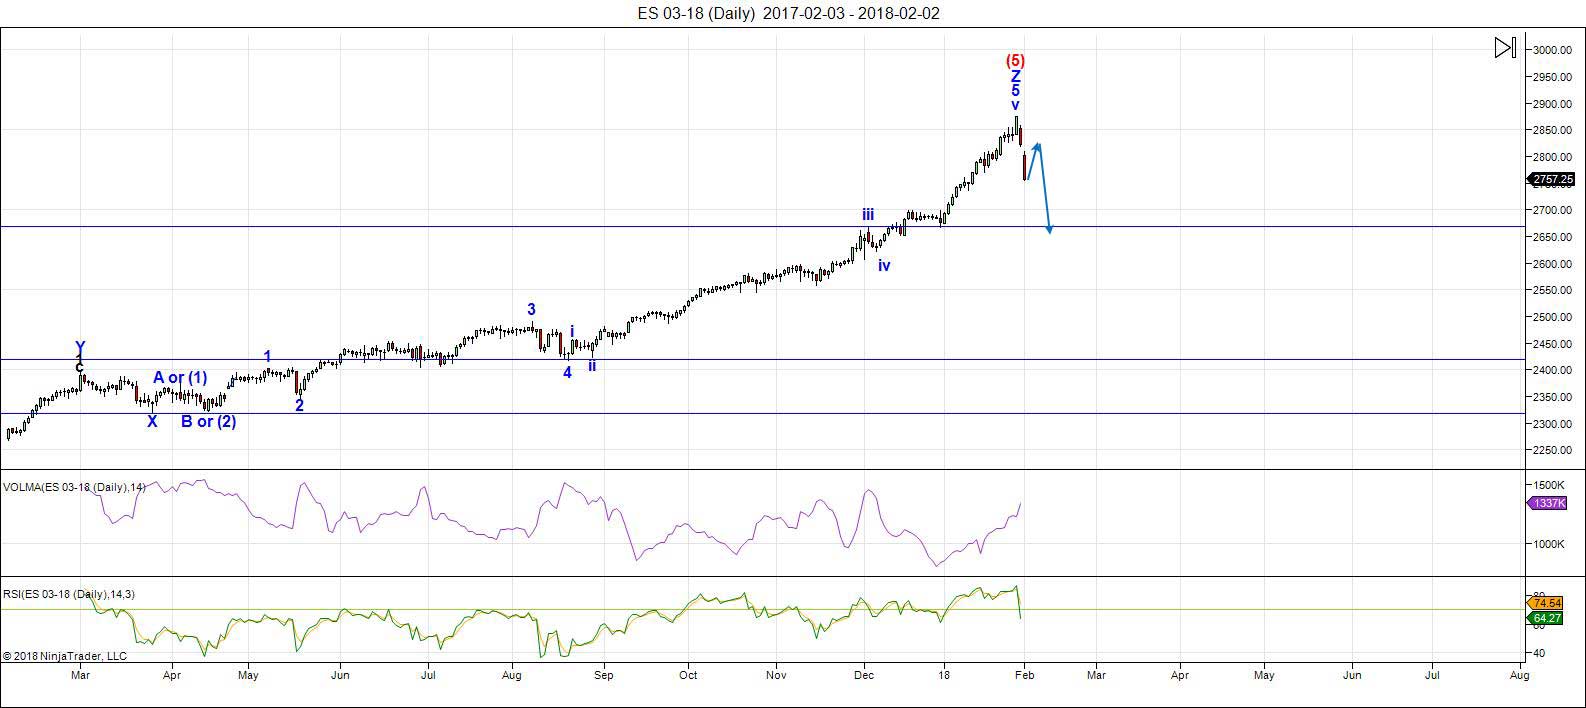 Above is the daily chart of ES (click to enlarge, as with any of my charts).
As predicted, we reached the final high and have turned down with gusto! The methodology does not let me call a top yet, however. I'm waiting for a second wave and a successful drop from there to a new low.
We're still in the first wave down and I expect more downside this weekend to approximately 2730 (my lower prediction for a first wave low). Then look for a second wave probably starting Monday morning.
Volume: It's risen as the "early rats are leaving the ship," as expected.
Summary: We've turned down across the US indices. I can't confirm a top yet, but early signs suggest an impulsive wave down in a typical first wave scenario.
___________________________
Trader's Gold Subscribers get a comprehensive view of the market, including hourly (and even smaller timeframes, when appropriate) on a daily basis. They also receive updates through the comments area. I provide only the daily timeframe for the free blog, as a "snapshot" of where the market currently trades and the next move on a weekly basis.
______________________________________
Sign up for: The Chart Show
Next Date: Thursday, February 15 at 1:00 pm EST (US market time)

The Chart Show is a one hour webinar in which Peter Temple provides the Elliott Wave analysis in real time for the US market, gold, silver, oil, major USD currency pairs, and more. You won't find a more accurate or comprehensive market prediction anywhere for this price.
Get caught up on the market from an Elliott Wave perspective. You’ll also get Andy Pancholi cycle turn dates for the SP500 for the balance of the current month. There’ll be a Q&A session during and at the end of the webinar and the possibility (depending on time) of taking requests.
All registrants will receive the video playback of the webinar, so even if you miss it, you’ll be sent the full video replay within about an hour of its conclusion. For more information and to sign up, click here.


Swing low hammers everywhere. V is for pre-Valentine’s bounce. Last hurrah for the fire rooster?
It’s a rooster booster! .. a final kick at the cock, so to speak. Luri … ???
? ? ? Have a wonderful weekend Peter!
Thanks, Liz … as I relabel all my charts once again … lol. Up and down … but it won’t be much longer.
Once I get a chance to review everything, I may or may not change my tune about how far we go up. I’m not blown away by the substructure of the waves up, in other words, they’re not obviously motive at the moment.
ok… thanks all for your inputs !! learnt a lot this week. also very profitable day today — wasn’t certain if I bought calls/puts at times — if I was on the right side of a trade at times. lol crazy Friday ! 🙂
have a nice weekend all
Peter T,
What is the “time period” on the charts you are mentioning that you may relabel?
I am referring to your post February 9 at 2:15pm. Trying to understand “if” you are seeing the 5 wave impulse down in the Cash S&P…also see 5 waves down in NYSE, and Nasdaq.
I see the double bottom that you are referring to in the ES March contract…So “no” 5 waves down yet in the ES. At least in the Cash indices…are we waiting for you “abc” up to confirm a possible “top”? Am I on the same page (sort of) with what you are seeing?
A new weekend post is live at: https://worldcyclesinstitute.com/the-big-top-fake-out/
This website is for educational purposes relating to Elliott Wave, natural cycles, and the Quantum Revolution (Great Awakening). I welcome questions or comments about any of these subjects. Due to a heavy schedule, I may not have the time to answer questions that relate to my area of expertise.
I reserve the right to remove any comment that is deemed negative, is unhelpful, or off-topic. Such comments may be removed.
Want to comment? You need to be logged in to comment. You can register here.