The Parade Grows Larger and Larger
 The picture at left depicts a St. Patrick’s Day Parade in New York City. Somewhat appropriate to what I’m seeing in the markets.
All the Same Market: I’ve been mentioning for months now that the entire market is moving as one entity, the “all the same market” scenario, a phrase that Robert Prechter coined many years ago, when he projected the upcoming crash.
We’re starting to deleverage the enormous debt around the world. Central banks long ago lost control (they never really had control, just influence). They have tools, like “TARP,” for example, but treasuries dictate interest rates (the Federal Reserve just follows along). They’ve been attempting to fight deflation now for years, but it’s slowly taking hold.
We have an inflationary bubble which is about to break and you’re going to have a front row seat.

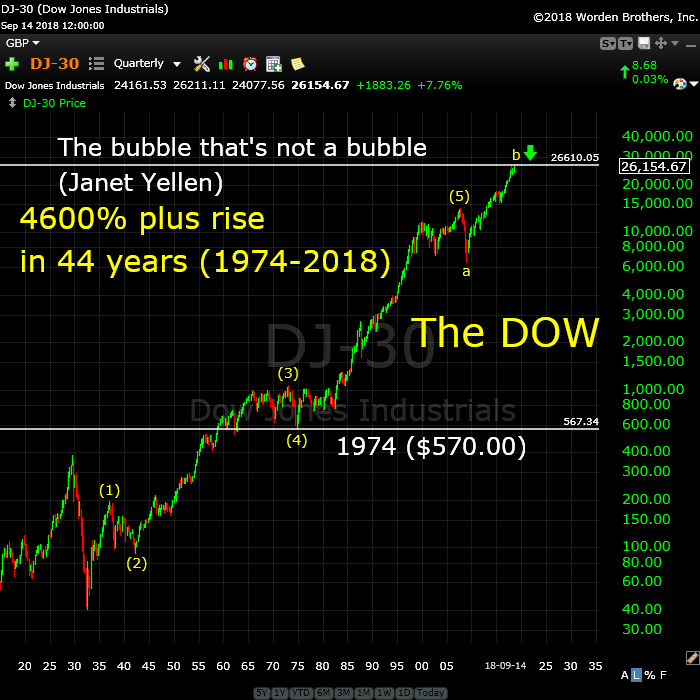
Above is a quarterly log chart of the DOW, showing the five waves up from 1932. This is the fifth wave of a three-wave impulsive sequence that began about 500 years ago.
What’s interesting to an Elliott-waver is that wave (3) is exactly 2.618 X the length of wave (1) and wave (5) is again about that same length. The “unnatural” B wave tacked on the top end has been inflicted by both the governments and central banks in collusion. But the history-making bubble is just about at an end.
Elliott wave analysts know that when you have a correction, it always reverts back to the area of the previous fourth wave of one lesser degree. That level was in 1974 when the DOW as at $570.00. I’ll let you mull that one over …
We’ve inflated away the value of our currency to the point that it’s worth four cents of what it was a hundred years ago, a few years earlier than the start of the above chart.
Much of the rise in this market is due to inflation. If you expect more inflation (and waves to the upside), you’ll have to wait for a very large correction in order to do so, because this wave count is all but done. It even has a B wave extension, which is a first time in history event. But even it’s at a full count.
I expect this market to turn over before Christmas. The crash may be early in the year, but the top is almost at hand.
The Dollar Leads the Way
The US dollar is fully in charge of both the equities and currencies markets. They’re all moving in tandem, as I’ve been saying since September of 2016. For a short while, currencies were moving contra to the US market, but gradually all the assets classes have started “drinking the cool aid” and aligning themselves so that they’ll all top at the same time … internationally.
If you do not look at the overall market and the asset classes that matter (oil, gold, USD currencies, and the US equities —as well as international indices), you will have no real idea where we are. For assets do not just crash midway through their wave structures. They all finish up five waves together and then turn down in a very predictable, organized manner. Worldwide sentiment becomes more negative than positive and the trend changes.
Even intraday now, I’m seeing almost all the assets I cover moving as one … in a parade to the top – eventually. But, unlike a parade, the market doesn’t move in a straight line.
The market does the most predictable thing in the most unpredictable manner.
About three weeks ago now, my blog title on the free blog was “Turn of the Century.” Well, haha, I was just a little early. That turn is still about to happen. At the time, I said I didn’t know exactly how it would happen, but I knew just about everything would turn at the same time. Eventually, we’re all going to complete the final 5th wave together.
It looks now like the top of the B wave will have just about everything lined up. USD currencies, the US indices, oil, gold, and the US dollar itself should all turn at the same time.
_________________________
Update on NDX
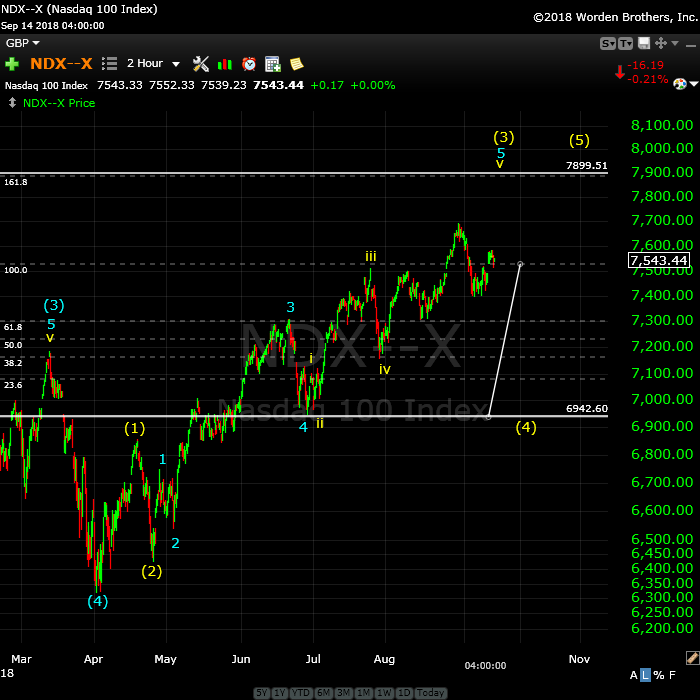
We’re closer to the top than many think. The impulsive structure of the NDX suggests that, once we trace out what might be a more complex fourth wave, we’ll have one more wave up to a new high. After that, it’s a multi-year bear market ahead …

Above is the two hour chart of NDX (Nasdaq 100).
There are several ways to label this final set of waves up to the top of wave 3. I believe we’re in the fifth wave of the third wave with a top coming with a new high. That would lead to a larger fourth wave down, which will parallel the movement of ES/SPX as they complete a C wave of their fourth waves.
The larger fourth wave should come down to the previous fourth wave somewhere around the 6942 area. It cannot drop into the area of wave (1) or it would negate the impulsive wave and possibly lead to an ending diagonal.
These waves are the final two before the top of the 500 year rally. The fourth wave will likely come down “hard” as many of the FANG stocks are also set up for a turn to the downside. They’re all setting up for a turn at the same time, by the looks of it.
In any case, after the final 5th wave up in NDX is complete, we’ll turn down into the bear market I’ve been talking about here for the past three years!
The Australian Dollar—An Update

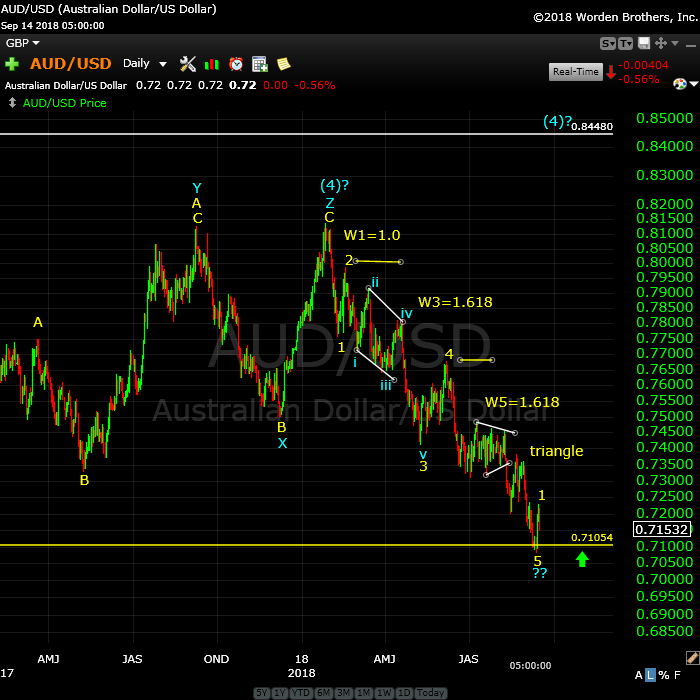
Above is the daily chart of AUDUSD. Last weekend, I showed the AUDUSD chart and called for a turn. This week, we got the turn and have now finished an impulsive first wave up and a second wave down to the 62% level from the turn. Much more upside is to come.
For details, you can go back to last week’s blog post.
______________________________
Elliott Wave Basics
There are two types of Elliott wave patterns:
- Motive (or impulsive waves) which are “trend” waves.
- Corrective waves, which are “counter trend” waves.
Motive waves contain five distinct waves that move the market forward in a trend. Counter trend waves are in 3 waves and simply correct the trend.
All these patterns move at what we call multiple degrees of trend (in other words, the market is fractal, meaning there are smaller series of waves that move in the same patterns within the larger patterns). The keys to analyzing Elliott waves is being able to recognize the patterns and the “degree” of trend (or countertrend) that you’re working within.
Impulsive (motive) waves move in very distinct and reliable patterns of five waves. Subwaves of motive waves measure out to specific lengths (fibonacci ratios) very accurately. Motive waves are the easiest waves to trade. You find them in a trending market.
Waves 1, 3, and 5 of a motive wave pattern each contain 5 impulsive subwaves. Waves 2 and 4 are countertrend waves and move in 3 waves.
Countertrend waves move in 3 waves and always retrace to their start eventually. Counrtertrend (corrective waves) are typically in patterns — for example, a triangle, flat, or zigzag. Waves within those patterns can be difficult to predict, but the patterns themselves are very predictable.
Fibonacci ratios run all through the market. They determine the lengths of waves and provide entry and exit points. These measurements are really accurate in trending markets, but more difficult to identify in corrective markets (we’ve been in a corrective market in all the asset classes I cover since 2009).
To use Elliott wave analysis accurately, you must be able to recognize the difference between a trend wave (motive) and a countertrend wave (corrective). There’s very much more to proper Elliott wave analysis, but this gives you the basics.
____________________________
Registration for Commenting
Want to comment? You need to be logged in to comment. You can register here.
If you register, it protects your information. It also allows you to comment without filling in your information each time. Once you’re registered, simply go to the home page and click on the login link top right in order to log yourself in. Usually, you’ll be logged in for several days before needing to be logged in again.
______________________________
Problem receiving blog comment emails? Try whitelisting the address. More info.
______________________________
The Market This Week
Here's the latest daily chart of ES (emini futures)

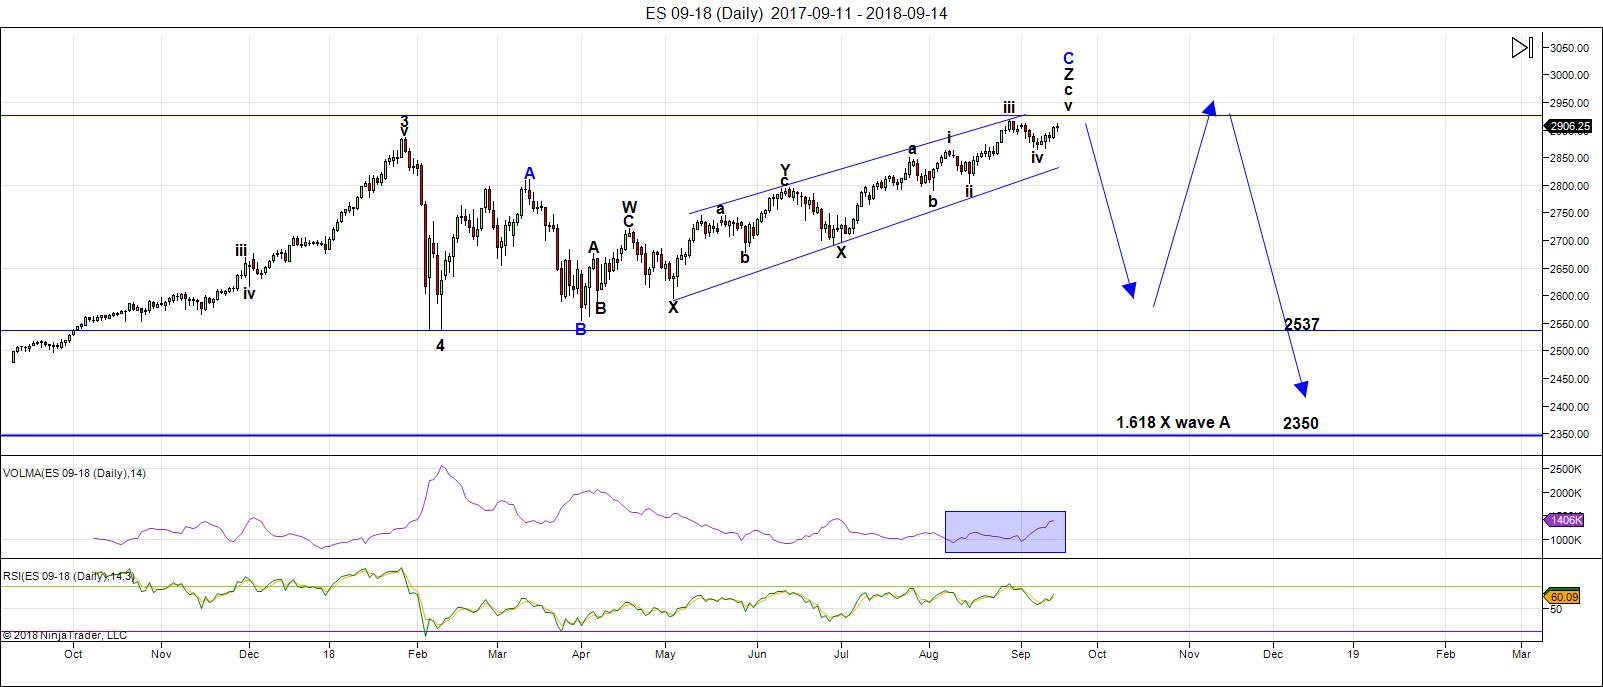
Above is the daily chart of ES (click to enlarge, as with any of my charts).
No change from last week. We're still waiting for the fifth of the fifth wave to a minimal new high before a turn down in the long-awaited C wave of a flat pattern.
My preference is for this unfolding fourth wave pattern is that of a expanded flat. However, technically, it could also be a running flat. At the present time, the B wave (that's the ABC wave up from about 2532) is longer than the A wave (marked as the 4th wave down from January 29, 2018). A regular flat registers as an expanded flat when the B wave is over 105% of the length of the A wave—ie, the B wave would need to reach above 2889, which is has done.
That means that the ES/SPX has multiple possibilities as to a target on the downside. Accuracy (in determining the most probable target) is going to depend upon both counting and measuring the waves to the downside. It's impossible to pick a downside target at this point in the process.
If we select all of wave 4 (on the chart—down from January 29) as the "A wave," then we're looking at an expanded flat. In that case, this outcome is the most probable:
- the C wave of a flat is typically 100 - 165% of the length of the A wave (so the target would be from 2532 - approx. 2360) - preliminary targets
There are other options:
- a running flat would trace out a C wave that is NOT longer than the A wave (in other words, it would not go to a new low). I regard this option as very low probability because it's extremely rare (I've only ever seen one of them). However, if NDX is tracing out a final impulsive pattern, its fourth wave should not be very deep, which may also restrict the length of the C wave in the SP500.
Volume: Volume has ticked up with Wall Street back at their desks after the summer break. However, it hasn't changed much in terms of market direction. This market is so weak, we'll likely need that volume to make it up to our target.
Summary: We're waiting for a top in a B wave, which will result in a C wave to a new low. My preference is that this structure represents an expanded flat, but there are other options. Once the c wave (down) is complete, expect a final fifth wave to a new high. That fifth wave up to a new high will be the end of the 500 year bull market.
___________________________
Trader's Gold Subscribers get a comprehensive view of the market, including hourly (and even smaller timeframes, when appropriate) on a daily basis. They also receive updates through the comments area. I provide only the daily timeframe for the free blog, as a "snapshot" of where the market currently trades and the next move on a weekly basis.
______________________________________
Sign up for: The Chart Show
Next Date: Wednesday, September 26 at 5:00 pm EST (US market time)

The Chart Show is a one hour webinar in which Peter Temple provides the Elliott Wave analysis in real time for the US market, gold, silver, oil, major USD currency pairs, and more. You won't find a more accurate or comprehensive market prediction anywhere for this price.
Get caught up on the market from an Elliott Wave perspective. You’ll also get Andy Pancholi cycle turn dates for the SP500 for the balance of the current month. There’ll be a Q&A session during and at the end of the webinar and the possibility (depending on time) of taking requests.
All registrants will receive the video playback of the webinar, so even if you miss it, you’ll be sent the full video replay within about an hour of its conclusion.


Back to break even on my IWM puts thanks to lowerng cost basis on the head-fake ramp higher. Now its time to get PAID!! ( I hope! ) 🙂
Have a great weekend everyone. This thing’s about to blow big time( just one man’s humble opinon!)
Actually Sir Charles, September is historically the weakest month of the calendar year. Check the historical returns. Furthermore, September in the second year of the Presidential cycle is weaker still. Yet here we are in September of a second Presdidential cycle year with almost all markets notching new all time highs. Old metrics are clearly irrelevant in the kind of market we are seeing and this is being demonstrated over and over again. The more I observe, the less likely I am becoming to attach any significance to the myriad things, like lunar cycles and astrological portents. It seems to me they demonstrate little, if any predictive value about market direction, despite claims to the contrary. I just don’t see it, no matter how hard I try find supporting data.
We live in an era of central bank stimulated equities market, both directly, and directly via bond fueled buy-backs. August 2018 was the biggest month ever, with repurchases of ovet 200 billion. We will exceed 1 trillion in 2018. The price we see in markets today is purely a matter of central bank buying, half a trillion in tax cut buybacks in 2018, and an absence of any signigicant short-selling which makes for healthy ebb and flow in markets. The markets are hopelessly broken, and we navigate them at our own risk. For any of us to assume we can have any way of knowing what a market like this will be doing 1, 6, or 12 months from now is sheer folly. Mr. Market has made liars of too many of us for that to not be evident!
Oh yes..i agree with you Mr Verne. I like to look in 1 to 3 month windows..have a bigger picture in mind..but only trade what I see..and thats why ive been so bullish..and why i continue to be..unless theres some significant development that can get the bulls to change behavior..then i will stay long. Bulls far outweigh bears and why every dip gets gobbled up..once SPX hits 3020 i will be more cautious or of course if we hit SIR PETERS 2790 level. Til then up..up..we shall go. Most of my scalping working so well..hard to change my behavior 😉
Adding some biotech on Monday..hoping for a dip. I like LABU at current price and some select small and mid cap biotech stocks.
Market strong like..bull again this week. For 1st time this year..imma fully long and looking to add some exposure on margin if we can get another dip or two. My 3020SPX target looks like a min high for this B wave.
.. materials and financial stocks finally starting to lead charge forward.
.. utilities..defensive sector lagging showing risk on back in full effect
.. Dow hit the new high and my 26.7k target..is 27.5k the next resting place..I think so!
.. Shanghai looks like a bottom is in and its heading back up. Added some FXI calls this past week.
.. Mr Copper..leading indicator..heading back up too!
.. imma expecting 2-3 more months of B wave into Nov before C wave begins. My thesis is shake up in mid term elections will lead to C wave pullback..still then smooth sailing IMO.
Imma fully long equities and shorting volatility on every spike. Not much risk of a pullback til nov IMO
We likely have a couple of fourth and fifth waves remaining in this leg up. I will continue to scale into longer term short trades with a very generous 25% stop. I personally believe the greatest near and midterm gains in the market will be to the downside. Any move much beyond SPX 3000 ( 2% or more) will have me switching to a more bullish outlook with a SPX 3600 target which in my view would be a final top and end of the bull run.
I personally dont like to short the market..unless there’s a confirmed change of sentiment..I might miss the first few percent down waiting for confirmation..but many a time when I tried to short the market..only to miss rest of uptrend..and worse yet..lost on my shorts..as the famous Bart Simpson said..the bulls ate my shorts..hardy har ha.
Now imma typically only short when scalping intraday or theres a confirmed change into a downtrend..we clearly are still in an up market..and me trying to pick a top..is akin to fools errand..imma just Trading what I see..2-3% more upside at minimum..and maybe much much more if imma lucky. Be safe my friend.
On the matter of irrational exuberance, I have to say I find it stunning that the banksters have been so wildy successful in massaging herd sentiment, that even experienced traders no longer consider an index like DJIA trading 200 points above its 2 SD B band an anomaly or cause for caution. I remember thinking the exact same thing last January when SVXY was similarly cavorting in such rarified air. Human nature NEVER changes, and THAT is one consistent truth you can always successfully trade…if you get my not-so-subtle drift! 🤗
Many a say buy the dip and shortlting volatility work..until they dont. Ive been playing with house money for so long as this uptrend has gone on for a remarkable amount of time..i know the B wave is long in the tooth..but i still see the NYSE hitting a new high to fall in line with all the other U.S. markets. Once that happens..we can get the C wave party started. Til then imma ride the surf waves higher and higher. I hope we see 3600..but imma thinking that would be the 5th wave. My target is 3500-4k for wave 5..but until we see how deep the C wave is..i dont wanna put good ole Mr Ed before the cart.
You are correct in your reluctance to short the market. For ten years now the banksters have made it their aim to specifically target and punish short sellers. Unless you have been scalping the moves down, short selling has been a loosing trade. For quite some time, including the biggest recent decline in January, no downtrend has lasted more than a few weeks due to brazen CB arrests. This is clearly not normal, and anyone who thinks it is is gravely mistaken. Because of this, I think it is still possible that we may not get another normal correction in this market, but an outright collapse, which clearly no one expects.
Mr Verne..you are probably most correct..if SIR PETERS count is correct..imma thinking we get a short C wave and all the buy the dippers come rushing back in..then we have the 5th wave for all of 2019..then the next financial crisis begins in 2020..catching all the bulls off guard..until theres something major to change the trend..the process of small dips and big rallies should continue indefinitely IMO. Economy and markets still look strong so until something shakes out..it should be smooth sailing for us bulls.
A new weekend post is live at: https://worldcyclesinstitute.com/coming-to-terms-with-the-dip/
This website is for educational purposes relating to Elliott Wave, natural cycles, and the Quantum Revolution (Great Awakening). I welcome questions or comments about any of these subjects. Due to a heavy schedule, I may not have the time to answer questions that relate to my area of expertise.
I reserve the right to remove any comment that is deemed negative, is unhelpful, or off-topic. Such comments may be removed.
Want to comment? You need to be logged in to comment. You can register here.