
The Parade Grows Larger and Larger
 The picture at left depicts a St. Patrick’s Day Parade in New York City. Somewhat appropriate to what I’m seeing in the markets.
All the Same Market: I’ve been mentioning for months now that the entire market is moving as one entity, the “all the same market” scenario, a phrase that Robert Prechter coined many years ago, when he projected the upcoming crash.
We’re starting to deleverage the enormous debt around the world. Central banks long ago lost control (they never really had control, just influence). They have tools, like “TARP,” for example, but treasuries dictate interest rates (the Federal Reserve just follows along). They’ve been attempting to fight deflation now for years, but it’s slowly taking hold.
We have an inflationary bubble which is about to break and you’re going to have a front row seat.
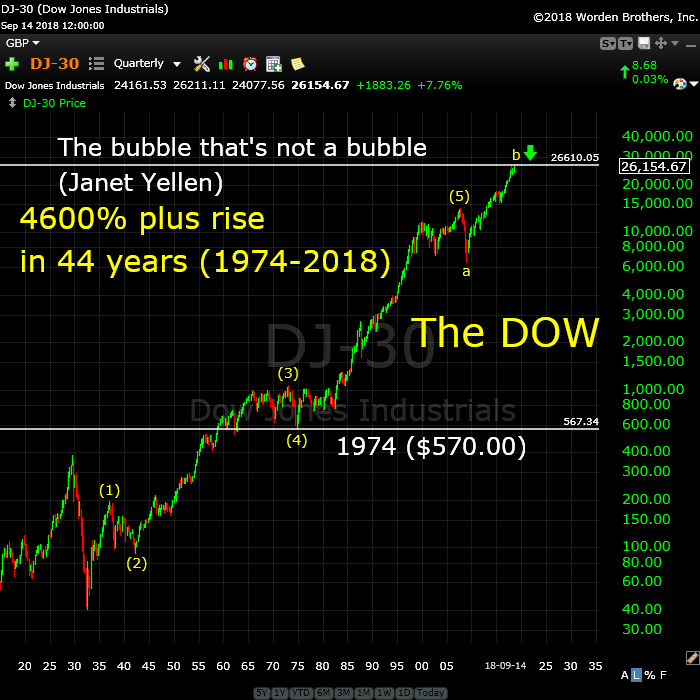
Above is a quarterly log chart of the DOW, showing the five waves up from 1932. This is the fifth wave of a three-wave impulsive sequence that began about 500 years ago.
What’s interesting to an Elliott-waver is that wave (3) is exactly 2.618 X the length of wave (1) and wave (5) is again about that same length. The “unnatural” B wave tacked on the top end has been inflicted by both the governments and central banks in collusion. But the history-making bubble is just about at an end.
Elliott wave analysts know that when you have a correction, it always reverts back to the area of the previous fourth wave of one lesser degree. That level was in 1974 when the DOW as at $570.00. I’ll let you mull that one over …
We’ve inflated away the value of our currency to the point that it’s worth four cents of what it was a hundred years ago, a few years earlier than the start of the above chart.
Much of the rise in this market is due to inflation. If you expect more inflation (and waves to the upside), you’ll have to wait for a very large correction in order to do so, because this wave count is all but done. It even has a B wave extension, which is a first time in history event. But even it’s at a full count.
I expect this market to turn over before Christmas. The crash may be early in the year, but the top is almost at hand.
The Dollar Leads the Way
The US dollar is fully in charge of both the equities and currencies markets. They’re all moving in tandem, as I’ve been saying since September of 2016. For a short while, currencies were moving contra to the US market, but gradually all the assets classes have started “drinking the cool aid” and aligning themselves so that they’ll all top at the same time … internationally.
If you do not look at the overall market and the asset classes that matter (oil, gold, USD currencies, and the US equities —as well as international indices), you will have no real idea where we are. For assets do not just crash midway through their wave structures. They all finish up five waves together and then turn down in a very predictable, organized manner. Worldwide sentiment becomes more negative than positive and the trend changes.
Even intraday now, I’m seeing almost all the assets I cover moving as one … in a parade to the top – eventually. But, unlike a parade, the market doesn’t move in a straight line.
The market does the most predictable thing in the most unpredictable manner.
About three weeks ago now, my blog title on the free blog was “Turn of the Century.” Well, haha, I was just a little early. That turn is still about to happen. At the time, I said I didn’t know exactly how it would happen, but I knew just about everything would turn at the same time. Eventually, we’re all going to complete the final 5th wave together.
It looks now like the top of the B wave will have just about everything lined up. USD currencies, the US indices, oil, gold, and the US dollar itself should all turn at the same time.
_________________________
Update on NDX
We’re closer to the top than many think. The impulsive structure of the NDX suggests that, once we trace out what might be a more complex fourth wave, we’ll have one more wave up to a new high. After that, it’s a multi-year bear market ahead …
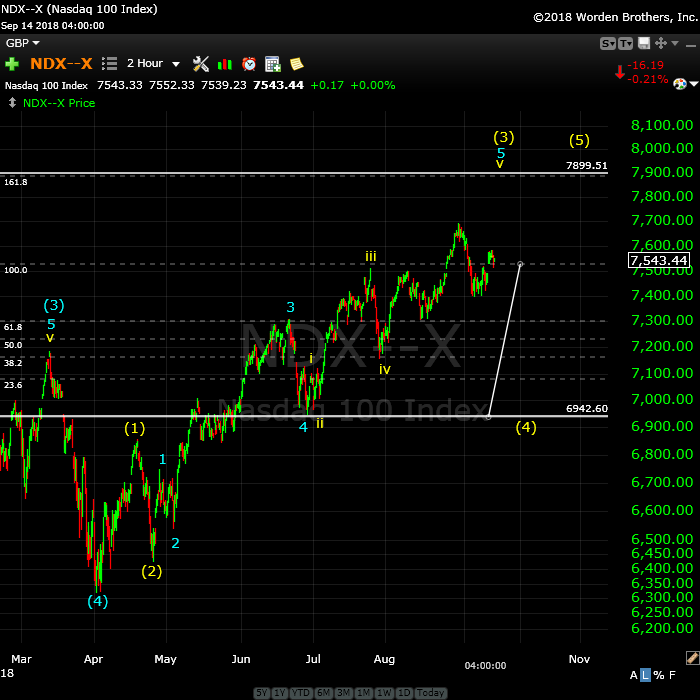
Above is the two hour chart of NDX (Nasdaq 100).
There are several ways to label this final set of waves up to the top of wave 3. I believe we’re in the fifth wave of the third wave with a top coming with a new high. That would lead to a larger fourth wave down, which will parallel the movement of ES/SPX as they complete a C wave of their fourth waves.
The larger fourth wave should come down to the previous fourth wave somewhere around the 6942 area. It cannot drop into the area of wave (1) or it would negate the impulsive wave and possibly lead to an ending diagonal.
These waves are the final two before the top of the 500 year rally. The fourth wave will likely come down “hard” as many of the FANG stocks are also set up for a turn to the downside. They’re all setting up for a turn at the same time, by the looks of it.
In any case, after the final 5th wave up in NDX is complete, we’ll turn down into the bear market I’ve been talking about here for the past three years!
The Australian Dollar—An Update
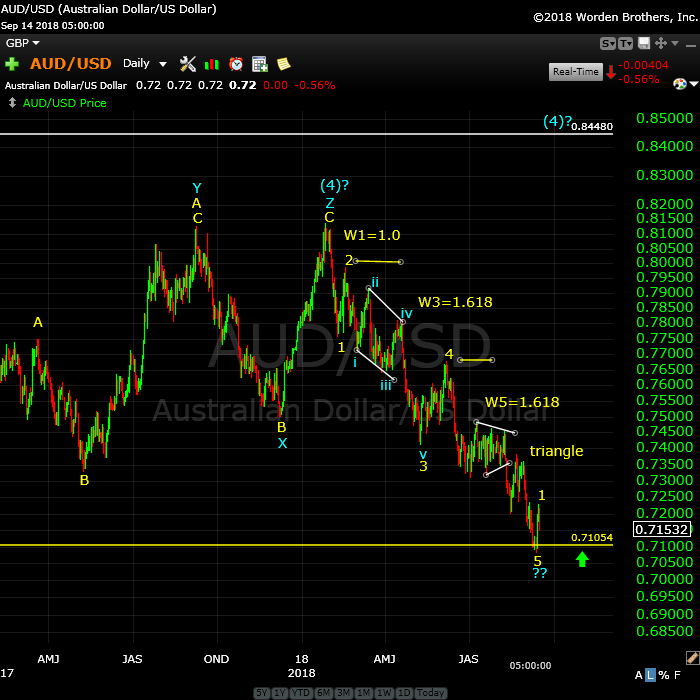
Above is the daily chart of AUDUSD. Last weekend, I showed the AUDUSD chart and called for a turn. This week, we got the turn and have now finished an impulsive first wave up and a second wave down to the 62% level from the turn. Much more upside is to come.
For details, you can go back to last week’s blog post.
______________________________
Elliott Wave Basics
There are two types of Elliott wave patterns:
- Motive (or impulsive waves) which are “trend” waves.
- Corrective waves, which are “counter trend” waves.
Motive waves contain five distinct waves that move the market forward in a trend. Counter trend waves are in 3 waves and simply correct the trend.
All these patterns move at what we call multiple degrees of trend (in other words, the market is fractal, meaning there are smaller series of waves that move in the same patterns within the larger patterns). The keys to analyzing Elliott waves is being able to recognize the patterns and the “degree” of trend (or countertrend) that you’re working within.
Impulsive (motive) waves move in very distinct and reliable patterns of five waves. Subwaves of motive waves measure out to specific lengths (fibonacci ratios) very accurately. Motive waves are the easiest waves to trade. You find them in a trending market.
Waves 1, 3, and 5 of a motive wave pattern each contain 5 impulsive subwaves. Waves 2 and 4 are countertrend waves and move in 3 waves.
Countertrend waves move in 3 waves and always retrace to their start eventually. Counrtertrend (corrective waves) are typically in patterns — for example, a triangle, flat, or zigzag. Waves within those patterns can be difficult to predict, but the patterns themselves are very predictable.
Fibonacci ratios run all through the market. They determine the lengths of waves and provide entry and exit points. These measurements are really accurate in trending markets, but more difficult to identify in corrective markets (we’ve been in a corrective market in all the asset classes I cover since 2009).
To use Elliott wave analysis accurately, you must be able to recognize the difference between a trend wave (motive) and a countertrend wave (corrective). There’s very much more to proper Elliott wave analysis, but this gives you the basics.
____________________________
Registration for Commenting
Want to comment? You need to be logged in to comment. You can register here.
If you register, it protects your information. It also allows you to comment without filling in your information each time. Once you’re registered, simply go to the home page and click on the login link top right in order to log yourself in. Usually, you’ll be logged in for several days before needing to be logged in again.
______________________________
Problem receiving blog comment emails? Try whitelisting the address. More info.
______________________________
Couldn’t be happier … KK 2
Couldn’t be happier …The analysis and insight you provide is simply amazing! I’ve been trading the futures and equity markets for well over thirty years and usually average around 5% monthly. Since joining your Traders Gold Service two months ago, that number has better than doubled. I couldn’t be happier.—KK |
Get an upper hand … JC 2
Get an upper hand in trading …Seeing all the different currency pairs and the wave structures and hearing you explain why this has to do that on a nightly bases gives one a upper hand when trading. Elliott Wave applies to all stock and indices and can be applied to any candlestick chart. If someone ask what you want for Christmas – Tell them a membership to Peter’s “Traders Gold!”—JC |
Have not had a losing week RW 2
Have not had a losing week …I have been with Peter almost a year. The only thing that matters is have I made money with his service. I think I have finally turned the corner using Peter’s EW. I have not had a losing week in the last 5 months. Thanks Peter, for your amazing amount of hard work. —RW |
The best of them JL 2
The best of them …Last couple of years, I subscribed to several ‘market traders’. You are by far the best of them and the personal contact is awesome. Daily and daily updates are very well written! Besides your expertise in EW, I also like your cycles analysis. Best investment I ever made! —JL |
A true expert in Elliott Wave FL 2
A true expert in Elliott Wave …You are a true expert in EW analysis. What you provide is not available anywhere and is priceless. Subscription on your services is the best thing I have ever done. Many thanks for your effort to make me a better investor. I now have more trust in my investment decisions. I hope you will continue the excellent work! —FL |
Rise above the rest … SM 2
Rise above the rest …I have only ever met a few people who, in their chosen fields (astrology, medicine, music, martial arts, technical analysis), rise above all the rest and you are one of them…you have ‘the gift’…and that’s why I’m a Trader’s Gold member. —SM |
Tops in your field DZ 2
Tops in your field …You are tops in your field. Tried to follow Elliot Wave international for years. They were always behind the market. After discovering you, I perceive that you are an expert in reading the waves, which puts you way ahead of the rest of your peers. And you can read the Waves like you are reading tomorrow’s financial section. I pray you stay healthy. —DZ |
the real deal SM 2
The real deal …‘Educational, insightful and thorough market analysis for all levels of traders. It’s Elliott Wave at its best….Peter Temple is the real deal’ —SM |
The Market This Week
Here's the latest daily chart of ES (emini futures)
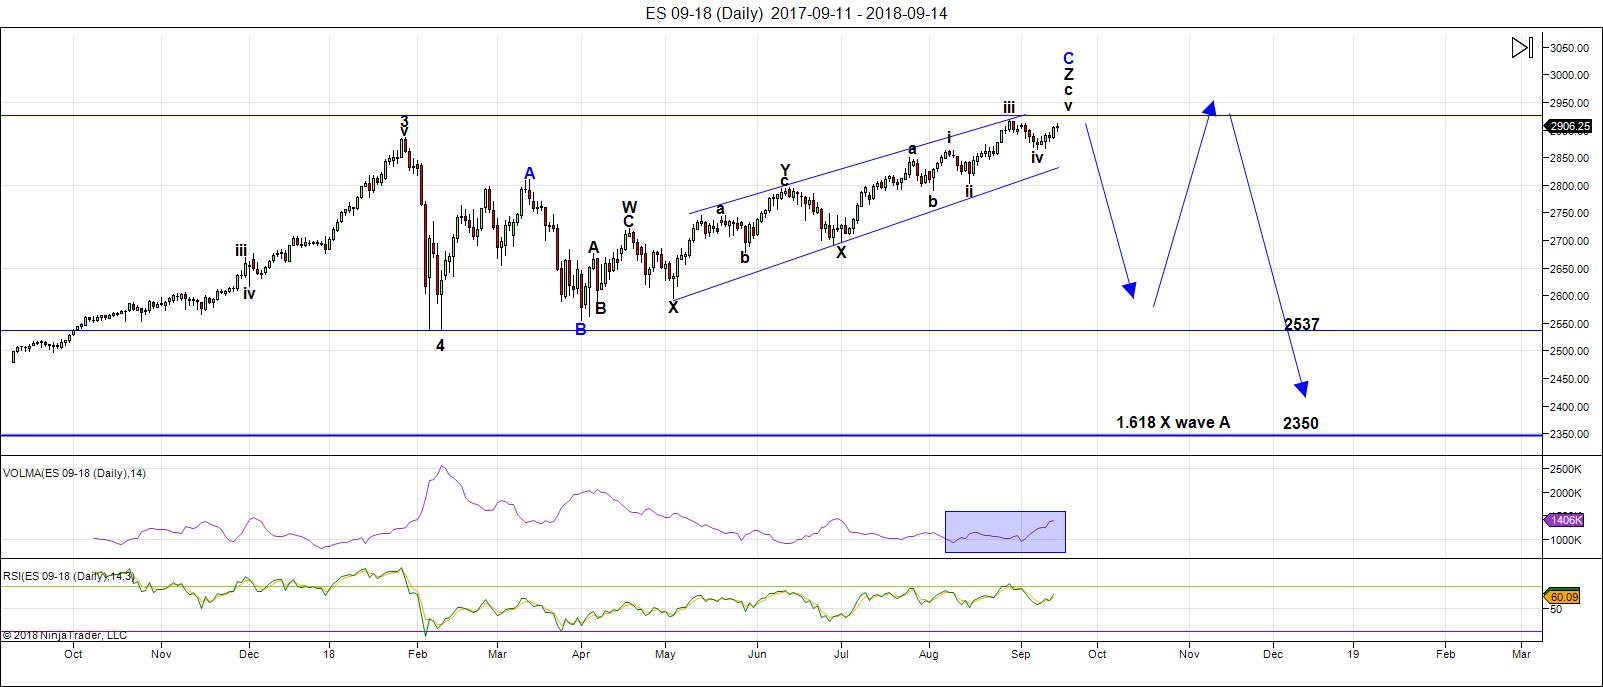
Above is the daily chart of ES (click to enlarge, as with any of my charts).
No change from last week. We're still waiting for the fifth of the fifth wave to a minimal new high before a turn down in the long-awaited C wave of a flat pattern.
My preference is for this unfolding fourth wave pattern is that of a expanded flat. However, technically, it could also be a running flat. At the present time, the B wave (that's the ABC wave up from about 2532) is longer than the A wave (marked as the 4th wave down from January 29, 2018). A regular flat registers as an expanded flat when the B wave is over 105% of the length of the A wave—ie, the B wave would need to reach above 2889, which is has done.
That means that the ES/SPX has multiple possibilities as to a target on the downside. Accuracy (in determining the most probable target) is going to depend upon both counting and measuring the waves to the downside. It's impossible to pick a downside target at this point in the process.
If we select all of wave 4 (on the chart—down from January 29) as the "A wave," then we're looking at an expanded flat. In that case, this outcome is the most probable:
- the C wave of a flat is typically 100 - 165% of the length of the A wave (so the target would be from 2532 - approx. 2360) - preliminary targets
There are other options:
- a running flat would trace out a C wave that is NOT longer than the A wave (in other words, it would not go to a new low). I regard this option as very low probability because it's extremely rare (I've only ever seen one of them). However, if NDX is tracing out a final impulsive pattern, its fourth wave should not be very deep, which may also restrict the length of the C wave in the SP500.
Volume: Volume has ticked up with Wall Street back at their desks after the summer break. However, it hasn't changed much in terms of market direction. This market is so weak, we'll likely need that volume to make it up to our target.
Summary: We're waiting for a top in a B wave, which will result in a C wave to a new low. My preference is that this structure represents an expanded flat, but there are other options. Once the c wave (down) is complete, expect a final fifth wave to a new high. That fifth wave up to a new high will be the end of the 500 year bull market.
___________________________
Trader's Gold Subscribers get a comprehensive view of the market, including hourly (and even smaller timeframes, when appropriate) on a daily basis. They also receive updates through the comments area. I provide only the daily timeframe for the free blog, as a "snapshot" of where the market currently trades and the next move on a weekly basis.
______________________________________
Sign up for: The Chart Show
Next Date: Wednesday, September 26 at 5:00 pm EST (US market time)

The Chart Show is a one hour webinar in which Peter Temple provides the Elliott Wave analysis in real time for the US market, gold, silver, oil, major USD currency pairs, and more. You won't find a more accurate or comprehensive market prediction anywhere for this price.
Get caught up on the market from an Elliott Wave perspective. You’ll also get Andy Pancholi cycle turn dates for the SP500 for the balance of the current month. There’ll be a Q&A session during and at the end of the webinar and the possibility (depending on time) of taking requests.
All registrants will receive the video playback of the webinar, so even if you miss it, you’ll be sent the full video replay within about an hour of its conclusion.


Hehe! The banksters are going all out to rope in the last few remaining suckers. Yikes!
October 12 170 strike puts now at 179/182 bid/ask.
I am staying disciplined and waiting for a CLOSE beneath critical resistance at 170.50, unless of course we see an intra-day impulsive decline from beneath that pivot.
Financials finally looking strong too..
..Upside break out in bonds boosting financial stocks..yee haw!
..Citgroup and Jp Morgan getting ready to launch
..Insurance stocks at 7-month high!
..Prudential..Principal..and other insurances stocks breaking out
I can feel new highs a coming!
Yer can, can yer?
Got that lovin’ feelin’?! 😀😀😀
My Dow projection of new high inching closer.
Good thing you didnt take the bet.. 😉
IWM 170 Oct 12 puts now trading for over two bucks.
Why don’t I pull the trigger and go with intact sell signal, you ask?
Because I know how these %#×#€£× banksters roll! 😁
They are still screwing around and I want to see a gap down that sticks to tell me that they are screwed…Hehe!
Come on banksters! Do your thing with one more asinine IWM counter-trend bounce so I can snag my 200 contracts…PUHHHLEEEEZE???!! 😁😁😁😁
Reloading IWM 170 puts for 2.00 even, same price paid last time. Until we get a gap down I will keep scalping the bounces. STC order for 2.25 GTC on half.
One advantage of trading big lots is you do not need a big move to turn a decent profit. Clearly not for everyone as risk is also greater. I think each trade should be limited to 3% or less of account exposure.
Everyone thought I was crazy..when I said SPX would hit a new high and it did..
Everyone thought I was crazy..when I said Dow would hit new high and today it was within striking distance..just 150 points away.
Well, you might be crazy because I’ve been calling for new high consistently since July. Or maybe nobody noticed …
Imma sorry..I thought you were saying dow wouldnt hit new high..i know several on here said Dow wasnt going to hit new high.
Not a big deal. I’ve actually been saying that the DOW is probably going to be a flat. The definition of a regular flat is a double top, but they can end a little bit lower or a little bit higher. Whether the DOW does or not doesn’t make any difference to my count, so I’m not focussed on it.
But if I’m saying the SP500 is heading higher, it would be odd to not have the DOW and other related indices not do the same thing. However, the upside is extremely limited.
Thank you!
Yes..imma taking that risk into account..SPX been mostly flat over past few weeks..in range bound..drifting sideways..but select stocks that i own are giving me the alpha my portfolio needs..along with scalp trading..
Is drop below..2790 still your line in sand on SPX..for confirming C wave or has that changed?
That hasn’t changed.
You are clearly NOT crazy…just the banksters…
Hyuk! 🤗
Charles
I am happy you are making money .
That said despite my bearish bias i do hold several
stocks through different market sectors .
recently added was gold stocks which i did say if im wrong i am giving
that sector until January .
the semiconductors index ( sox ) is at an interesting junture right now
and looks to be in a sideways pattern.
there are other various stocks that have been trading sideways all year long.
i am in agreement with you in regards to a late 2019 – 2020 bull market top.
That said the world stocks markets are my concern as is my own cycles work.
Peter has stated many times he was looking for a wave 4 then wave 5 scenerio
which has been basically calling for higher prices.
there are others here who trade on the bullish side in various stocks as well
as have long term bullish holdings .
bottom line: im happy your making money and your trading has been excellent
yet your not the only one benefiting by this run higher .
to give you a run down.
i own
semi stocks
bank stocks
healthcare stocks
insurance stocks
generic drugs
basic materials ( iron steel aluminum copper and recently gold stocks )
some oil ( refinery )
a couple reits with 11 % dividend which i have had for a few years now.
weat and nat gas added last year.
its a Hodge podge mix yet as verne said it is a good idea to limit your risk
by a set % of your total .
the rule of thumb from what i have read is to keep your stock exposure
to a limited number of stocks so you can keep track of them.
i do not subscribe to that theory.
my bias is to buy into the sector im looking to get into by purchasing
5 to 7 stocks of what i think shows the best value as well as technical set up.
then over time thin out ( sell some stocks off ) and reduce risk and use that money to put into a different sector. all in all over time different sectors
will end up as ” house money ” so to speak . its never really house money though.
portfolio management is work in progress that never ends yet i find that holding on to at least a portion of any stock i purchased helps keep me in the game without being overly exposed to any one specific stock.
as an example only . i lightened up on AMD at 15 and change in early 2017.
i was looking to buy some back near 7 yet that level never came. AMD now in the 30’s and is up huge % wise this year and i can hold it .
NVDA i had sold a little over time from my purchase in the 15’s .
last sale was at 180 . i can hold it forever since my cost basis is negative .
I have not been using any leverage in the stocks im talking about above.
the recent gold stock purchases are up 4 % since last fridays purchase.
im not interested in any one specific stock of those 7 purchased im only interested in the group and how well is tracks either the xau or hui index.
My overall portfolio bias is based on several themes .
i view a war cycle as bullish basic materials
i view political turmoil as bullish the gold and silver stocks ( these are not an investment per say )
semi conductors i view as bullish based on the fact that some how they end up
in everything we use .
a stock like MSFT when it was 18 bucks made sense , i thinned it at 66 and can hold it for a while since its now using ” house money ” ( which isn’t really house money )
ABT i purchased with money made from CELG . ABT is due to be thinned yet
i have owned it for several years and im not at risk of losing my initial investment in it .
All in all im tracking with live money invested some 60 different stocks.
yes it is way more than people recommend yet if you get the theme correct
and the market moves in your favor its easy to just hang on doing very little day to day .
That said : bull markets make people think they are genius.
Bear markets make people realize they are not genius.
when this market turns down, the bulls in the crowed will get quiet .
the sun rises and sun sets . its a cycle .
enjoy this upward move while it lasts .
im still sitting on roughly 50 % cash and unless i can find something
which gives me an edge or a reason to buy ill keep my cash .
anyways
dont stop doing what your doing, i just have a different way which works for me.
Joe
i like your approach Joe..
I typically own 50-60 stocks too. Some of my favs include..
NVDA..owned since low 30s..
ABMD..owned since 150ish..
SQ..owned since 25..
ALGN..owned since mid 180s..
PAYC..owned since 75..
TREX..owned since 40..
MED..owned since 58..
Been moving more into domestic small and mid caps..with strong dollar..staying away from multi-nationals and foreign stocks for most part.. I tend to use sector rotation..along with RS..and also some fundamental as well as technical indicators..to select stocks in sectors with favorable sales and earnings..i like well run companies with monopolies within their industries..
Trend trading..I use options on indices.. Then scalping..I use mostly 1-3 day options on indices. I like using a combination of analytics..
EW..SIR PETER is top notch analyst
Technical..like using 50 and 200 day MAs and RS indicators along with bollinger bands
Fundamental..i use a number of screens such as earnings..valuation..sales..ROI
This approach has worked well..
Charles
i have said the Dow would not make a new high this year .
i have not spoken about the spx or the nasdaq .
a week or 2 ago i said im most likely going to be proven wrong .
so far though No new high in the dow as of yet .
My bias for the entire year was that we would have a very long sideways move
in the dow and then it would run higher through next year into 2020.
it is looking like im going to be wrong yet it wont hurt me if i am.
i was viewing this year as a mini bear market with in a bull market .
( that is why i held stocks even though i thinned them out to reduce risk )
the next turn dates are oct 12 and nov 8 .
my concern is more the nov 8 to jan 20th time frame .
my bearish cycles end jan 20th yet begin to turn up following the oct 12
cycle low . ( yes i can be wrong ! ) yet i wont ignore my work .
what ever is going to happen , in my view anyways . is the mid term elections
the nov 8th date going into the jan 20th date .
things should begin to show themselves surrounding the oct 12 date.
despite what i think though, the market index’s other than the dow have proved
me wrong .
yes..imma thinking mid term elections is when we get C wave..continued B wave up until then.
My targets are..
3020 on SPX..
26.7K on Dow..
7800 on N100..
13700 on NYSE..
1800 on Russell 2k..
Foreign funds will continue flowing into U.S. of A through 2019 keeping bull market in tact until 2020.. Dow could hit 35K to 40K and S&P should hit 3.5K to 4K IMO.
All depends on how deep this C wave is.. just my 2 shiny Lincolns..
Clearly the expectation of no new DOW high is now a very low probability. It is hard to imagine it getting this close and not traversing the last few points. More significant is that a new DOW high will serve as a DOW theory confirmation of the current bull market and that makes me more open the idea of new ATH after the upcoming correction. I for a long time have been of the opinion that any serious decline in the markets would happen in the face of central banks attempt to prevent it and would therefore signal their loss of price control. The implication of all this is that the coming decline is going to be so severe it will force a public announcement of a renewal of Q.E., as well as a halt and possible reversal of FED rate tightening. This would be the perfect scenario for a final manic wave upwards based on a crass manipulation of herd sentiment and an attempt to re-convince them of central bank omnipotence despite the scare of the current correction. I still have some hesitancy regarding how a precipitous fall in this market is going to be halted. There are no short sellers left to cover and produce a market bottom and that function is critical. Whatever the outcome, I suspect the coming dive is going to be lot worse than everyone expects….a lot worse!!
I cannot believe someone snapped up my IWM 170 puts for 2.50!
Wassup wid dat?? Reloading with another bid at 2.00 even. Yikes!
ProShares has now rolled out the refurbished ( reverse split 5 for 1) leveraged piece of crap that is SVXY. I think they are hoping people have already forgotten the last scam. It is probably going to zero and I am waiting for the puts to start trading!
Joe,
You say the marketsother than the Dow have proven you wrong. It still seems to me that you can right. Can you comment more on your October 12 and
November 8 dates? Are those dates potential lows? It seems to me that both you
and Peter T see down (4th Wave) then up to new highs.
Would you care to comment? Why not October 12 low then November 8 high then important low in January?
I suspect Joe is simply looking at what the market is actually doing pricewise, rather than relying on his expectations of what it would or would not do! 🙂
Here come the new highs..woo hoo!
Yes indeed! And a chance to snag more cheap IWM puts! 😉
I played that yesterday for a quick 30%..thank you for the idea.
Sir Charles, you are my kind of trader!
Most welcome my friend!
Is anyone still following market price and lunar cycles? Granted my data set is tiny, it has so far confirmed what several other researchers who took a close look at the issue over an extended time period. There is simply no consistent, tradeable correlation.
There will be occasions where it does appear to be the case, and then without warning or obvious reason it disappears. If you think about it it makes perfect sense. If it were a truly reliable methodolgy, more people, including me, would use it! 🙄
I have looked at these cycles..on and off..for years..I do see some correlations..but as you said..very unreliable IMO..the full moon..market going up..as SIR PETER laid out a few weeks ago..seems to have a 100% track record lately..I know he thought this last one would be different..but that one turned up too. I have seen..puetz window..work sometimes as a potential crash period..Other than that..i prefer to ignore the noise and just trade what i see.
Amen! 🙂
Trying to make predictions about what Mr Market will or will not do, especially near term, has turned out to be a fool’s errand has it not? 🙂
Yes..imma just buying the dips..working like a snake charmer!
Dow new high and SPX getting closer to my 3020 target.
Buying October 12 IWM 165.50 puts for 0.74
How come so far outta money?
A bit more attractive delta. I am also expecting a pretty hard drop in IWM between now and then.
Adding to IWM 165.50 puts to lower cost basis to 0.70 even.
I dont see a decline coming til at least nov..way too bullish.
You are not supposed to! Hehe!
VIX printing green today.
Mr Verne..imma trading what I see..i just dont see a decline coming. In my 40 years..this looks to me like a strong bull market..I know we get a pullback soon and why 2790 is my stop..but seems we have more upside before this tops..
The 170.50 former support shelf now proving formidable resistance for IWM progress higher, despite the ramp in DJIA and SPX.
We also have a gap fill in VIX at precisely 11.31 today, truly remarkable!
I am now looking for a broad reversal and I think it will happen intra-day in the next few days. That could be delayed if VIX goes lower.
I’ve sold out of Dow longs today. We are at a double top and I wait to see if we turn down here as per Peter’s running flat or continue to rise.
Glad you did well on the trades Mr Q..
Imma still thinking we are waiting on NYSE to hit new high..then it all rolls over.
Closed out my volatility shorts for great profits..still an outside shot we see VIX below 10..but not gonna press my luck..and hate holding em over night.
Back to scalping!
Dow within 20 points of my 26.7K target..New high..as I was expecting.
Dow could actually extend to 27.5K
I would not be surprised to see it hit the round number just for kicks! 🙂
Adding some Nov DIA..SPY..and QQQ calls on trend trade for another 2% upside
I would not be surprised to see it hit the round number just for kicks! 🙂
Today, for the first time in a long, long time both DJIA and SPX closed at new all-time highs accompanied by a distinct negative divergence on the NY daily a-d line. That in itself doesn’t turn markets around but there were also a huge number of consecutive Hindenberg Omens (another today) coupled with the fact that today’s new all-time highs were accompanied by a negative reading (-2.6) on the Ratio Adjusted McClellan Oscillator. That’s only happened on 4 previous days in the past 22+ years…7-19-07, 11-13 and 14-2013, 9-18-2014… Going back in time, it also occurred at the very major top on 1-11-73. The next dip might be one that will bite the BTDers. Don’t know what today does to wave counts but in many ways it qualifies as a potential major top!!
Mr G..imma fully loaded for another 2% upside..SIR PETER says N100 needs another high for top of market..thats 122+ points higher from todays close..about 1.6% higher plus it always extends a lil. I would say we top Nov 7th..then mid term elections light the fuse for downside. I cant see any other events coming to blame the decline on.
Thanks for this, Peter.
Charles
good call on the market .
its looking to me like the us dollar has more downside yet i dont trade
the currencies. im strictly looking at the indicators i use on that index.
the daily chart has more downside , the monthly chart has more downside
yet the weekly chart by indicators only is still has an overbought reading.
this may only provide a pop to the upside in gold or silver .
cash dow: 27003-27296 is the next cluster of resistance yet …….
Next week will be important.
weekly Cash dow chart .
weekly low : week of feb 5 plus 18 weeks is week of june 11 plus 18 weeks
is the week ( week of oct 15 )
the above a low to high to high count.
shorter term .
week of april 2 low plus 12 weeks was week of june 25 low plus 12 weeks
is this week ( week of sept 17 high ? ) .
week of april 2 was an important low as was the week of june 25
this implies this week should be important . if the market turns down
next week we could see a healthy decline .
im not pushing the bearish or bullish scenario though just noting
the time counts .
ED ill follow up on the oct 12th date on the weekend in more detail
than right now . The mid oct time period is where mercury and venus
meet the sun . on oct 13 using a simple web search on bing. i used
mercury venus conjunction. what showed up in the search was
a planatary chart that you can move forward or backwards in time.
i cant get thhe link since its in the web search .
what you will see is that on oct 13 venus and mercury meet ( conjunct )
the technical of this theory is when venus meets the sun or mercury
you tend to see a market high . yes a high . yet there is more to it.
what will be taking place is venus will be changing from an evening star
to a morning star . that change creates what is called a venus bull market .
hence despite the run higher i am much more hesitant to become bearish
as we enter the mid oct time frame. as venus and mercury become morning
stars they will lead the sun and run out ahead of the sun each day . approximately 10 months later in august 2019 we will then see the sun meet
venus and mercury again and at that time we go into another 10 month bear cycle. the rule of thumb on this theory ( it was tested from 1990 back to 1890
by Barbara koval ) the theory goes like this . when you see a down market in a venus bull cycle then when the venus bear cycle hit look out below .
on the other hand, when you see an up market in a Venus bear cycle then when
the Venus bull cycle hit look out for much much higher prices .
blending together with this on oct 12th we have a mars uranus cycle low due
followed by a nov 8th cycle high then a jan 20 2019 cycle low . that time period
correlates with extreme bearish moves in the stock market .
to blend this together one last time . on nov 9 2018 the sun conjuncts mercury
which to me starts the venus bull cycle. there is one caveat . there are times
when you get mercury selling .
Bottom line: the time period between oct 12th and nov 9th is going to be tricky
since it is the starting point for the Venus bull cycle . the January time period
is the end of the mars Uranus bear cycle .
i could include the next mercury retrograde time period which is November 17 to December 6
and while im at it note the next venus retrograde time period .
October 6 to November 16 .
i do not have any theories on venus retrograde cycles yet i do in regards to mercury .
i am aware of though that when both venus and mercury are retrograde at the same time some sector of the market will go nuts and its usely to the upside
( you need to get the sector correct since its not just everything )
lastly as i tie all of this together . there are some who follow venus retrograde cycles ( i have not tested this at all ) they say the move will be from start of venus retor to its end point then the market or sector will reverse when venus goes direct . look at the above though , ven retro oct 6 to nov 16 and then mercury retro from nov 17 to dec 6 .
i understand this is going to be a detail in the venus bull theory i will dig into in much more detail yet at this time i do not have an opinion on it .
mercury retro will be important using the 10 day lag ( nov 27 to dec 16 )
this entire time period from oct 6th to dec 16th will be weird .
once we get through all of that then the picture should clear up .
my bias though has not changed .
we have been in a bearish time period for most of this entire year and we are
going to enter a bullish time period , the start point from oct 12th to nov 9th
will be the time to be a shorter term trader since we will have a few oddities
to deal with yet from my point of view after we get through it the markets will turn higher basis the cash dow .
The us dollar index as well as gold and commodities and weather patterns
as we enter the winter months should be followed more closely .
we are going to see a change of trend which at this point is to early to call.
the details i can add to this are graphical and take much more to time to lay out .
verne
i follow my models along with the market so yes i do watch what price is doing
and when my models tell me im wrong it is fairly straight forward .
Thank you Mr Joe..I agree that market goes up til Nov 7..we are in a very bullish seasonal pattern now..not many bears and unless there is some sorta event that can shift the bulls to bears..this market should keep melting higher and higher. Market rose this summer on no volume..now that we have volume..bulls are pushing markets higher and higher. We should hit at least 3020 on SPX before we see a major decline.
Peter G
you make some very good points .
ill high light what i wrote above .
weekly Cash dow chart .
weekly low : week of feb 5 plus 18 weeks is week of june 11 plus 18 weeks
is the week ( week of oct 15 )
the above a low to high to high count.
shorter term .
week of april 2 low plus 12 weeks was week of june 25 low plus 12 weeks
is this week ( week of sept 17 high ? ) .
week of april 2 was an important low as was the week of june 25
this implies this week should be important . if the market turns down
next week we could see a healthy decline .
Last comment for now .
look at a weekly us dollar index chart as well as a weekly cash dow chart .
take the week of aug 13th bar and compare them .
24965 cash dow low and 96984 dollar index high.
the weaker dollar is now driving the cash dow higher.
so the question i ask myself ( not an opinion ) what happens once
this decline which began back in jan of 2017 in the us dollar ends ?
Imma not seeing the correlation..
UUP was down 9.1%.. in 2017
UUP is up 3.6%..in 2018
Dow up 28.1%..in 2017
Dow up 9.4%..in 2018
SPX up 27%..in 2017
SPX up 10%..in 2018
Additionally..strong dollar 2014..2015..and 2016
Dollar was up 21.4% from 2014 to..2016
DOW up 26.3% from 2014 to..2016
SPX up 26.7% for 2014 to..2016
Stocks rise regardless of dollar
In fact..I argue that when U.S. dollar is strong..capital flows out of foreign assets into U.S. dollar..U.S. bonds and U.S. stocks
And why I see U.S. bull market lasting until at least 2020
NYSE needs another 400+ points to a new all time high..this to me..will be top of B wave for U.S. markets..that would be a 3% increase from todays close..I imagine it will take 6 to 8 weeks to get there. Right in line with U.S mid term elections. Then we get 2 to 3 weeks of C wave and 5th wave should go from end of 2018 to beginning of 2020. Thats my thesis..for what its worth.
And add 3% to todays spx close..and you get my 3020 target 🙂
I’ve added a small long Dow and S&P. keeping stops close for now.
Mr Q..that seems prudent to me. Imma planning for 3% more upside..right stops
That would be most interesting! 😬
I certainly could be wrong, but this sure looks to me like a terminal wave folks…we will certainly have our answer with the profile of the first wave down…
Yes it will all come down..but when..and how much higher before the turn? My moneys on new high for NYSE and 3020 on SPX..still 3% upside IMO.
In a move like this, we get multiple 1-2% moves both up and down. The only strategy that I have found in these environments is to sell at the top of resistance trend line and then cover half at support line. Keep doing it till one of the trend lines are broken. I have not come up with a reliable way of projecting the final level (with reliable, I mean a method that works on historical data with both in and out of sample). There is a trendline resistance right here (ES @ 2940) and another @ 2965. That trendline hits SPX 3000 around Oct 18.
Good sound strategy Mr V..i use fib ratios and wave length projections to get likely targets..then I sell once targets are hit and roll just the profits forward..essentially playing with house money. Thats worked from spx 2600 up to 2940..and counting. Next stop is at 3020 IMO.
Dow hit my 26.7K target..now looking like its onto 27.5K..
Adding IWM calls and VIX puts
I think we tag SPX 2950 before the turn…
Deploying October week two SPY 230/232 bear call spread.
I still say 3020 at min.
Bought DIA 267 September 28 265 puts for 0.70…
Adding to IWM 165 puts….
Imma taking the other side hardy har ha. We shall see who wins..
Ha!ha! I already know the answer! 🙂
The fact of the matter is the way they are whiplashing this market, BOTH bearish and bullish nimble trades are making money, so there!
I bet you did not expect that answer!! 🙂
The crooks at ProShares are still not allowing option trades on SVXY. Still no bids and no volume.
Wassup wid dat? They really are to clever by half..Hehe!
Nice BEC in IWM! Gidyap!
The hubris of these banksters is truly stunning. They apparently think they can convince the clueless herd that they can keep prices miles above 2 SD B bands with collapsing market breadth.
I will take the other side of that trade….Thank You!! 😜
Cost basis on IWM 165.50 puts down to 0.65
They are doing their damndest to keep the dam from busting…Huyk! Hyuk!
Turkeys!!!! 😁
Another remarkable move by VIX into prior gap area below 11.31!!
Free money!!! 😀
I have vix going sub 10..Be careful!
Entirely possible, but I assure you it will not remain there for long. I expect next on the programme is not a sub-ten move but a gap higher. We are in the final small wave of this impulse up…yahoo! ☺
Buying Oct 3 VIX 12.00 strike calls for 1.10.
You’ve gotta be kidding me! Yikes!
The natives ARE bullish to the point of being downright giddy! 😱
It is not very often that you get a fat reversion to the mean pitch right over the center of the plate!
In fact the extremity of the current overbought conditions coupled with all the negative divergences at these new highs is really amazing, and strongly argues for a reversion THROUGH the mean!!! Am I the only trader jumping on this??!! He!He!
I think there maybe 10 or 12 other bears left..hardy har ha. Imma buying calls with every penny left..May even margin up small position if we get any type of dip.
Boy you sure got that right. In fact I thought I was the only one left!
As Peter T says, just lil’ ole’ me! 😀
in my cave, eyes peeled … lol.
He!He!
Speaking of VIX, if we take out the last divergent low on August 8 of 10.17 on a CLOSING basis, I will stand corrected… 😇
Speculative trade on 267.50 DIA puts expiring today for 0.35.
Small lot of 25 contracts for you-know-what and giggles.
Market makers are masters of OpEx shenanigans so they will probably expire worthless! 😁
Mini gap higher in VIX. Looks to me like we are setting up for some droopage into the close people…
If they keep VIX pinned to the floor I know I am going to get ripped off on those puts if they stay in the money. If they don’t pay at least intrinsic I’m taking assignment….what the H E double toothpicks!
One problem for bearish traders ( trading vol) with irrational exuberance is that even after the marketmstarts to dive a lot of the herd initially keeps right on snoring and VIX remains muted. Of course all the BTF dippers not already fully leveraged long wil keep on doing what they do. Nothing new under the Sun, as the Preacher said! 😉
Really fascinating how bullish everyone is! “No top in this market any time soon!”
Mamma Mia!
No..a few more months up probably for NYSE to top then boom..down
I will probably regret not holding but not too interested in playing “Whack-a-Mole” with the market makers. Opening contingency STC on take out of this morning lows at 266.60. Puts should bring at least a buck…
Bid/ask now at 0.49/0.54 on DIA 267.50 puts expiring today. Can we get a double here??!! 😁
I knew it!
Those %#*&!!! market makers are going to do their damndest to prop DIA price above 267!!!! 😠
I thought we were done but looks like we may still be in a small fourth. Rats!!!! 😁
Bids are lousy, as expected.
I will be putting in the money shares to ’em if they don’t pony up! 😀
Had to settle for a lousy 0.42 for my puts. And people think this market’s not RIGGED????!!! lol!
What whaddya know? They actually filled at 0.46!
I STILL got robbed! DJIA should be down a few hundred points if this market was not a total crap shoot! 🙂
This website is for educational purposes relating to Elliott Wave, natural cycles, and the Quantum Revolution (Great Awakening). I welcome questions or comments about any of these subjects. Due to a heavy schedule, I may not have the time to answer questions that relate to my area of expertise.
I reserve the right to remove any comment that is deemed negative, is unhelpful, or off-topic. Such comments may be removed.
Want to comment? You need to be logged in to comment. You can register here.