
 The Dilemma in the US Indices
The ending diagonal that I’ve been concerned about all this week is crumbling. In ES and SPX, it looks like we’re going to morph into a contracting triangle. I see that happening across most of the major US indices.
The ending diagonal has been questionable right from the third wave, due to the fact that it counted as a ‘5’ until we got the C wave up. But even then, it doesn’t have the right look, and the fourth wave has taken so long to form that it’s ability to reach the downside target in ES before the trendline diverge is not probable.
In SPX, it’s all but impossible.
So, we’re back to the triangle idea in almost all the US indices, although at a higher price point, and I’m so early in this call that it requires the market to confirm it.
I’ve listed my reasons in the explanation under the chart of ES. The key factor is that the US Dollar and USD currency pairs still have to trace out a final large wave. The US indices have to burn some time in order to top at the same time as the currencies. So, while the ending diagonal looks like it’s going to break, a contracting triangle appears to be the ideal solution.
Contracting triangles move sideways and burn up a lot of time with their up and down five waves. They end up with a final wave to a new high. The final wave up is typically the same length as the widest part of the triangle, but not always. So, while we can’t count on it, it’s a good guideline.
Once we have the contracting triangle confirmed (with a larger drop in a C wave), there’ll be some high probability trades that set up. But we need confirmation first.
We had a little Santa pre-rally leading up to Friday, but during most of the day Friday, currency pairs and the US indices started to trend down. I expect that to continue through this week.
As I wrote last week, it’s the dollar that will have the last word on the top, but they’ll all join the parade to a final top (each perhaps in its own way. A little more patience is warranted.
The Varying Options in the US Indices
I took at look at all the major US indices this weekend and am showing my preferred count here for all of them. Most of the wave patterns leading up to the triangle are really hard to decipher, so it’s making my job that much more difficult, as we’re still very early in the projected triangle pattern. Volume is extremely low and that can cause waves to be a bit misshapen.
We need a few more days for the market to confirm what it’s doing, but in the meantime, I’m providing as much info as I can on each of them. They may all end up with contracting triangles, but at the moment, it’s just a little too early to tell.
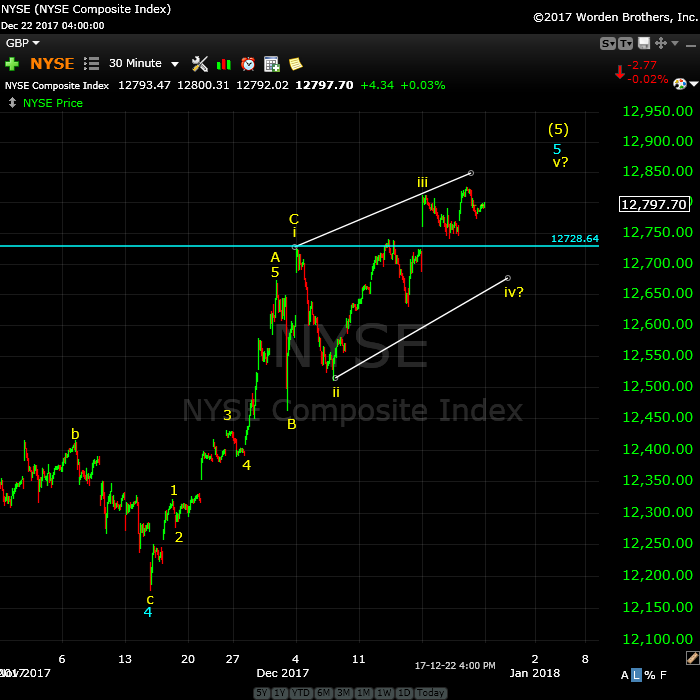 On the left is the 30 minute chart of NYSE. (click to enlarge the chart) This is the largest exchange in the world, and is mother to the DOW, SP500, e-mini futures, and the Russell smaller cap indices. It’s where I go for a clearer pictures of what’s going on “under the hood.” On the left is the 30 minute chart of NYSE. (click to enlarge the chart) This is the largest exchange in the world, and is mother to the DOW, SP500, e-mini futures, and the Russell smaller cap indices. It’s where I go for a clearer pictures of what’s going on “under the hood.”
This final pattern looks like an ending diagonal. In fact, it’s the only index that looks more probable for this pattern than all the others I’m highlighting here. Many of the other indices look weaker and may revert to a contracting triangle. Triangles move sideways, while ending diagonals in a bull market move diagonally up. The ultimate outcome is the same—an eventual new and final high. If a triangle, the current wave will drop lower than for a diagonal. This next wave down will determine the overall pattern, based upon where it finally lands. |
 On the left is the one hour chart of the SP500. On the left is the one hour chart of the SP500.
I’ve been concerned all this past week about the ability of this index to trace out an ending diagonal because of the slope of the third wave. In an ending diagonal pattern the fourth wave must overlap with the first wave and do it in a way that allows the upper and lower trendlines to converge. Because the fourth wave has not descended quickly, it now seems high improbable that an overlap scenario is possible without the trendlines diverging. Therefore, I’ve labelled the pattern as a contracting triangle for the time being. This means we’re to expect a much deeper C wave than previously projected. It should descend to the lower trendline before a turn up in a D wave. |
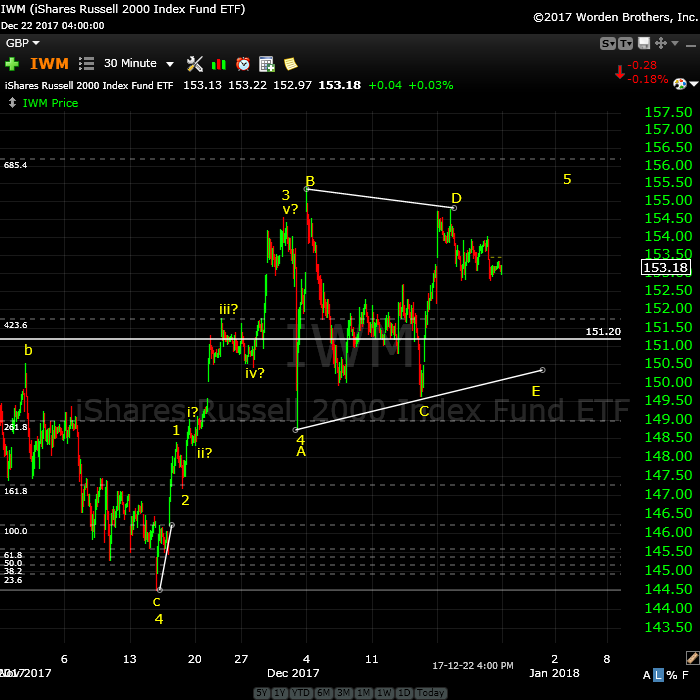 On the left is the 30 minute chart of the Russell 2000 (ETF: IWM). This chart is much more advanced than its sister charts in a contracting triangle pattern, having seemingly completed an ABC wave. On the left is the 30 minute chart of the Russell 2000 (ETF: IWM). This chart is much more advanced than its sister charts in a contracting triangle pattern, having seemingly completed an ABC wave.
There are options with triangles in terms of stretching the time to allow all the related indices to reach a top together. It can widen out for example, creating a more complicated C wave, with a deeper drop to a slightly lower low beneath the current C wave. However, it cannot descend lower than wave 4. We’re early in all these patterns, but this week should provide more information to which pattern is the operative one. |
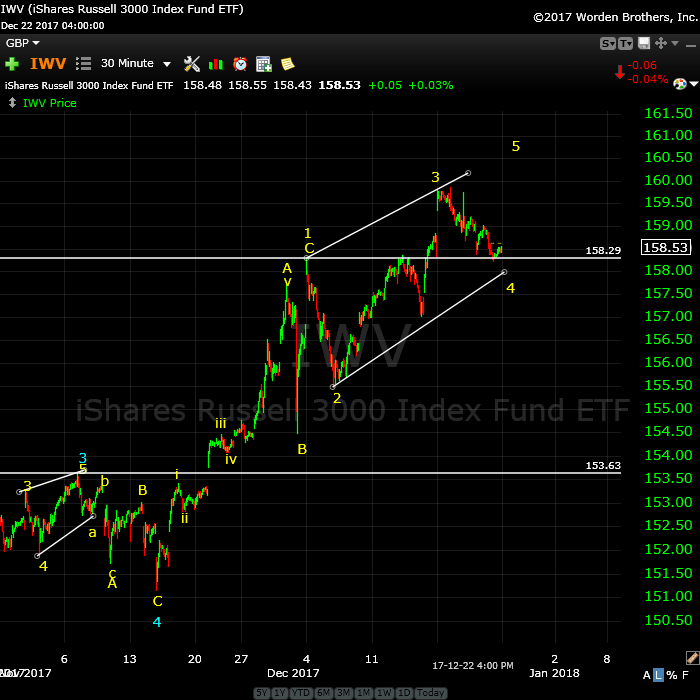 On the left is the 30 minute chart of the Russell 3000 (ETF: IWV). On the left is the 30 minute chart of the Russell 3000 (ETF: IWV).
This index is much more advanced in the ending diagonal pattern. However, that doesn’t mean it can’t morph into a contracting triangle, which would considerably stretch out time-wise the eventual final wave to a new high. All the US indices are slightly different in their current position. However, we do know that for the most part, we have a final triangle forming. Triangles in a fourth wave position forecast one final small wave to a new high, just like an ending diagonal does. So, for the eventual outcome, it’s the same. It only affects trading, if you decide you’re going to try to trade the pattern. |
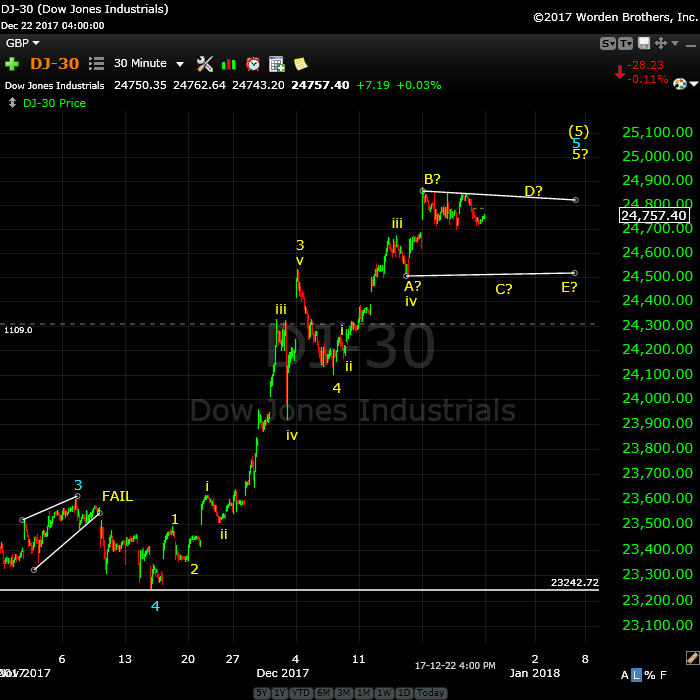 On the left is the 30 minute chart of the DOW. The most recent wave up has risen too far for an ending diagonal to form properly, and wave B in the chart does not look corrective at the moment. So, although I’m showing a possible triangle, it’s more likely from the current configuration that we’re going to see a fourth wave unfold and then a fifth wave up to a final high. On the left is the 30 minute chart of the DOW. The most recent wave up has risen too far for an ending diagonal to form properly, and wave B in the chart does not look corrective at the moment. So, although I’m showing a possible triangle, it’s more likely from the current configuration that we’re going to see a fourth wave unfold and then a fifth wave up to a final high.
I’m on the fence, but we’ll find out once we see what this next wave down lands. It’s still quite early in the pattern. |
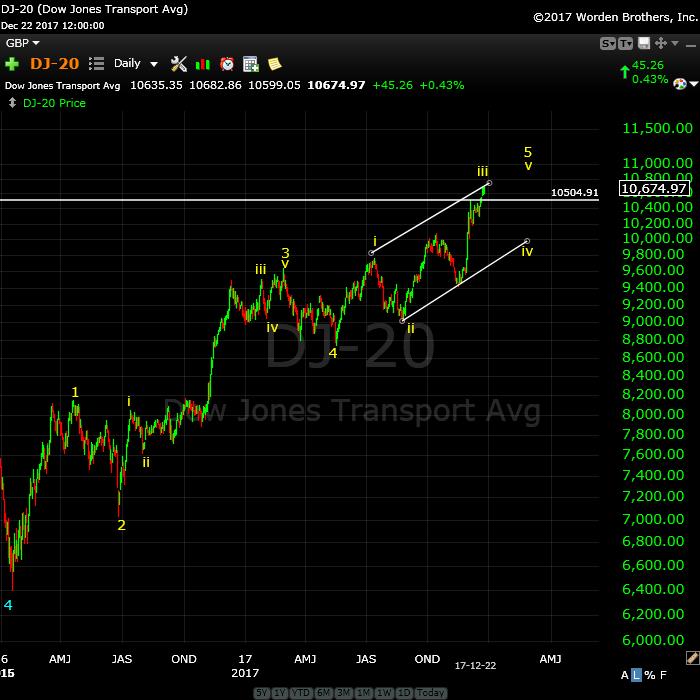 On the left is the daily chart of the DOW Transports. This chart is marked as an ending diagonal. However, the trendlines at the top and bottom are almost parallel, so it wouldn’t surprise me to see this morph into a contracting triangle. That would mean wave iii would become the B wave, while wave 4 would take on the role of the A wave as well as wave 4. On the left is the daily chart of the DOW Transports. This chart is marked as an ending diagonal. However, the trendlines at the top and bottom are almost parallel, so it wouldn’t surprise me to see this morph into a contracting triangle. That would mean wave iii would become the B wave, while wave 4 would take on the role of the A wave as well as wave 4.
It looks like after showing considerable early weakness well ahead of the DOW, this index has regained its strength and is about to top with the rest of the US indices. |
____________________
Problem receiving blog comment emails? Try whitelisting the address. More info.
______________________________
the real deal SM 2
The real deal …‘Educational, insightful and thorough market analysis for all levels of traders. It’s Elliott Wave at its best….Peter Temple is the real deal’ —SM |
Get an upper hand … JC 2
Get an upper hand in trading …Seeing all the different currency pairs and the wave structures and hearing you explain why this has to do that on a nightly bases gives one a upper hand when trading. Elliott Wave applies to all stock and indices and can be applied to any candlestick chart. If someone ask what you want for Christmas – Tell them a membership to Peter’s “Traders Gold!”—JC |
Tops in your field DZ 2
Tops in your field …You are tops in your field. Tried to follow Elliot Wave international for years. They were always behind the market. After discovering you, I perceive that you are an expert in reading the waves, which puts you way ahead of the rest of your peers. And you can read the Waves like you are reading tomorrow’s financial section. I pray you stay healthy. —DZ |
Have not had a losing week RW 2
Have not had a losing week …I have been with Peter almost a year. The only thing that matters is have I made money with his service. I think I have finally turned the corner using Peter’s EW. I have not had a losing week in the last 5 months. Thanks Peter, for your amazing amount of hard work. —RW |
A true expert in Elliott Wave FL 2
A true expert in Elliott Wave …You are a true expert in EW analysis. What you provide is not available anywhere and is priceless. Subscription on your services is the best thing I have ever done. Many thanks for your effort to make me a better investor. I now have more trust in my investment decisions. I hope you will continue the excellent work! —FL |
Rise above the rest … SM 2
Rise above the rest …I have only ever met a few people who, in their chosen fields (astrology, medicine, music, martial arts, technical analysis), rise above all the rest and you are one of them…you have ‘the gift’…and that’s why I’m a Trader’s Gold member. —SM |
The best of them JL 2
The best of them …Last couple of years, I subscribed to several ‘market traders’. You are by far the best of them and the personal contact is awesome. Daily and daily updates are very well written! Besides your expertise in EW, I also like your cycles analysis. Best investment I ever made! —JL |
Couldn’t be happier … KK 2
Couldn’t be happier …The analysis and insight you provide is simply amazing! I’ve been trading the futures and equity markets for well over thirty years and usually average around 5% monthly. Since joining your Traders Gold Service two months ago, that number has better than doubled. I couldn’t be happier.—KK |
The Market This Week
Here's the latest daily chart of ES (emini futures)
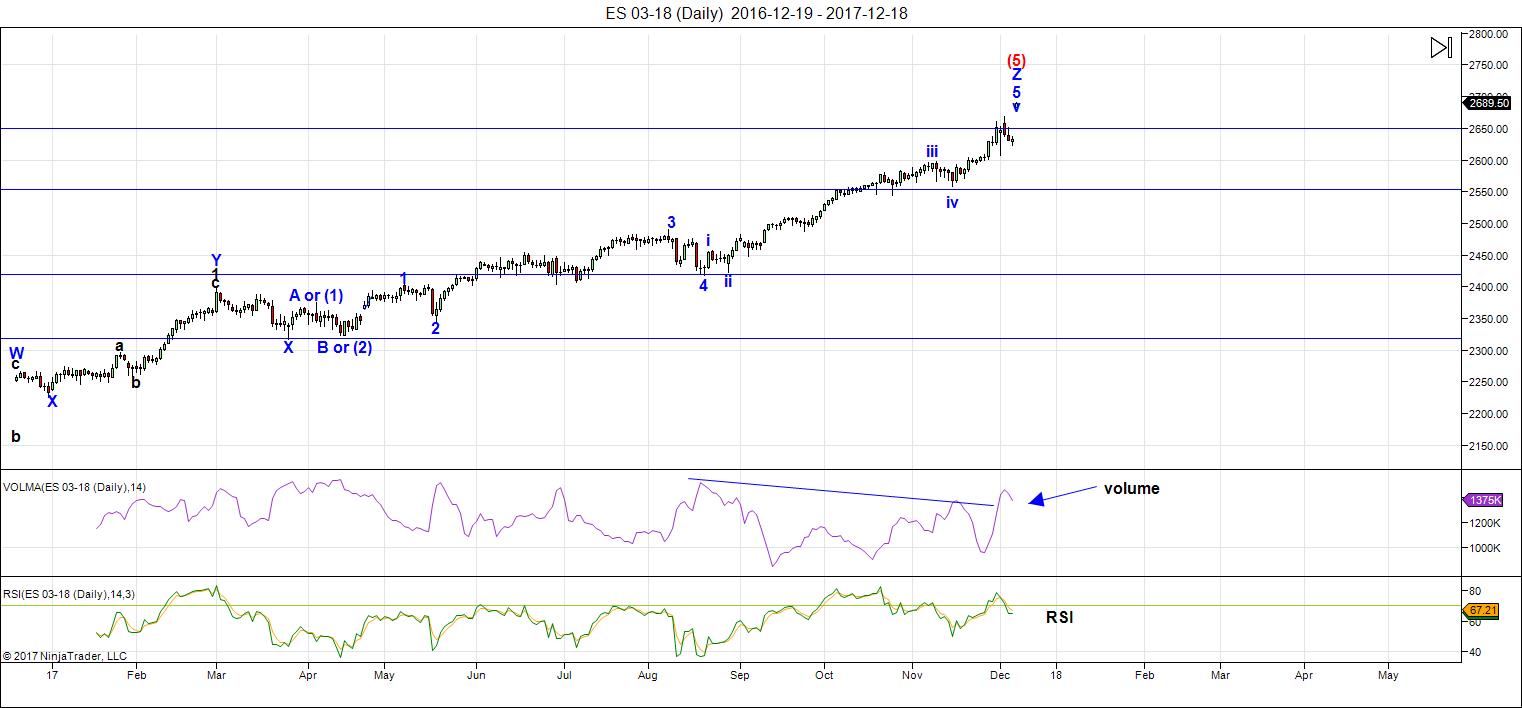
Above is the daily chart of ES (click to enlarge, as with any of my charts).
There have been no material changes to my prognosis. We are at the high. I expect this final wave to breach the previous high for the final time.
However, my previous expectation of an ending diagonal is changing. It looks like we're morphing into a contracting triangle. More on that below.
Volume: I'm seeing volume rise when the market comes down and subside as it rises. This, of course, is a very bearish warning.
Summary: The count is full for the US market in general, except for small subwaves that form the balance of a motive set of waves in SPX and some other major US indices. I'm leaning towards a contracting triangle as the final pattern, rather than an ending triangle.
_______________________
Here's the latest 60 MIN chart of ES (emini futures):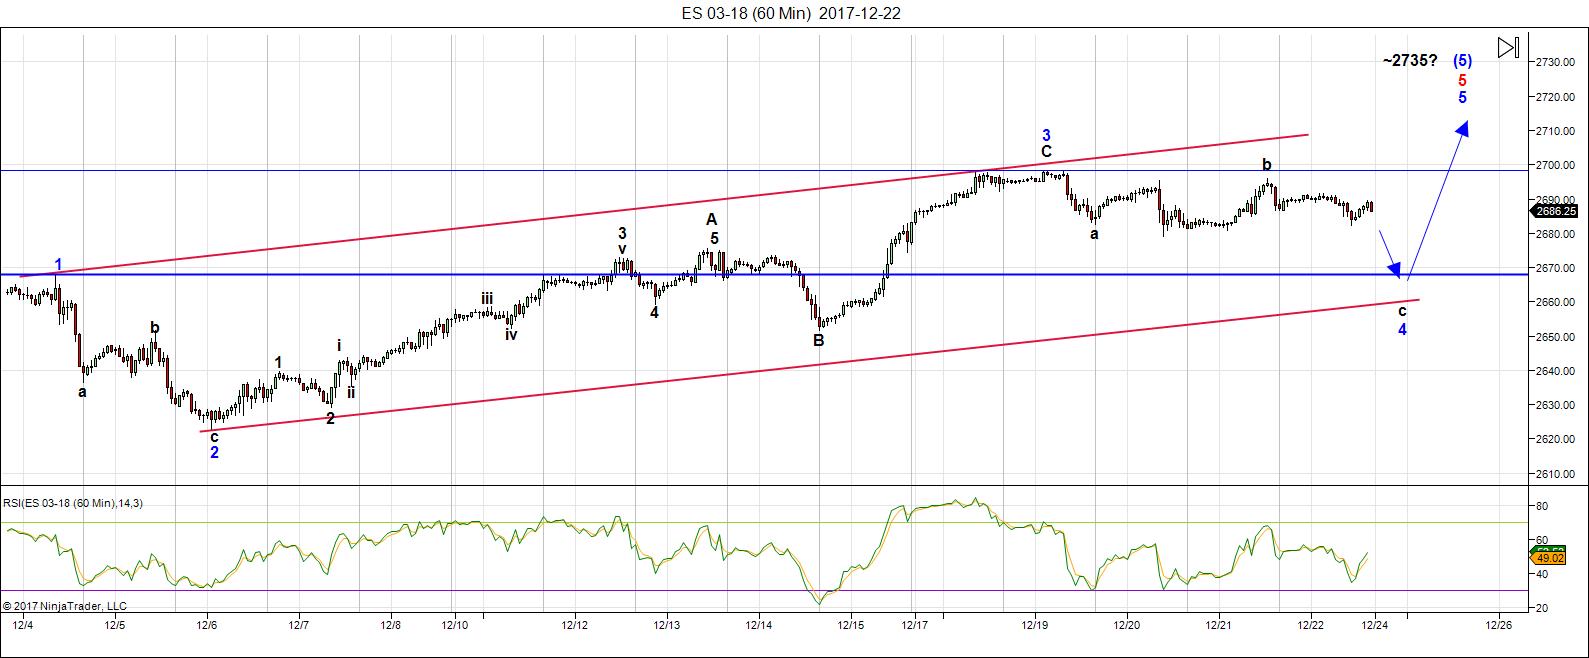
Above is the 60 minute chart of ES (click to enlarge). Please watch the video to get the full story on what's happening short term.
Last weekend, we knew we were dealing with a triangle of some type. Last weekend, it looked like a contracting triangle was not an option. However, with the wave structure now more advanced, there are compounding reasons to believe we're going to trace out a contracting triangle (not the original one, but one at a slightly higher price level) after all.
I've kept the labels for ES as an ending diagonal, but I believe this week, we're going to see it break for the following reasons:
- Currencies (including the US Dollar itself) have one more large wave to trace out after bottoming in the current fourth wave. This suggests that the US indices are going to take more time (not a significant rise in price) to trace out a final pattern that would allow everything to top more or less at the same time (which is what I've been calling for, for well over a year).
- Currency pairs still have to bottom in their fourth waves, which is still a significant drop from where they are, which suggests a larger drop in ES than to the 2650 area (of an ending diagonal).
- The drop in the fourth wave is so far very slow, and as time progresses, there is much less chance that it will hit the ending diagonal fourth wave target before the upper and lower trendlines diverge (which would "break" the ending diagonal).
- The SP500 has little chance now of completing an ending diagonal for the reason given in point 3.
At this point, I have to leave it to the market to tell us what the operative pattern is.
Short term: The wave larger count is now virtually complete. We're tracing out a triangle of some sort. I'm leaning now towards a contracting triangle as being the operative pattern; however, we need confirmation from the market.
___________________________
Trader's Gold Subscribers get a comprehensive view of the market, including hourly (and even smaller timeframes, when appropriate) on a daily basis. They also receive updates through the comments area. I provide only the daily timeframe for the free blog, as a "snapshot" of where the market currently trades and the next move on a weekly basis.
______________________________________
Sign up for: The Chart Show
Next Date: Thursday, December 28 at 1:00 pm EST (US market time)

The Chart Show is a one hour webinar in which Peter Temple provides the Elliott Wave analysis in real time for the US market, gold, silver, oil, major USD currency pairs, and more. You won't find a more accurate or comprehensive market prediction anywhere for this price.
Get caught up on the market from an Elliott Wave perspective. You’ll also get Andy Pancholi cycle turn dates for the SP500 for the balance of the current month. There’ll be a Q&A session during and at the end of the webinar and the possibility (depending on time) of taking requests.
All registrants will receive the video playback of the webinar, so even if you miss it, you’ll be sent the full video replay within about an hour of its conclusion. For more information and to sign up, click here.


A little Christmas gift for the gang
energy chart for next week
https://ibb.co/cnAVpm
Hi peter
For what its worth I think ill begin watching the oex more closely
the sp 100 index .
ill keep my stop at its all time high which was on dec 18th .
possible triangle formation yes yet my reasons for the dec 18th
high are based on something else .
the move up from the dec 1 low to me is suspect.
not an Elliot wave rule ( this breaks rules ) yet it has an ending look to it .
that said using the dow Nasdaq 100 and es futures added together
the market peaked early morning dec 19th and so far is either
a series of 1’s and 2’s ( which I doubt ) or an A B C X ( the x wave being dec 21 )
bottom line what ever this corrective wave is , it does not seem complete .
Fridays low being a higher low its to early to call it .
Utilities look to have further downside coming yet can be in a minor 4th wave .
Honestly though the dow looks very stretched more like a 3rd wave extension than a final 5th . If so my timing model is out of sync with the dow and stock index’s .
Your triangle prognosis does indeed make sense .
To me though if your correct we are in wave B Upwards based solely
on the futures market in which I have the ES+NQ+YM added together .
Bottom line: I have no solid wave count to go with so unless I see
a negative market when the regular session opens ill look to exit
my short position
My vibrational timing projects the low 8/20/23. The nice thing about vibrations is that they show up everywhere. But this shouldn’t surprise us as vibrations are the source. Everything else is a vibrational expression, I see a low 2/22. And on that date mars is parallel Saturn. Confirmation? Not in my world. Just the vibration that rules everything. Turns out the 8/20/23 date is conjunct the solar eclipse in 2024. Surprising? No, solar eclipses are vibrational expressions. Everything – including you and me – are vibrational expressions. How is that for a christmas thought?
It really starts to get boring. Everywhere I look I see the same date. Can give you a many examples, but I won’t.
In short; 12/29 will be a high and 1/2/18 a low. Then 1/3 high, 1/4 low and 1/5 a significant high. Then things will speed up a bit into the 1/10 low (1/7 low, 1/8 high).
From 1/10 up the very signifcant 1/15 high. Gave this date last week and have just found more proof.
After the 1/20 low we are up into 2/1 for a 3rd wave down in the first wave. This low will come 2/11. Then test on 2/15 high and down into the very strong 2/22. From there up for a higher level w2 up into 3/27-ish. That will be the spring high and start the leg down into the vibrational 5/2 low. Then up into early june 4 or 5 and then down into 7/10 – ish low. This concludes the fist leg down of some sort of first leg. This all fits into the major cycle that targets august 23.
My best estimate for what comes next would be a high around 2027, a low 2032 and a high again into 2036. But this is just for entertainment, Thought this was appropriate for this time of the year.
So; things are brewing. 1/5, 1/15 and 2/1 are the dates to watch. panic wil rise in steps. Slowly at first as we have years to cover into 2023. On a larger scale 2019 will be much more volatile than 2018. But It all starts in 2018. In january. Are there is no stopping this thing.
For the astro-minded : 7/13 we have HC Jupiter Contra parallel HC Neptune. And 7/12 we have GC mars conjunct Neptune. And this will be 2 weeks before the total lunar eclipse.
Early june we see gc Mars conjunct Jupiter and 6/5 HC Mars contra parallel HC Saturn.
So the planets confirm two major period for change. But as stated above; for me this is not a real confimation, Just the vibration going wild.
Cheers and merry christmas to all.
I agree with Tom
And it stays that way for…….at least half of January or longer
after reviewing today’s daily energy chart
the weekly chart may be inverted this week
the inverted chart agrees with Andres 12/29 high
i’ve attached a revised energy chart below
https://ibb.co/b9Lv76
Hi Willem, are you still a member of Dirk?
not sure why this happened yet i went to get on here
and i see if i post this as is and i wont i would be posting
under Mike D. shows his gmail as well .
this may be painful for me today to hold short yet from what i am
looking at and its only 1 indicator , this market is on the verge of
giving a sell signal . Timing says look higher and several indicators
are mixed , nothing oversold . ill let the market open and swing around
before making any decisions on direction .
Staying short at the moment .
Joe we are clearly in a triangle. It was entered in an uptrend and probably a fourth wave, which means the break-out will be to the upside. You will have to endure a bit more pain I am afraid, but the last move up should be terminal. 🙂
Joe,
That’s me. I recently contacted Peter for the first time, but didn’t post. Hope that didn’t put things in limbo. FWIW, holding my recent short with RSI2 and CCI cooperating and MACD positive on sub-day charts. Some blow-off probably still left until first-of-year profit taking. Cheers! Mike D
verne
I cant say we are definitely in a triangle
The Nasdaq 100 and oex ( sp 100 ) only show
a simple A B C decline . the NYA made a new high today ?
Timing wise I can allow for a new high yet when looking around
the market including individual stocks, and crypto currencies etc…
My overall view is that we have a down year next year yet I’m
not nearly as bearish as others .
A wave decline would not bother me or change my view .( next year )
the utilities though, in my opinion have the greatest potential
to the downside .
something I watch for is an 8 year and 15 year low to high movement .
2002 and 2009 did fit for a 2017 high yet the next one would be
from 2016 low and 2009 low which is 2024 . that is a long ways away .
benner business cycle calls for a 2018 high and a 2021 low .
mars Uranus calls for a high dec 1 and a jan 2019 low followed by
a dec feb 2021 low so I have doubts of an extension into 2024.
My Guess is stocks get held into year end for tax purposes only
which would help explain this present weakness
to add to this ill just say that a failed bullish triangle ( a break downward )
would be extremely bearish .
There is a problem with the wave count in my point of view which
changes my view .
Back in late 2014 I was expecting a complex 4th wave which would lead to a final 5th . this move from the 2015 lows as well as the 2016 lows has now gone to far
in my opinion to be considered a 5th wave . this implies to me that the entire
move up from the 2009 lows are either a B wave because it has only 3 waves
( agrees with peter ) or ………. we are in a massive 3rd wave which targets much much higher prices ( despite my cycles work ) .
The utilities on a monthly multi year chart should be watched as well as the transports .
I have mentioned that I see many similarities today with the 1999- 2000 top from a cycles point of view the difference I see is bitcoin vs nasdaq 100 .
Not going to turn a blind eye to the actual market swings I’m just pointing out
what I ” think and see” at the moment .
A few weeks ago a girl friend of mine told me the younger crowed she works with
was buying into the crypto currencies and she asked me what I thought .
The late crowed to the party appears to be the young crowed .
Call it animal spirits , call it a bubble , call it a blow off or what ever .
I just think the risks out way the rewards right now in the stock market as well as
the crypto currencies.
Unless the market proves me wrong ( I don’t want to see any new highs in the index’s after march 17th 2018 ) I have a bearish bias into april 2018 and longer term into January 2019 . after that ill change my view based on the data .
Sticking to my longer term 1 year thinking until proven wrong .
that’s it .
good luck everyone.
I certainly could be mistaken, but there are not too many patterns that I trade with high confidence, and triangles happen to be one of them. Based on my expectation that the sideways movement of the last several days is a triangle continuation pattern of some kind entered in an uptrend in ES, I expect an upside break-out with a target of 2730. I remain long the market via SPY 267 strike calls and plan to exit with a break of 2700.00 to the upside. The last thirty or so points I will use to get positioned for an anticipated reversal.
Best of luck in the new year to all!
Nice
Looks like the USD is getting ready to rip higher and the Yen is looking like it wants to drop send USD/JPY higher.
I just took a long position in USD/JPY with my stop @ 112.65
Sold and now looking for a drop to about 112.00
Peter
as i have mentioned before i watch currencies from a distance
yet it is looking like the monthly EC has 1 2 3 4 and a new high
would be 5 waves up .
The us dollar monthly chart DX is the opposite.
Obviously we do not have 5 waves as of yet but the monthly
charts are clean.
Joe:
What’s EC?
also id like to mention the $util index .
I know that this not a clean wave count yet
ill mention it just because .
the daily chart of the utility index $UTIL
Daily chart from the high of nov 15th
to the swing low dec 14 can this be considered a RARE leading diagonal wave 1 ?
to me the answer is Yes . I know its a bit soon to label that yet looking at
a multi year monthly chart to me this index completed a very long term
ending diagonal and so this rather steep turn downwards should be expected.
Obviously there is a much more orthodox wave count which does not break any rules. in which case we would be in a minor wave 4 of wave 3 down still.
Both counts appear valid to me anyways and both are bearish if this continues.
Im finding it very very hard to change my bearish stance and i have been
the bullish guy on here for the past couple years .
verne
looking at the YM 4 hour chart i can see
Abc X A B C Todays high can be D and a break
back below 24762 id consider as point E
and if that actually traces out id look to the side above
this mornings high . The cash dow Daily chart is in a similar
position yet its not as clean .
The ES i have issues with it being a triangle .
Transports need to accelerate lower today to get me excited
ADV DEC line got a bit of a hit of sell side action from the open
yet is still slight positive .
Nothing all that bearish from the looks of it at this point
Something changed to though and ill have to look deeper to see where
value line index $VALUA testing yesterdays lows
Looks to me Joe that we just got done with D as well. The contracting nature of the possible triangle means E should complete soon with an upside break if I am right. A move much below 2680 says I am wrong. I have a trigger finger ready to exit bull put spreads and calls on any upside break.
No more comments from me .
copy and paste from peters site
Just a note is all
The moon is currently in Taurus
The moon is 10 days old
EC is what i show for the euro
Joe,
What does EC stand for or mean?
The Moon will be close to the maximum Perigee with Earth on 1/1/2018. The previous position this close to the Earth was on 14/11/2016.
Don’t count on a swing on the date. Give it 2 weeks. Why? Dunno..
It would probably be helpful to readers if you stated what the relevance of this event was to market price. I took a look at charts on that date specified and was unable to make a connection.
By my count contracting triangle in ES just about done. Either we see a break-out upwards in futures starting quite soon or I got it wrong and something else is developing.
The Moon = gravity and energy. The closer the Moon is the Earth (Perigee), the greater the energy, such as higher king tides.
Humans are comprised mostly of water.
The Moon was at a perigee of 356755 on 26 October 2007. The 2007 top was on 11 October. Not an insignificant date.
The perigee on 1 January 2018 will be at 356566 miles.
Think of Andre’s work.
The link will get you started.
https://lunatictrader.com/moon-cycles-in-the-markets/
Thanks kelsen. Much appreciated.
Kelsey,
Please post more!
“Kelsen”…
https://www.timeanddate.com/astronomy/moon/lunar-perigee-apogee.html
“The point of the orbit closest to Earth is called perigee, while the point farthest from Earth is known as apogee.”
“The Moon passes through the 2 extreme points–or apsides–perigee and apogee about once a month. The time it takes for the Moon to travel from perigee to perigee, is called the anomalistic month, and takes around 27.55455 days.”
“The Supermoon on November 14, 2016, was the closest a Full Moon has been to Earth since January 26, 1948. The next time a Full Moon is even closer to Earth will be on November 25, 2034…”
Moon Distances for New York in 2018
https://www.timeanddate.com/astronomy/moon/distance.html?year=2018&n=179
Moon Distances for New York in 2007
https://www.timeanddate.com/astronomy/moon/distance.html?year=2007&n=179
now that we all have access to the data, please tell us in plain and simple terms why
the “The perigee on 1 January 2018 will be at 356566 miles” is significant.
Actually he already did. The theory is the proximity of the moon has a salutory effect on markets and market highs tend to occur at perigee.
“market highs tend to occur at perigee”
“The Moon was at a perigee…on 26 October 2007. The 2007 top was on 11 October”
“please tell us…why the “The perigee on 1 January 2018…” is significant.”
For most traders, a roughly two week window is entirely acceptable….unless of course you are in mood to quibble.
He posted what he did in direct repsonse to a query from me I would politely remind others in a critical mood….
“The previous position this close to the Earth was on 14/11/2016”
another time, another board, another poster, led the unsuspecting down the perigee rabbit hole…do you think they found anything of genuine value? do you think this time is different?
Looks to me like we are done. I am out.
verne,
‘humility, love and kindness’………. is your credo……….and this credo is all important…………. for the journey forward
https://invst.ly/67mj5
Indeed luri, my friend, indeed!
I’m “in.”
🙂
We might just be looking at a top here. I would have to count ES complete. The question is what happens with the other indices, which are not at new highs. So we might not quite be done.
so peter,
question……. i have observed that when the wild grazing herds …….”senses” ……….danger, …… initially they gather [herd],,,,and the entire herd becomes one unit, and it ” turns . They continue this “turning” in unison – right up until the initial “strike” from a predator……………. at this point, the herd will split, into much smaller herds, and every smaller group………….seemingly turns ……..every which way……………perfect confusion……………………………
so in our indexes, they have been turning in unison…….., and making new highs in unison…………..just like the grazing herd – well, until the very last moment???? is it reasonable to expect that at the moment of “strike”, that the indexes will “mimic” nature???
https://invst.ly/67ogp ES
I had a contingent order to exit my long positions at SPX 2700. When I saw that brutal ES reversal at around 2698.00 I ran for dear life…and I thought I was being conservative witha 2700 exit! They must have heard me….! 🙂
verne,
the “key” is ……..thick wool socks!!!!…………………they won’t hear your coming if you wear ……………..thick wool socks!!! ……………..trust me………..!
Running…er…tip-toeing, out to procure a few pairs as we speak! 🙂
Ed
EC is the symbol for the Euro which has been moving the exact opposite
as the us dollar index .
The utilities ( $UTIL ) to me is still in a developing 5 wave decline .
the top was on nov 15th and the wave 2 top was Dec 1st .
minor wave iv is satisfied at a minimum today yet the resistance
of importance sits in the range of 733-737 ( 10-14 pts higher )
as long as this index stays below 737 ill consider the wave count as valid.
so far i see ( 1 ) ( 2 ) and waves I II III and we are in wave IV of ( 3 ) down.
Transports only show 3 waves down over the past few days and today’s
rally failed to take out the dec 27th high . this places today’s high as key .
Taking out todays highs leaves the door open to new highs in the transports
( $ TRAN ) .
Nasdaq 100 from a bearish point of view .
The drop from dec 18th into dec 26th was an A B C decline which can be labeled as wave ( A ) . the bounce into yesterdays high would be wave ( B ) this places
yesterdays high as KEY. the drop today would therefor be a minor wave 1 of
wave C .
OEX SPX DOW
Nothing to go on , no triangle formation that i see which is valid .
alternate counts both bullish and bearish yet nothing solid.
Dollar index : a 5th wave down on a monthly chart appears to be most likely .
$RUT: peaked on dec 4th inline with the mars Uranus cycle and is in a corrective
wave of some sort . the mini crash cycle ( which failed overall ) ends on tuesday jan 2, The mars uranus cycle calls for a high jan 2 . This jan 2 cycle im at odds with. Venus conjuncts the sun on jan 9th and we begin a flawed puetz window
in the time frame of jan 9-18th . where the market sits in mid January will be important for me in regards to the bull bear debate .
Lastly : the gold silver ratio in my opinion has still not hit its target.
this leaves me at odds with the gold stocks which im itching to buy .
If the us dollar is in a 5th wave down then this rally in the gold stocks would most likely be short lived and new lows would follow as the us dollar turned up .
Interest rates have broken out of a multi decade down trend yet the indicators
consider the interest rate index’s over bought ( rates go up as bond prices drop )
it is beginning to look like bond prices may hold up yet longer term i tend to doubt it .
Wheat: the swing low on dec 12th is now the key price time level im watching.
breaking below that dec 12th low id consider as Bearish despite my bullish bias .
Philly Housing Sector index : $HGX
Daily Chart is worth a Look
Avoid Junk bonds like the plague
AAPL :
5 waves down on the daily chart which is plain to see obvious !
GOLD Futures :
Possible Multi year triangle formation unfolding .
Nov 30 2015 and dec 12 2016 lower trend line
July 4 2016 and Sept 11 2017 upper trend line
both are diverging .
regardless of the lower trend line the 1200 level is key
on the continuous chart from a triangle point of view
as is the 2017 high at 1362.40 .
best labels id say calls this rally a B wave up which fails to take out
1362.40 and then a drop to the 1200 level at a minimum .
The rest of this requires market closing numbers .
Not 1 index made a new high today .
the only slight new high was the ES
Well, NYSE did, by my chart.
after 4 pm….the ES………..https://invst.ly/67oz-
Sigh of relief
unofficial sell signal today .
it takes a few for the closes before making it an official
reading .
December 28, 2017
https://worldcyclesinstitute.com/the-final-route-to-the-top/comment-page-1/#comment-25546
the pivot dates for January 2018 cause me to believe that volatility may be returning to the stock market…Happy New Year!
SPX has 2 equal legs down , ( very close anyways )
its a simple A B C decline and not a triangle.
this C wave has a Wave ( 1 ) wave ( 2 ) and wave ( I ) ( II )
followed by waves i ii iii . it maybe turn into a 5 yet its still
a C wave . Its going to get tricky come Tuesday
correction
Wave ( 1 ) ( 2 ) i ii iii
still a C wave
No Sell Signal given which is amazing .
Today’s /es, /nq, /ym action is reminiscent of Aug. 8 action albeit swing high at/near open. Watch VIX & VXN. Both seem to be eyeing upper BB line.
Seems to me we had a decisive fall out of the EW uptrend channel. The bottom trend-line of the triangle I was watching was penetrated, violating the
C wave low by my count. The one final thing that was quite probative for me was the filling of the 2675.81 open gap from the December 15 close. If the fat lady ain’t singing, she sure is clearing her throat, it would seem….!
Have a great week-end everyone, and a fruitful, prosperous, and joyful New Year! 🙂
Peter
I’m not home yet checked a bar chart from Yahoo
On NYA and I’ll stand corrected . Today we did see a new
All-time high. Also it counts as an outside day reversal .
That said I did not get a sell signal on the indicator I was watching
To me this allows for another new high in at least 1 index .
Can be Dow or oex or spx yet I’d prefer it not in the NYA again .
The next cycle high for me is now the mid January time frame .
Tuesday next week is a tough one to call yet I’m going to guess it becomes
A low of sorts and a run back up to possible new highs would be the next
Entry for a bearish trade .
Mid January as a low ??? Unless I’m missing something a mid January low
Would created an inverted puetz window and throw that cycle out of wack
Yet it would not change the bearish implications of the bearish mars Uranus cycle .
I’d prefer they stay in sync yet my preference vs the market is not important .
I’ll post an updated chart of both mars Uranus as well as puetz on Sunday by the latest .
Bottom line : everything would need to come in sync Jan
26-31st which is both , the lunar eclipse ( related to puetz ) and a swing high Jan 26 related to mars Uranus .
That high should be a wave 2 or B wave or just a high of sorts where the melt down would accelerate
Or begin from . It should not be all time highs !
Staying bearish into Tuesday yet I’m not going to ride these swings back up again .
At best I’ll probably end up with a break even since I entered to early .
Joe
Well, Joe,
I don’t think anything has changed since last weekend. I have us (in US indices) in a large 4th wave triangle, which is only starting to play out. I’d give it a couple of months in order for currencies to finish up. We’re waiting for the US dollar, which controls everything and it still have a little ways to go … as I’ve been saying.
Last week I said 12/29 would be a high but that 1/5 would a more significant high.
12/29 was a high and 1/5 will be a high. Expect SNP to touch 2750 1/5/18. This is a vibrational price. If SNP does that we have special time price squaring out. The same system predicts 1738 for august 2023. That would be -55%. This happens to be the same as the 2007/2209 decline. But that is coincidence.
We are now in a cycle down into 1/20. Then we test 2/1 High and down again into 2/22. The 1-5 / 1-15 period marks the start of the bearmarket. 1/10 really the strongest date. Should be a high, but will be inverted. So we see symmetrical highs 1/5/ and 1/15. Don’t think the 1/15 high will be much higher than the 1/5 high,
When we turn we are down into july /august, before we do a significant retrace. I’ll be working on projecting the target for the retrace, probably late 2018. 2019 will be very bearish.
Said it before and will say it again; the vibrational cycle is down into 8/20/2023. As vibrations rule the universe This WILL happen. It is what Gann called cause and effect.
When I throw something out of the window it will go down. This is not a prediction; it is Newton’s law. Cause and effect. Gann knew of Newton. That why he called his own theory the LAW of vibration. It is a law; not a prediction.
It works mechanically. Because everything is the vibration.
1/2 wil be a low. ABC up into very strong 1/5 high. Vibrational dates 1/5, 1/10, 1/15. 1/20 and 2/1. 1/5 and 1/15 likely double top. After 1/15 definately down into july low. 3/26-27 will be spring high and then a 3rd leg down into 5/2.
Best of wishes for 2018 for everybody.
Cheers,
André
Thanks Andre.
An interesting link if one is so inclined to read because of the author.
N S A O f f i c e of Info Security Research & Tech, C r y p t o l o g y D i v i s I o n
http://groups.csail.mit.edu/mac/classes/6.805/articles/money/nsamint/nsamint.htm#2
“In this chapter, we give a high-level description of electronic cash protocols in terms of basic authentication mechanisms. We begin by describing these mechanisms, which are based on public-key cryptography… We then incorporate the payment untraceability feature, and finally the payment anonymity property. The result will be a complete electronic cash protocol…
However, some serious concerns about the ability of an electronic cash system to recover from a security failure have been identified. Concerns about the impact of anonymity on money laundering and tax evasion have also been discussed.”
The paper’s date is interesting too. Reminds me of my recent BTC high comment. https://worldcyclesinstitute.com/a-teetering-top/#comment-25126
6/18/1996 = 6 – 9 – 1 9 9 6.
For the year, yyyy format, the first two numbers, 1 and 9 will remain.
Notice 2 pairs with a‘9-6’combo. For the 2 pairs, turn the 9 upside down to get 6. Now you have 2 pairs of 6. 6+6=12, 6+6=12.
1+2=3, 1+2=3. Now move the 33 to the last yy.
You now have 1933, the year President Paul von Hindenburg appointed Adolf Hitler as Reich Chancellor of Germany. 1933 was also the year the 1929 crash bottomed.
One could also turn the 9 upside down so you get the year 1633 instead of 1933. Tulip mania started 1933. “By 1633, rather than bother with guilders, the Dutch even began using the bulbs as a currency themselves. There are numerous records of land properties being sold for bulbs.” I read an article recently stating people selling their homes in exchange for bitcoins.
Thanks Andre. Absolutely fascinated by your take on the significance of vibrations to market price. It is the very first time I have heard an application of string theory to the markets. If we are in a barrier triangle, the 2750 target is reasonable. Until that brutal ES reversal, I actually had a 2730 target. Strange times!
I must say a low of 1738 six years from now strikes me as being remarkably optimistic. If we are in an EW “b” wave, the next wave down will certainlly take out the 2009 low. The larger context of this debt-driven “recovery” also warrants consideration that we may be witnessing the third and largest bubble inflated by central banks in our lifetime. Bubbles do not correct, they burst. An orderly decline over six years to around 1700 would hardly qualify as a bursting bubble and would in my view, represent a most remarkable, and unprecedented achievement of central banks. Just saying… 🙂
Verne; I just gave you what my systems tells me. God knows what the world will be in 6 years. I just gave a reference point. We’ll see in 6 years.
What struck me was that my system gives the same decline as in 2007; 55%.
I have a strong confidence this price level will give A low; as it is vibrational. Will it be THE low? Who knows.
The fact that 1/5 will be a high is a fact. But 2023? Just give these facts to inspire people and trigger a discussion. Think that is the purpose of this site.
A 1/5 high would align well with completion of a triangle of some sort for the cash indices. I am definitely expecting an initial new year swoon at the open on 1/2 based on the technical indicators on Friday. I frankly would be delighted with one more high. I am not sure how this affects ES as it sure seems to have already made the turn. I guess we will see! Thanks again for the input. I really appreciate your perspective. 🙂
Thanks Andre— Nick …
energy chart for next week
https://ibb.co/ktDDZw
Thank you so much André! Best wishes for 2018 to you as well. Hope you start using Twitter. I followed you from solarcycles.net to this wonderful site, but am concerned that this site’s comment section may be closed soon.
One more thing, actually two, if I may. We all know the current situation with regard to the massive short volatility trade. SVXY made yet another 52 week high on the key reversal price action Friday. Has anyone taken a look at margin debt recently? A bear market “officially” begins after a decline of more than 20%. I am quite confident that the unwind of both those aforementioned situations will be powerfully felt prior to the official arrival of the bear. Another possibility that it seems no one anticipates is that the coming bear could pounce with unprecedented swiftness and ferocity, taking us into bear market price territory in far shorter time than we have been accustomed to. The bubble is the biggest it has ever been….shivers me timbers just thinking about it…O.K, now I’m done…
Liz…….
can you explain this one???………….. SPX 07 – 08 top high was 1576.09.
the current spx high – 2694.97
so the difference between the two highs [2694.97 – 1576.09 = 1118.88]
so we see in the difference it is a clear 111 and 888………………. coincidence? please explain fully – and “liz”……………………..show your work! ………….. :-))
SPX Feb 2017 Close =2363.64
SPX Mar 2017 Close=2362.72
march was a down month
Dow also had a down March.
Despite the hoopla we did not have 12 months of up closes
in 2017 .
1932 + 89 = 2021
1966 + 55 = 2021
1987 + 34 = 2021
2000 + 21 = 2021
2008 + 13 = 2021
the shorter term dont seem to line up
Not finished going through data yet im back to that 1984 cycle low again .
1932 to 1966 was 34 years up
1984 + 34 years is 2017 .
equal distance in time from low to high .
ill need to check actual prices .
41.22 was the close low ( i think )
yet im showing 40.56 as a print low in 1932
and im showing a 1001.11 as the print high in 1966
both need to be check .
1001.11 / 40.56 = 24.662
using that as a multiplayer
the 1984 low at 1078.95 * 24.662 = 26,630.85
if i use the 570.01 low i get 14068.98 which is
fairly close to the 2007 high.
Using Round numbers on SPX
the spx took off from the 1800 level ( 1+ 8 = 9 )
it has now rallied almost 900 Points to test
the 2700 level ( 2+7 = 9 ) not something i would trade on
or get excited about yet i find it interesting is all .
Also ill mention that the move from 1800 to 2700
is almost a 50 % move .
The SPX is now up 2028.16 Points from its 2009 print low
to its 2017 Print high . a multiple of 3.04
if this was to be a pi multiple of 3.14 then 666.78 * 3.14 would
consider a move of 2093.6892 pts up from the 2009 low
at 2760.46 . Not saying its going to happen just thinking
how will the market react if it gets hit .
added just for fun :
dow high 2+4+8+7+6 = 27 which of course = 9
i would not make trading decisions off of that .
Computer problems so took a break.
ill get something decent finished up tomorrow.
I still find it hard to change my bearish bias
from what i have looked at earlier today .
we are close if not topped by my work
I have seen a few counts that says we’re done. No truncation in ES but there would be in SPX. That thrust out of what I had as a triangle was a textbook (IMHO) completion of a final move up with a classic quick reversal; impressive to say the least. It behaved exactly as I would have expected from a completed ED.
Tuesday’s action is going to be a great import. I expect we will get a heads up from the futures action Monday evening….
from the march low to a dec high we rallied 9 months
again i would not trade based on that
an issue i have with bitcoins:
Transactions cannot be hidden number 1
so you are not anonymous.
Credit card transactions are given to the irs .
don’t think the bank doesn’t know where that money was sent to .
some people may not keep any records of their transactions for
tax purposes and find themselves being audited and end up owing
taxes . Your money is not as safe in the block chain as some may have you believe. not saying you cant make money from it just saying its not
all what some claim it to be .
To add to this ill just say
if you buy a new car and it has problems you can get it fixed under the warranty
if it turns out to be really bad there is recalls and class action law suits .
this applies to most products
the exception ? Computers
we all have heard that well you know its a glitch etc…
so were going to store our money online ????
yes a cashless system is our future yet the infrastructure has not yet
been built .
there are still hacks going on with bitcoin as well as the other crypto currencies
we just don’t hear about them.
your money is not insured etc…..
think of the crypto’s as a Pump and Dump and if you put any money in
take your principal out as fast as possible .
Nasdaq 100 in the late 1990’s on steroids .
we are going to change the world etc… all over again .
Boom then Bust with the crypto and the Gov steps in to keep us ” Safe ”
Enjoy the ride if you choose but it ends badly .
The block chain is also part of AI yet in order to build it they created
a profit motive and they have many letting their computers be part of
the process.
Bottom line: Its not what it appears.
Ill focus on the markets and leave that AI Block chain and crypto’s out of my posts .
According to Martin Armstrong no peg will ever hold .
This is just something to look into .
I have not thought through it yet I find it interesting
Since it relates to both the US dollar as well as bitcoin
https://seekingalpha.com/article/4129543-bitcoin-one-way-go-true
Just something to research that is not
Yet developed that I know of but is coming .
Google search
Hashgraph
One of many places to research
https://coincodex.com/article/1151/hashgraph-vs-blockchain-is-the-end-of-bitcoin-and-ethereum-near/
The first week of 2018: a lower top on Tuesday. Then a lot of volatility. Because the ADP, PMI, FOMC, oil and the Jobs report on Friday. See https://nl.investing.com/economic-calendar/
The most important indicator gives a low on the 4/5th. In fact the whole month is declining till 25th-opening US. Further i cannot calculate it yet.
Willem, could you share what kind of indicators are referring to?
Thanks!
https://www.bloomberg.com/markets/economic-calendar
A new post is live at: https://worldcyclesinstitute.com/new-years-resolution/
This website is for educational purposes relating to Elliott Wave, natural cycles, and the Quantum Revolution (Great Awakening). I welcome questions or comments about any of these subjects. Due to a heavy schedule, I may not have the time to answer questions that relate to my area of expertise.
I reserve the right to remove any comment that is deemed negative, is unhelpful, or off-topic. Such comments may be removed.
Want to comment? You need to be logged in to comment. You can register here.