
Historic High Hopes
The historic levels of optimism this week brought to mind one of Prince’s best-known songs:
 “I was dreamin’ when I wrote this, so sue me if I go too fast
But life is just a party and parties weren’t meant to last
War is all around us, my mind says prepare to fight
So if I gotta die I’m gonna listen to my body tonight
Yeah hey, they say two thousand zero zero party over, oops, out of time
So tonight I’m gonna party like it’s nineteen ninety-nine”
We have levels of optimism this weekend that are at historic levels.
On Friday, the VIX closed at 9.36, which is the second lowest close in history, exceeded only by the close in December, 1993 (9.31).
The Market Vane Bullish Consensus poll of newspaper writers has a five day average reading of 70%. This is the highest reading since June, 2007 (the top of the market before the so called “Great Recession” drop of 2007/8).
Successful traders are contrarians. These are extreme readings, consistent with a major top.They’ll no doubt go higher before this entire rally is done, but these readings are good enough for the top of an historic third wave rally. Look out below.
Looking for a Top
Above is the 60 minute chart of ES (emini SP500 futures) from Friday, July 14, 2017. That weekend, in this blog post, I predicted a top possibly in hours rather than several days. I posted this chart for my Trader’s Gold subscribers with a target of 2466, but cautioned that if the fifth of the fifth went to full length (1.618 X the length of wave i), it would top out at 2476. I was a little off on my timing, as we didn’t actually reach the high of 2476 until this past Thursday. But we turned back down at exactly 2476 and have not gone to a new high.
I had also predicted a new high of at least 5910 for NQ (Nasdaq emini futures) and that it was the one to watch, because it would signal the top of the wave in ES, as well. We’ve reached a new high in NQ. In fact, all major US indices have now reached a new high, which was a requirement for a top. It isn’t a signal for a new top, but a new top is required to “zero out” the jumble of waves near the top and allow the indices to start with a clean slate. A clear set of 5 waves down is a requirement for a continuing large correction (unless it’s a triangle that’s forming).
I had also cautioned my subscribers that the triangle shown near the bottom of the chart (red circle) may turn out to be a first wave instead of a triangle and that this might end up giving us an additional fourth/fifth wave combination to a new high. That caution had additional weight due to the fact that NQ also had an attempt at a triangle at the same position, but it was incomplete. Therefore the structure of the final waves up in NQ and ES didn’t match. This is why it’s SO IMPORTANT to look at multiple indices because more often than not, any inconsistencies will give a clue as to what the market is actually doing underneath all the noise.
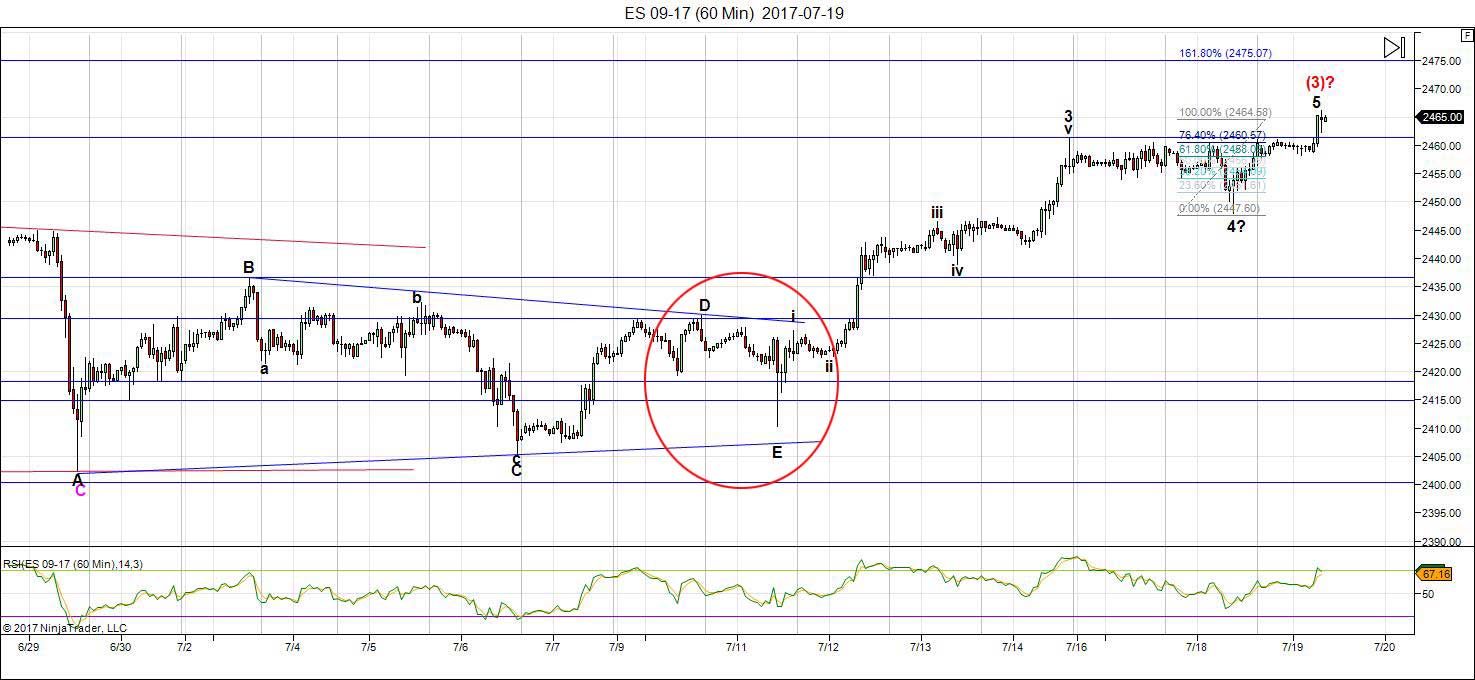
Here’s the same chart that was part of the Chart Show on Wednesday, July 19 when it was obvious that we were going to a high of 2467.
However, in the aftermath of that top, it’s also become obvious that the triangle is a fake-out (red circle). It’s indeed part of a 1-2, 1-2 combination. That means we have one more fourth wave to go this weekend (possibly a bottom Monday morning) leading to a new high this coming week. That will end the extraordinary run of the higher degree third wave up (shown on the daily chart below).
So, while my timing might have been off, the wave structure is warning of an impending top, along with market sentiment, which is at extremes.
Trade what you see, not what you think.
All the Same Market
I’ve been mentioning for months now that the entire market is moving as one entity, the “all the same market” scenario, a phrase that Robert Prechter coined many years ago, when he projected the upcoming crash (although he and his group don’t seem to be paying much attention to it now …).
We’re starting to deleverage the enormous debt around the world. Central banks are losing the control they had and we’re slowly sinking into deflation world-wide, with Europe in the lead.
The US dollar is fully in charge of both the equities and currencies markets. They’re all moving in tandem, as I’ve been saying since September of 2015. For a short while, currencies were moving contra to the US market, but for the past several months or so, they’ve been moving together. The EURUSD is very closely aligned and will likely trace out a fourth wave as the SPX traces out one, too.
A large corrective move is on deck and will affect the US indices and the US dollar at the same time.
______________________________
the real deal SM 2
The real deal …‘Educational, insightful and thorough market analysis for all levels of traders. It’s Elliott Wave at its best….Peter Temple is the real deal’ —SM |
Tops in your field DZ 2
Tops in your field …You are tops in your field. Tried to follow Elliot Wave international for years. They were always behind the market. After discovering you, I perceive that you are an expert in reading the waves, which puts you way ahead of the rest of your peers. And you can read the Waves like you are reading tomorrow’s financial section. I pray you stay healthy. —DZ |
Have not had a losing week RW 2
Have not had a losing week …I have been with Peter almost a year. The only thing that matters is have I made money with his service. I think I have finally turned the corner using Peter’s EW. I have not had a losing week in the last 5 months. Thanks Peter, for your amazing amount of hard work. —RW |
A true expert in Elliott Wave FL 2
A true expert in Elliott Wave …You are a true expert in EW analysis. What you provide is not available anywhere and is priceless. Subscription on your services is the best thing I have ever done. Many thanks for your effort to make me a better investor. I now have more trust in my investment decisions. I hope you will continue the excellent work! —FL |
Couldn’t be happier … KK 2
Couldn’t be happier …The analysis and insight you provide is simply amazing! I’ve been trading the futures and equity markets for well over thirty years and usually average around 5% monthly. Since joining your Traders Gold Service two months ago, that number has better than doubled. I couldn’t be happier.—KK |
The best of them JL 2
The best of them …Last couple of years, I subscribed to several ‘market traders’. You are by far the best of them and the personal contact is awesome. Daily and daily updates are very well written! Besides your expertise in EW, I also like your cycles analysis. Best investment I ever made! —JL |
Rise above the rest … SM 2
Rise above the rest …I have only ever met a few people who, in their chosen fields (astrology, medicine, music, martial arts, technical analysis), rise above all the rest and you are one of them…you have ‘the gift’…and that’s why I’m a Trader’s Gold member. —SM |
Get an upper hand … JC 2
Get an upper hand in trading …Seeing all the different currency pairs and the wave structures and hearing you explain why this has to do that on a nightly bases gives one a upper hand when trading. Elliott Wave applies to all stock and indices and can be applied to any candlestick chart. If someone ask what you want for Christmas – Tell them a membership to Peter’s “Traders Gold!”—JC |
The Market This Week
Here's the latest daily chart of ES (emini futures)
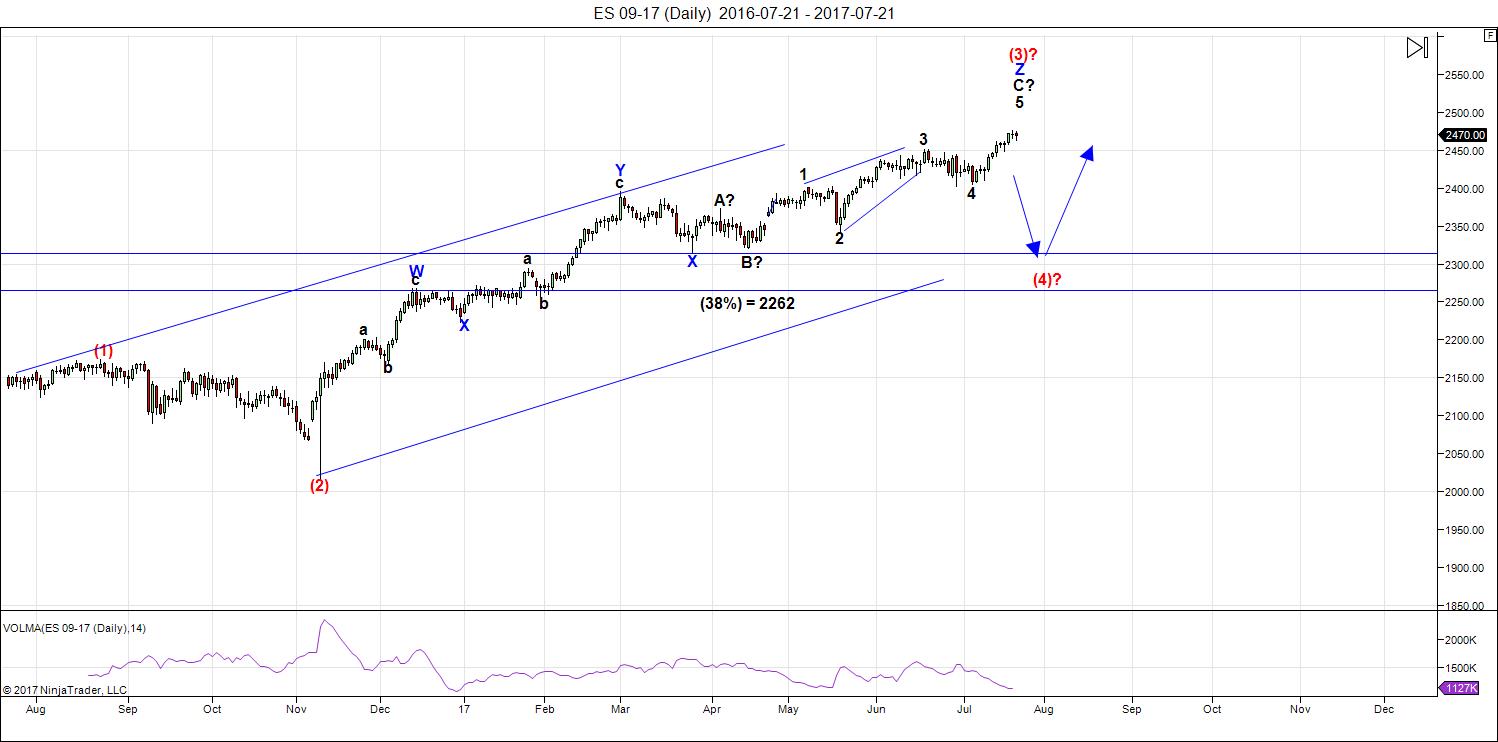
Above is the daily chart of ES (click to enlarge, as with any of my charts). Last week, I predicted a turn down at the beginning of the week at a target of 2475/6 (with a fully extended fifth wave). The turn at that level happened, but it took until later in the week, of course.
However, the market made it very obvious we're not quite done with this third wave. All boats have risen to a new high, but the market has signalled one more wave up ... and this is across most currency pairs and US indices and futures.
The USD currency pairs are still in various stages of topping/bottoming. The currency pairs continue to be near targets, but those targets, for the most part, have changed slightly this weekend. We're near a top, but we still have one more wave to go.
I've labelled the subwaves of the final wave up in the chart above so that you can see the challenge with analysis of a market that keeps telling me it's corrective. There are two many waves in the final wave subwaves and the only way I can make it work at the moment is to consider the first wave up as a wave in 3 subwaves (that's the underlying structure). So that means we have completed a third zigzag, which confirms my overall labelling of the entire move up from February, 2015 as a corrective pattern.
NOTE: There's a Fed meeting this week with an announcement expected at 2pm EST on Wednesday, July 26. This may be a market mover.
Summary: We have one more rally to a new high to go before we drop into the fourth wave.
After completing the larger fourth wave, we'll have one more wave to go, which could be an ending diagonal as a fifth wave. The long awaited bear market is getting closer.
______________________________________
Sign up for: The Chart Show
Wednesday, August 2 at 1:00 pm EST (US market time)

The Chart Show is a one hour webinar in which Peter Temple provides the Elliott Wave analysis in real time for the US market, gold, silver, oil, major USD currency pairs, and more. You won't find a more accurate or comprehensive market prediction anywhere for this price.
Get caught up on the market from an Elliott Wave perspective. You’ll also get Andy Pancholi cycle turn dates for the SP500 for the balance of the current month. There’ll be a Q&A session during and at the end of the webinar and the possibility (depending on time) of taking requests.
All registrants will receive the video playback of the webinar, so even if you miss it, you’ll be sent the full video replay within about an hour of its conclusion. For more information and to sign up, click here.


Peter do you have a estimation how high the market will get in the final wave five? thanks
Last time monthly MACD seen at current extremes – October 1999, October 2007.
By some measures volatility compressed to levels never before witnessed.
I continue to accumulate volatility, now my largest position since I have been trading.
A few long positions remaining which will be exited at the next print above 2477.62
There will be pain…..
am expecting SPX to consolidate around 2448 first few days this week and then try one more rally up to a mini double top 2475-80 August 4th. Then we get a real drop.
Verne, what are good ways to accumulate volatility? vxx calls? SPXS?
VXX calls work OK. I prefer to use bull put spreads while waiting to limit decay loss until we have a confirmed turn at which time I switch to a pure long call position. I am holding VIX calls and looking for an entry on SVXY puts. I will probably buy the October 100 puts on either the ususal inevitable outside day reversal signal or second close back below the BB, whichever comes first. This market is so screwed up we could see the plunge come hard and fast giving even traders expecting it little time to get positioned or making it too expensive to make worthwhile trades. Buying volatility when it is cheap is probably the most counter-intuitive trade to make.
I will probably bite the bullet and take full positions on the next all time high. I think we have another fib target at around 2490.
I don’t believe in coincidences. Prince’s song 1999 was released right before the mega bull market of 1982 to 2000. It also refers to a year right before the last time Jupiter crossed in front of (conjunction) Saturn (which was in June of 2000). Peter’s reference to this song occurs 3 years before the next Jupiter Saturn conjunction which will be October of 2020. Could market rhyme with end of current bull market being on or about the year 2020? Or will market sell off and after the next conjunction set up a bull market in the next decade? Oddly enough the conjunction also line up with Peter’s “lynx abundance” data from a few posts back. Nadirs of abundance were cyclically linked with Jupiter Saturn conjunction cycle. (data from ThePlanetsToday.com)
Valley,
I meant to get back to you on this earlier (reference to Prince’s song), but it’s been a busy week. You cite some fascinating correlations that support some of the same milestones I have, but you’ve linked conjunctions to them, which I’d like to study more. So I’ll save this. Thanks so much for the info!
Great job Peter !
PALS this week:
Phase: weak next two weeks, Distance: weak next two weeks, Declination: strong all week then weak following week, Seasonals: weak next two weeks.
Summary: Next two weeks should see selling, especially the week after this one. Selling most likely to begin after Wednesday’s Fed meeting.
Sounds about right. I am expecting we trace out yet another triangle of some sort today and Tuesday and we get a thrust to a new all time high on Wednesday. My thesis is that the arrogant banksters are of a mind to try and arrest any and all market declines with interventions of outright market purchases, so the next significant decline will take place without their permission. I think the level to watch is 2400, and once we break it, I would not be at all surprised to see a truly organic retrace, which would be the entire Trump “rally”. I now think it will be over in around a few weeks and will be arrested by some sort of FED speak – a halt in interest rate hikes and/or announcement of new QE; and then the final mania to a double top around 2500 or as high as 2920 to then take us into a September to remember…
I think circuit breakers are going to triggered globally and a lot of traders are going to find themselves locked out of accounts. I don’t plan on being one of them.
So how will you avoid the seizure of your assets and closure of your acount? Close it?
Arrange for you broker to sweep your cash into a regular FDIC insured account at the end of each trading day. While you can arrange to have this done periodically if funds not used to trade you can actually instruct them to do it daily. Technically cash in you account should be OK as it is only the brokerage products that are not FDIC insured. The first sign of trouble will be any kind of freeze on access to accounts. That will be you signal to get out of Dodge even if it it happens only temporarily. It is critical to know which bank handles your brokerage balance and have wire instructions already set up in your brokerage account to be able to move funds quickly when you need to do so. Another event that will signal trouble ahead is announcements of increasing corporate bond defaults as a credit crisis will be the catalyst for the next financial meltdown. I suspect the bigger brokerage firms are going to be fine but it would be wise to be prepared.
It used to be my dream to trade a Grand Super Cycle third wave down but I don’t think the system is going to survive the carnage. My plan is to try and catch the first wave down and the retrace, then get the H. E. double toothpicks out of Dodge.
Just a thought on animal spirits ( or lack of )
bitcoin took a big dive and has since bounced.
today it was a penny stock i only watch because of my kid .
ENVV down 60 % today after a big run up .
I notice at times that the more speculative stocks or sectors
will turn and today ( last week ) is showing a change in attitudes.
How that relates to the dow ?? Not sure just an interesting
change of mindset is all . Maybe smart money is leaving the building
and getting out of the more speculative stocks/sectors
Smart money has been leaving the building for quite some time now. Tracking money flow of insiders and institutions leaves no doubt about that. I have been really amused by how the big NASDAQ plunge back on June 9 has been entirely forgotten, just as if it had never happened. Do folk realize the massive amount of capital that represented leaving the index????!!! I mean what bigger a warning red flag could anyone else require. Yet here we are….new ALL TIME HIGHS! The lemmings are out in force and running wild!
Time to party on like there is no tomorrow….”nothing new, under the sun”, a wise man once said…. 🙂
verne
why would corporate bonds default and not gov bonds ?
Governments have printing presses! At least they have printing presses until they get taken away.
Ed is right.
There are a few other things worth considering.
People generally assume that interest rates rise only in inflationary environments. The idea of rising rates in a deflationary or dis-inflationary environment seems inconceivable at first blush. If you think about it though, there is another very powerful reason that would cause rates to rise – FEAR.
People think central banks are in control of interest rates. They are not.
They ultimately must forcibly, if not voluntarily, follow the market if they want to keep selling bonds and aid and abet governments’ engaging in deficit spending. Once bond holders begin to worry about return OF their investment more than return ON their investment, rates will rise, period. Ordinarily, it is not easy to see beforehand the catalyst that could induce fear in bond markets but in this case I think we have a remarkable exception, or exceptions. We know that untold numbers of companies have borrowed hundreds of billions to buy back their own shares at very rich valuations. To service those bonds they will have to continue to post earnings healthy enough to make the necessary interest payments. The amount of borrowed money was predicated on both earnings and market cap, which in turn obviously is linked to share price. In a slowing economy both will fall, making debt service increasingly difficult, and then eventually impossible. Defaults have already begun. There has been a deliberate news blackout on this growing problem.
The biggest and most obvious catalyst I think will be the price of oil.
The frackers and driller/explorers have borrowed like there is no tomorrow.
What is more amazing is that banks have loaned like there is no tomorrow.
The price of oil is going to fall to a level that makes even interest on those loans un-payable, forget about the principal. It is dead money. The only question is how long before the market figures that out.
The lender of last resort have shot their wad and will not be able to vacuum up these trillions of bad debt. In fact they will be unwinding to the tune of around 600 billion per year compounding the problem. This just a very brief summary of what is around the corner. None of this is priced into the current market evaluations. The level of outright insanity that exists in the market right now is going to have people looking back in bewilderment five years from now and asking how was it possible for market participants to be so irredeemably blind and stupid as to the economic realities of the times in which they were living.
I will tell you one thing I have learned-especially as I listen to some comments people throw out about the market- never underestimate the stupidity of your fellow man. More importantly don’t make trading decisions based on your own perception of what is or is not logical. Someone said the market can remain irrational longer that you can remain solvent. However, make no mistake; it is going to ultimately blow up…it always does, and this time it will be nastier than anything seen previously for very obvious reasons. If you are not prepared for this eventuality, that seems to me to be taking the irrational to an extreme beyond the ones convinced this will go on indefinitely, and who are trading as if it will. I remain long volatility. The banksters cannot indefinitely suppress fear.
Governments do not have printing presses. They gave that ability away decades ago. The BIS provides the money and charges interest on it. They’re behind the Federal Reserve, for example. The countries that had printing presses have been destroyed: Syria, Lybia, Iraq, etc. There are only a few countries left that do and they’re vilified, for the most part: Iran, North Korea, and a couple others.
And central banks don’t print money; they print debt. Any money created creates an equal amount of debt and then these banks charge all these countries interest for something the countries could do for themselves interest-free. They’ve all given away their sovereignty. This is what I keep writing about. This is the whole problem with our financial system and the main reason it’s going to collapse.
You can’t create money in our current system without creating debt (loans). You can’t pay back that debt without destroying that money. So, there’s no way out of our current system. It’s been designed by banksters to make them rich, but governments today have no control over their money.
Canada, for example, had a printing press until 1974, when we gave it away to the BIS. The US gave away their press in 1913.
Peter T,
Hasn’t the Fed created trillions of dollars of “zero to low interest rate” money during their QE programs since 2009 low? Not literally printed dollars with paper and ink. They did this because of the dollar’s world reserve currency status…other countries do not enjoy that status. I am interested in your comments.
I use the idea of debt feeling like money…until you have to pay it back.
If we could simply borrow our way to “wealth”…we would all be rich.
Ed,
It has nothing to do with the reserve currency status. Other countries have done the same thing. Canada did, although the government lied about it. We even got partially bailed out by the Fed. The ECB has been creating money like crazy.
But the problem all these countries have is 1) that money is borrowed from the central banks and 2) on a domestic basis, there’s no way to get the money into the economy. The Fed’s transactions are with banks. So they give this digital money to banks (to the bank’s reserves). The bank can lend out money to those who want to borrow it (fractional reserve banking), but that’s where the money for the domestic economy is created. There has to be a demand for loans (which there isn’t at the moment, which is deflationary, but that’s another topic).
People take out loans and that’s new money injected into the economy, but banks also have to deal with the other side of the balance sheet, which is “assets.” They classify these loans as liabilities – the money in the borrower’s account and assets – there’s actually nothing there, but they classify that debt which will eventually be paid back as an asset (which is outright regulated fraud).
Hence a raging stock market and housing bubble. But everyone is broke.
So this digital money goes out into the economy. Once it gets paid back, it comes out of the economy. That’s “major deflationary.”
But it’s the only way to get money into the economy. And when nobody wants loans or the economy is so risky banks don’t want to lend, the money stays with the banks and isn’t created. The banks speculate in the stock market, mortgages, etc. This why all the talk of helicopter money, because there’s no way presently to get it into the hands of the population, except through relaxing taxes.
When people don’t want loans, that’s deflationary. And this is a key reason why the Fed keeps trying to chase 2% inflation (they haven’t been able to). More money is flowing out of the economy than in.
The entire financial system has to change in order get money from the banking cartel into the hands of people, which is why historically, money was created.
About 3% of money is cash (notes and coins) but the Treasury prints this and the banks have to purchase it. They only have to have 30 days worth of digital and real currency on hand to cover monthly needs of depositors. Otherwise, banks are mostly a shell, except for the reserves they keep on hand, which is less than 10% of the debt that’s out there.
It’s a house of cards.
But the bottom line is that nobody is handing out money to the population. Other than loans, there’s no way to get money into the real economy.
It’s more complicated than this. of course. The best books on the subject are Web of Debt (Ellen Brown) and the Creature from Jekyll Island – both on my books list.
One of my past posts on the subject: https://worldcyclesinstitute.com/money-magically-appearing-out-of-thin-air/
Peter I think you are right technically about the printing presses, but I think when people talk about governments “printing” money, what they are really referring to is the ability to deficit spend. At least that is what I am thinking. The central banks will generally do the bidding of the host government in that department, Japan being one incredible example of how far they are willing to go.
Nothing like borrowing your way out of bankruptcy .
State and municipal bonds as well as us treasury bonds have
Way more risk than corporate bonds .
Historically governments default where as corporates have to sell assets to cover debt .
Given the choice I’ll take corporate debt over gov debt any day yet I own none of either
http://www.marketwatch.com/story/detroit-sells-first-municipal-bonds-since-emerging-from-bankruptcy-2015-08-19-141033025
States and municipalities at least have taxing power. In the coming crisis they will cannibalize their tax base until communities die or revolt and force govrnments to shrink. Corporations need earnings to sevice debt and when earnings fall during recessionary times, there is no way to replace the revenue. There is rarely cash and hard assets that can cover outstanding debt. The bonds of a few good companies will get thrown out like the proverbial baby with the bathwater and will offer great opportunities for savvy investors, but they will be the exception.
We are getting a preview of what’s coming in the situation in Puerto Rico and Illinois. Hardly any serious reporting anywhere to be found.
Verne
When you buy a CD or a bond or own any debt instrument
When it matures what happens ?
I think people miss understand what ” unwinding” means
If you own a bond to maturity regardless of what interest rates do
You do not lose money ( not talking about defaults )
If you decide not to roll over your CD the bank just gives you your money
Plus interest on that maturity date .
You didn’t sell it . It matured .
The Fed is not selling bonds , it’s letting them mature .
Now who come in and becomes a buyer for that debt is another story
If the bond issuer goes out of business, maturity dates are meaningless, as you noted, and the bond is worth zero. Somtimes a restructuring allows some recovery, usually pennies on the dollar. So…does anyone think there will be zero defaults in the FED multi-trillion dollar balance sheet?
What about when rising rates erode prices and blow up their capital ratio?!
We are living in fantasy land folk, we just don’t know it, or more precisely, the clueless herd does not.
corporate bonds have some assets behind them
government bonds do not . im not saying bonds are a great investment
or not risky just saying gov bonds have more risk than corporate .
the fed will not loose a dime if rates rise as long as they hold to maturity.
if you read through that Detroit bond issue you will see those bonds are
backed by taxes . in essence the city says it will tax its people to pay for the bonds. the question being , what if the people leave and there is no one to tax ?
or the few people that are there get taxed at a higher rate and then leave which puts more pressure on those who stay .
you could use kmart as a corporate bond issue id be very Leary of .
i don’t know if Kmart has bonds or not yet i get your point .
A GE bond or micro soft bond of google bond or a host of others have assets .
government bonds do not .
as for the shale oil bonds ?? again those bonds are back by an asset which is oil
someone can recoup eventually yet the average guy gets burnt which is the norm .
investors in European bank bonds can lose if the gov decides to save the bank vs
save the bond investors .
i bought Washington state bonds which were revenue bonds tied to the Washington Public Power Supply System (WPPSS), which made the record books with the largest municipal bond default in history.
i got 15 % interest on those bonds back then .
why did i buy them ? Father in law was a good bond guy and did lots of research.
right now though . us treasuries are very risky .
once the fed lets its holdings mature and “unwinds ” as they say .
rates can rise if there is not enough buyers yet that will only bring more money
to the us dollar . its a house of cards no doubt .
the rising dollar puts pressure on exports and the lack of exports hits GDP
etc….
On the other hand who wants to be the buyer of negative interest rate bonds
and has to pay to have their money “invested ” in European gov bonds ?
The real problem we have in the united states is Pensions and debt.
Just a theory im watching on this debt we have in the united states .
who would be the guy who would try to renegotiate it ? who would be the guy
who tells china or all of out debtors that we need to “restructure ” that debt ?
Who has a history of having a best seller at the top of the cycle and is in bankruptcy court at the bottom ?
What collateral do you have if you own a us treasury bond ?
The taxing power of the United States of America.
Thanks peter
I remember you writing about the this before.
verne
look at symbol : HWG
Joe did you mean the junk bond ETF HYG?
I could not find anything for HWG.
HYG is printing a new 52 week high today. The animal spirits are alive and well. 🙂
Pancholi keeps sending me emails offering massive discounts to the market timing report. He must be losing clients hand over fist to be offering such discounts. Maybe the lack of volatility is making the turn dates less useful even if correct as the moves are so small.
http://tinyurl.com/kg4qodo
VIX set to open at new historic low, and it looks as if ES may print another high.
Nasdaq futures suggesting a top is close. VIX bouncing of historic morning lows. We could see a reversal today. If VIX goes green with today’s run-up that could be all she wrote.
to all- I think we should have a contest- since nobody has accurately called the top of wave three- everybody should state their guess on date and high on the S&P- the winner gets the respect of all the readers-thanks
Don’t have exact dates but I have a range: Date – Between today and 01/01/2075, price – between 2480 and 5000
Q- thanks for your prediction
my prediction is the top will be made today in the S&P at 2482 and wave four starts tomorrow.
Verne
Typo , yes I meant HYG
It looks very similar to the Dow or spx
It was leading the stock in des lower into Jan 2016 .
.
Marc
I actually suggested something along the line your thinking of a few months ago.
I wanted to have a questionaire or survey where you put in date and price
And then we could all see the results and see how accurate we are as a group .
Andy pancholi turn date was not a bad turn date . The July 14 th date did turn the market down
I think it is disrespectful to say everyone is wrong about calling the top of this 3 rd wave .
Trading or forecasting is about probabilities and your not always going to be right but
If you understand certain cycles as well as patterns you increase your odds of success .
I agree with Joe. It displays childish petulance to go on a website carping about this or that turn date being wrong. We are talking about probabilities folk. Ultimately the way I look at these things is do I want to risk a 2 or 3 percent gain against a possible 10 per cent loss. When looked at from that perspective, these calls do exactly what they are intended to an in that sense I would refrain from any criticism of Pancholi.
With indices at ATHs, no new longs on my part as I am seeking a low around 8/2 or 8/6 to 8/11.
Full disclosure I did go long a stock a few minutes after open today. It went up $28 after hours yesterday on earnings report then went down $20. Still holding but have a tight stop.
Well folks, for what its worth, one of my own personal signals has fired today and that is divergence with VIX and price. While I am not going to engage in the futility of calling a top, in my experience when VIX puts in a hammer and heads North in the face of of positive equity prices, it is time to sit up and pay attention. I have added my final long volatility positions based on today’s new developments. Best of luck to all!
When will this 3rd wave end? Geesh, this market keeps moving up.
Liz H
there used to be a company named Trendfund which merged with someone else
yet what they did was sell trading ideas .
What the guy discovered was trading earnings ( hence my post to you )
There was a few other things he noticed yet ill go into the earnings trade ideas.
about a week to 10 days before an earnings announcement you go long
the stock ( you are constantly looking up earnings dates for stocks and trading only those that have earnings coming out )
about a week to 10 days prior to the earnings date you go long the stock
or buy call options on it . on the day of the earnings release, typically with in minutes before the release you sell those call options. My thinking on your
trade was that the stock you traded is probably down for the same reasons .
It has been a long time since i have done any trading based on the above yet i am aware that some people still do this .
fed meetings are another one , End of quarter another one because of
fund managers adjusting portfolios ( total bs what they do but they do it ).
essentially as you get closer to the end of quarter , a week or 10 days prior
to the end of the quarter, they sell their losers and buy the winning stocks over the quarter , this makes the losers fall more and the winners rise more.
once the quarter ends they then sell . i consider this bs, yet it looks good on the account statement to make it look like they know what they are doing.
This market looks bipolar to me yet it is still following the pattern i laid out
so sitting back waiting for mid august to get here .
Joe
Hello Joe, it was IRBT. It peaked 4:30 pm yesterday but it faded from 116 to 96. I picked it up at 100 this morning and sold before a short seller appeared on cnbc talking it down. I appreciate the earnings tip. I was about to do it this morning with ulta ready to buy some calls since the chart looked better last night. Glad I held off.
1 2 3 4 1 2 3 4 1 2 3 4
a b c x a b c ???
it just keeps repeating and had i not be following the pattern i am following
id be shorting this market for all its worth
Going to raise my stop next week based on the dow .
will post the weekly and daily overlay of the pattern
Saturday .
Back to work
Verne i m starting to watch HYG more and more yet no
intent of trading it .
Looks like my kid got a good lesson with INVV , His risk was 84 bucks
and he failed to do any research .
Something i read about in regards to cripto currencies.
Just something i discovered when buying parts for my computer build.
It kind of fits with whats going on though .
At some point those buying up graphics cards will have the upgrade
they were looking for , as go cripto currencies ill assume so goes chips and tech to some degree.
Just something to consider and worth the read
http://www.tomshardware.com/news/graphics-cards-prices-mining-cryptocurrency,34879.html
Sentiment warning: http://www.zerohedge.com/news/2017-07-26/investors-intelligence-issues-new-major-warning-stocks
Peter
i was hoping no one would start publishing that.
Now i hope no one actually believes it . 🙂
kind of like the Hindenburg Omen or the end of the world
in 2012 or Donald trump never becoming president.
Just keep buying and buying and saying
But its different this time .
I can dream cant i ?????
Come mid august though if we are seeing new all time highs
ill be positioned short .
In the mean time illl just keep moving up my mental stop
looking for an exit
thanks for the link
above in the blog I predicated the high on the S&P would be yesterday at 2482- did I call the top?
NO! it hit 2483 today. You fell for the classic call the top. You can only call a top in hindsight after 5 waves down and 3 waves up.
“Selling most likely to begin after Wednesday’s Fed meeting.” Marc, quote from my post on Sunday. We both were right it appears. =)
Look at Nasdaq futures now. Seriously. I hope you’re not missing the show. This is both amazing and horrifying at the same time lol.
I was about to post 5988 as the measured move for the C&H on the hourly. 5 minutes ago. Thinking “No Way”. Yes way, it covered like 20 points in 1 minute. After gapping up 12 points.
If this is not the top please call the police. No, seriously.
It’s beautiful–like an eiffel tower. http://www.kimblechartingsolutions.com/wp-content/uploads/2012/05/joefridaysilvereiffelpatternmay111.gif
I have NQ popping into C of ED3 out of today’s completed triangle. Gap up makes sense.
Peter- based on possible wave patterns- what is the maximum wave 3 could climb to? thanks
That info’s in the Chart Show or my Trader’s Gold service.
🙂
But we didn’t quite get there.
IYT continues to fade. The daily candle is ugly so fade might just stop here and consolidate for the rest of the day. Also currently at June 21 and 22 lows.
– I like Peter’s work and analysis, as compare to others, as; he does not at least offer 11 diff possibilities for elliotwave pattern.
-EWI has been believing for top since 2010. They were saying that this is Just rally from 6500 and can max reach out to 10200 (djia). Googl will collapse under 100 from level of 300, AAPL top is in place 2-3 years ago.
-DAX is almost 700 pts down from top.
-DJT is down 236 today and approx. 600 pts down from recent top.
-VIX is between 10 to 20 since last 7 years, except, 1-2 spikes – Not sure what wave count applies to vix in long term chart?
-It’s manipulated & systematically controlled market by FED, Draghi, BoJ etc. We all know they will lose control one day or deliberately pull the plug.
-You can be 100pct accurate if you say – 1 day in future market will collapse or everyday predict the top and one day you will be correct for sure.
– I think chart is little bit working for short term – hourly/daily trading. Not for medium to long term predictions since last 7-8 years at least…
thank you
🙂
I now have my final trigger on this exhausting topping process….an outside reversal day in process. That’s all she wrote folk. Loading my last short positions.
Transports down almost 3 percent today is not a good sign .
DOW perfectly completed the ending diagonal. Now it needs to drop below the lower trendline.
Q- it looks like I was very very very close to calling the top within one point on the S&P- not bad!!! it is fun to guess. nobody else wanted to do it besides me-thanks
BP
Good observation
Transports peaked on July 14th .
they are now down almost 600 pts from that high.
roughly 6 % drop, not a big move yet it still
shows the timing was worth paying attention to correct .
Marc
Every trading decision is a guess.
Did you call the top ???
i m not sure
are you saying that was the top and no new highs
coming ? or was it just a short term call on your part ?
Um i have posted my time and date projection and
still waiting yet it is posted .
and yes it is fun to get it right isn’t it ?
Joe
/NQ, QQQ 1-hr chart looks worse than an eiffel tower. It’s carving out a straight edge of a cliff. NVDA 169 down to 158.
Peter
Only one question on ending diagonals .
From a very strict point of view
shouldn’t wave 3 be shorter than wave 1 ???
1 by 1 though we have had the utilities top then
the transports . the dow should be next yet …..
a monthly reversal is close by on tranny’s
yet it doesn’t look impulsive to me on a daily chart .
utilities may or may not make another new high .
transports though are on my watch list now.
Yes. But wave 3 is only slightly longer and everything else fits within the rules, so I’m willing to give it a pass until proven wrong. The be right, it has to drop to a new low from here past the lower trendline.
Peter T,
You are looking very prescient after yesterday’s Chart Show!
🙂
Thank EW. We just got to a point where we had nowhere else to go but down. We ran out of EW waves. We didn’t quite make it to ES 2485, but we got close. Thanks.
I know no one will agree with this
but i see 2 wave counts .
if we didn’t top then this has been an
expanding triangle from the july 14th high
the chart posted is of the dow, trans , nya, spx , oex , ndx , sox
all added together .
there is a 5 up in this yet at the moment i can also consider
this the end of an expanding triangle wave 4 which began july 14th.
it is no doubt a 3 wave move from the march lows .
another new high cant be ruled out .
my bias being timing over the wave count is what is driving this count.
http://imgur.com/ZhakEH5
Not the right pattern. I never take timing over the wave count.
Bottom line :
id say we are less than 5 % from an important high if we have not
seen the high yet . might be closer to 2 % yet giving it a little room.
its a big a b c rally though , an ending diagonal most definitely
fits into this
Thanks peter
i will keep a closer eye in the coming days .
Ill need to look back at my notes yet i think this week
was a low to low to high count . so its very possible we saw
a high of importance yet as i posted above i can see another high
this market is extended and bipolar and is looking more and more bearish
no doubt .
Today is considered a mini crash or sorts
and the bottom might be in
we are testing the pivot point right now .
Friday will prove this right or wrong yet ill
guess to say Friday is an up day
Joe,
I’m thinking about what you said.
For IYT, the ramp from 1/20/2016 low to 3/21/16 high then 4/20/2016 double top, retraced to a little under the 61.8% fib on 6/27/2016.
Today it hit almost 61.8% fib from 5/19/17 low to 7/14/17 high. So I’m watching if it can hold tomorrow.
As for VIX, it apparently posted lowest level in history yesterday, 12/26. Broke 12/27/1993 record. Markets faded from 12/29/1993 to 1/3/1994.
2470 is the pivot im watching on spx
if it can get above that and close above it
then next target is 2524 where wave 5 of 3 = 1 of 3
monthly chart shows we are in the late stages
of wave 5 of 3.
its all about how this market moves next week
yet Friday should be very informative.
Bottom line: while it looks extremely bearish im not convinced
we have topped just yet
Todays lows will be important next week and the spx 2470 level
ill consider the pivot ( 2470-2479 the pivot range )
That is the difference between us peter .
I agree that the wave count is very important if not
the most important yet i always give timing the bias
because sometimes the wave counts morph into something else.
3 wave moves are more difficult to trade in my view .
The wave count is essentially complete
ill keep moving my stops up and wait for the timing or the break down.
DJI closed at highs and SPX reclaimed 2470 pivot and this cast some doubt in my mind about what is actually going on. The indices seem to be displaying quite different price action profiles as both SPX and Nasdaq had what looked like impulsive waves down and three wave corrections yet DJI made a new high into the close. We may not be quite done yet it would appear. Incredible!
robert prechter just sent an email report out that it is over for wave three- not that it means anything just thought you would like to know
He probably sent that out before DJI closed pretty much at the highs of the day.
verne- he did send out earlier today! do you think then he is wrong? thanks
The picture looks very mixed to me. It sure does look like impulsive waves down in SPX and NDX but not in DJI. I think the fact that SPX closed above 2470 and DJI at the highs of the day raises some doubt about whether we actually have a top of wave three. Clearly we did not in DJI.
DOW futures are doing EXACTLY what Nas did after the close yesterday. Touched the top of the channel and sitting near it. NQ shot out of it and came down. My guess is DOW either does the same or hugs the top of it then breaks down. ~21840 – 21850 is my guess. I don’t think the DOW close was the high. Futures went higher, and usually these moves have to register during market open.
Mike- so do you agree with Prechter that today starts wave 4? thanks
Nasdaq yes. SPX more than likely, Dow no, unless closing bell is the high and it drops straight down at the open. I think the Dow has room to 21840 or so. SPX as long as it doesn’t retrace past 78.6. Naz looks done. We may not even have a first wave bottom in.
Nasdaq usually leads the market and topped first. So far, the retracement has only been 50%. If it heads down without getting up to 61.8%, this can be an extremely large first wave.
I was skeptical about the DOW topping at the same time. I had a measured target of 21848. I bought DJX Sept puts, then closed them out for a dime lose, realizing my initial analysis was closer to correct.
SPX looks like it topped, so long as it doesn’t retrace more than 78.6%. I would have liked a bigger first wave down. This is going to lead to choppy action.
Got lucky today. QQQ 144.50 puts expiring tomorrow. Bought at .13, sold 1/2 at .42, 1/2 at 1.80, and the rest at 1.42. Bot QQQ 8/11 puts at .79 to hold longer. They’re at 1.58. Added some SPY 245 lottery tickets for tomorrow at .09 just in case the retrace at the close was all we get.
I’ll be buying DJX Sept 211p if the DOW tops out tomorrow. They were 1.20 when I got in, 1.10 when I got out, so may go down below $1 tomorrow. Either that or I’ll look at higher strikes. 20,300 is my target, so that would put them $8 in the money if I’m right.
Peter- do you agree with prechter? that wave 4 has now started? thanks
just a dent today. I’m still expecting a little more topping in ES, till
end of next week, till Aug 4. Sideways and a small last up…. 2490-95 still has energy to defy odds.
This website is for educational purposes relating to Elliott Wave, natural cycles, and the Quantum Revolution (Great Awakening). I welcome questions or comments about any of these subjects. Due to a heavy schedule, I may not have the time to answer questions that relate to my area of expertise.
I reserve the right to remove any comment that is deemed negative, is unhelpful, or off-topic. Such comments may be removed.
Want to comment? You need to be logged in to comment. You can register here.