
Update, Thursday, December 3, After the Bell
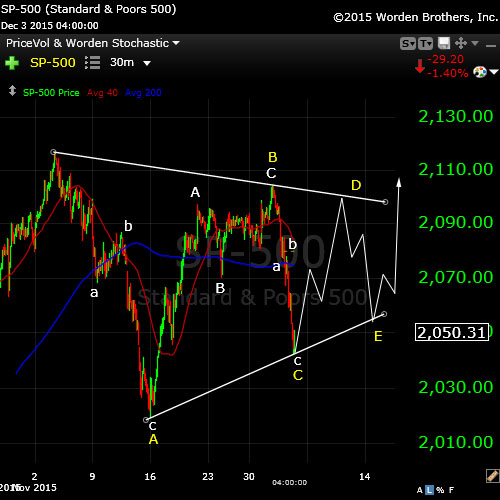
Here’s a quick look at the SP500 (30 minute chart). You can see it’s tracing out a large fourth wave triangle. All the waves so far are in 3 and the remaining waves should be also. The final wave up may either go to the previous high or may go up much further. I will do some measurements to try to find a range.
This puts well into next week to finish up the pattern. This fourth wave triangle signals that there is one more wave only after the triangle to finish up this larger C wave.
___________________
Update Thursday, December 3, Before the Bell
With Draghi’s announcement of more easing, the currencies seem to have changed direction. The eur.usd should now come down 62% to complete a second wave and then head back up again.
Meanwhile, futures have dropped without technical damage. They’re moving together with currencies inversely (as they have for a few months) so my guess is that during this second wave action in currencies, we may see futures and cash complete a double top.
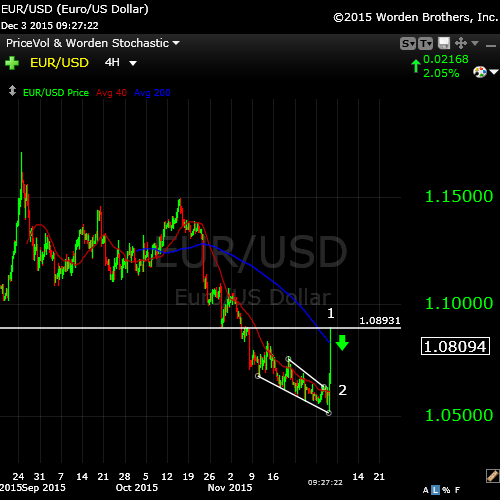
Above, a 4 hour chart of the eurodollar. You can see the ending diagonal complete this morning and the first wave up complete. It should back off 62% in a second wave before taking off again.
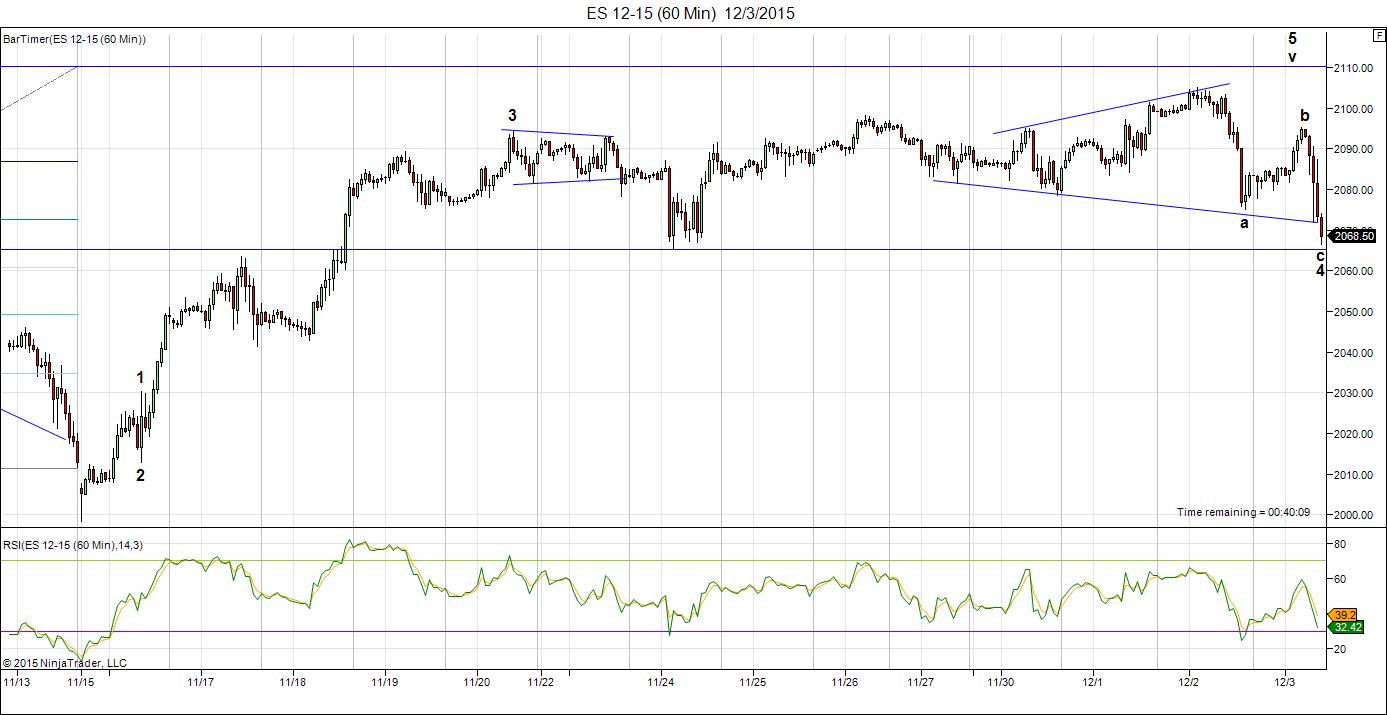
Above is the count on ES (60 minute chart) as of this morning. We have a second leg of a fourth wave forming, by the looks of it. This sets us up for the fifth wave up and the triangle disappears.
No more trying to update charts intraday. The problem is trying to label charts in transition—they’re still defining the pattern.
NQ appears in a channel and may have completed 5 waves up. They have all come down in 3 waves so far, so the target is still up.
Let’s see what happens.
_____________________________
Update Tuesday, Dec. 1 After the Bell
Tonight, I’ve updated the top two charts (SP500 and ES). There isn’t much point creating a new blog as very little is changing day to day. Currencies continue to work towards a bottom and the equities slowly trace out the final wave up.
Possible triggers this week:
- Yellen Speech: Janet Yellen, 12:25 EST, Wednesday, Dec.2
- Yellen Testimony Congress: Thursday, Dec 3, 11am EST
- ECB Press Conference: 14:30 CET (8:30am EST), Thursday, Dec 3
- Latest US Labor Report: 6:30am EST, Friday, Dec. 4
- Fed Meeting: December 15-16
The latest count for ES and SP500:

ES on the 60 minute chart (SPX futures) has traced out a 4th wave and we’re now working on the final 5th wave. I tossed out the triangle, as the final leg down ended up short. This pattern should result in an eventual test of the previous high at 2110. We’ve completed a small second wave within this last wave up and appear to be working away at the third wave.
It’s a similar count to the cash index of the SP500.
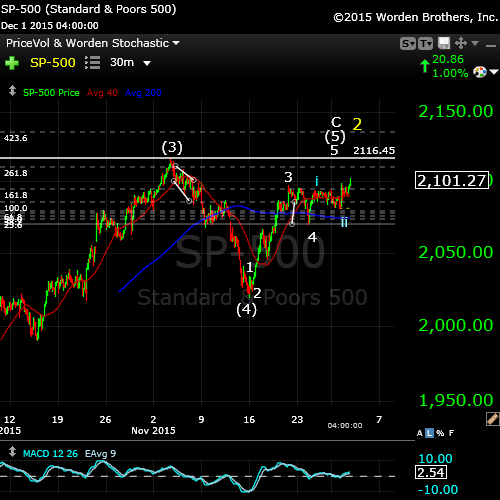
Here’s the 30 minute chart for the SP500. The final wave up continues to unfold … slowly. The SPX is in the same position as ES at the end of the day (Tuesday). We’re in a third wave of the 5th of the 5th. That would leave a tiny 4 and 5 after that up to the previous high at 2116.48.
Friday (Nov 27) was 97 days from the low of Aug, 24, which is 97 days from the all time market high of May 20, 2015.
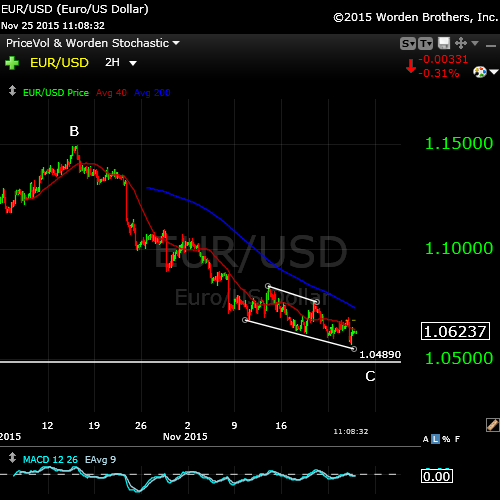
Above is the Euro/dollar currency pair. You can see the final patter playing out: an ending diagonal. The US dollar chart shows the same pattern. All the US dollar currency pairs are about the reverse at the same time the equities market tops.
An ending diagonal is a terminal pattern that ends a motive set of waves or a corrective C wave. It’s the “end-of-the-line” and results in a dramatic reversal.
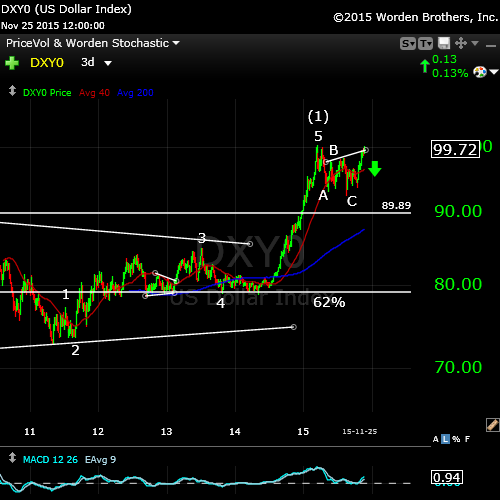
Here’s the dollar:
And finally, here’s a really super set-up, the pound/dollar.
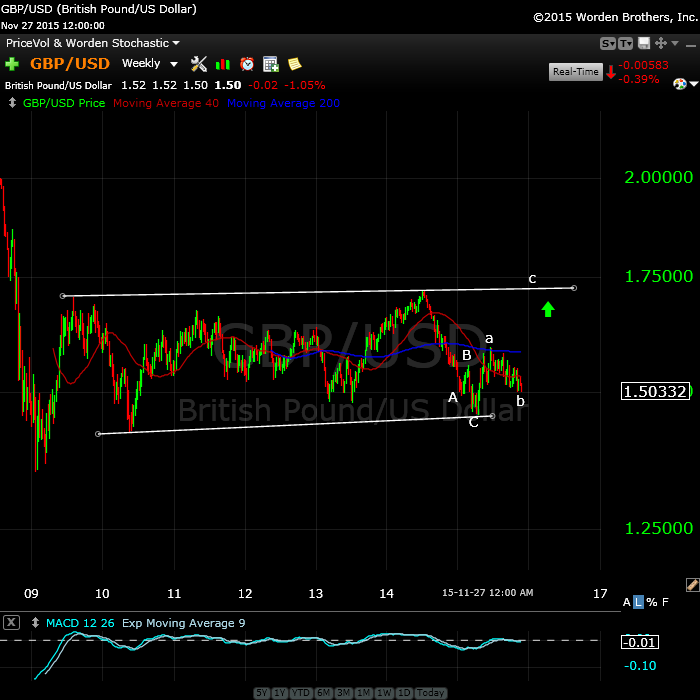
If you like trading currencies, here’s a no brainer. The GBP/USD weekly chart shows a large 4th wave triangle. We have a C wave left to go on the last leg of the triangle (the e leg) and then we should turn down into a fifth wave. I’ve been watching this one off and on for quite a while.
____________________________
Original Post: The Question of Seasonal Bias
I want to address a couple of issues here right off the bat.
The Decennial Cycle (chart below) that’s thrown around without a lot of thought is not a “cycle” in the true sense of the word. It a short-term phenomenon, or pattern, perhaps. It’s interesting that most charts only go back a few decades to make the case for a continuing pattern.
The chart above goes right back to 1805 so you can see the issue I have with this phenomenon being anything other than a short-term pattern. 2005, in fact was ‘flat’ or negative, depending on who you listen to. So far this year, the NYSE is down one percent. I find the reference to the “decennial cycle” lacking in any kind of credibility.
You’ll find the article to this chart here.
In terms of seasonal bias, Santa Claus and end of year seasonal rallies show even a spottier performance. On the other hand, as a contrarian, I would much rather see rabid optimism in the market, as we have now. In my way of thinking, it sets up the perfect scenario.
A Wave-Following Fool!
That’s what I basically am. I haven’t found a time when Elliott Waves have lied to me. It always ends up being a weakness on my part if I get a count wrong. The waves always do the predictable thing, very often in an unpredictable manner.
Cycles are important for identifying turn dates. It could be argued that they haven’t been very predictable lately. There’s some truth to this, but keep in mind that we’re dealing with an unnatural market (influenced by central banks around the world). Cycles are natural phenomena. You can fight them only for so long. Eventually they’ll take control again.
We’re looking at November 23rd to 25th (full moon) as possible turnover days. The wave structure forecasts a turn. Converging cycles (I cover this below) are also pointing to the very near future for a trend change.
It’s interesting to note that the period between the May 20, 2015 market high and the low on Aug. 24 is 97 days. Taking that same timeframe from Aug 24 (97 days) takes us to Nov. 27 (this coming Friday).
Bottom Line: We’re in the final fifth wave up looking for a double top, turning over into wave three down.

Here’s 15 minute chart of the SP500 from the market close on Friday. There are a couple of ways of counting this wave up, but nonetheless, I put us in the final 5th subwave heading for the previous high of 2116.48. We may either be tracing out a traditional motive 5th wave or heading into an ending diagonal. There are signs in the futures that we’re in the midst of the latter, but the end result will be the same.

Backing out the chart of the SP500 (1 hour bars), we can see the larger pattern playing out. This is an expanded flat scenario, which is a set of corrective waves in an ABC (3-3-5) configuration. You can see we’re in the final stage of the C wave.
What’s particularly interesting about the ending of this wave is that the fourth wave dropped to exactly 1.618 times the length of the first wave, which is the usual length for a 5th wave. It also dropped to the previous 4th wave. It always amazes me as to how organized the market is.
This forecasts the probability that the fifth wave will stop at the previous high (2116.48) and turn down.
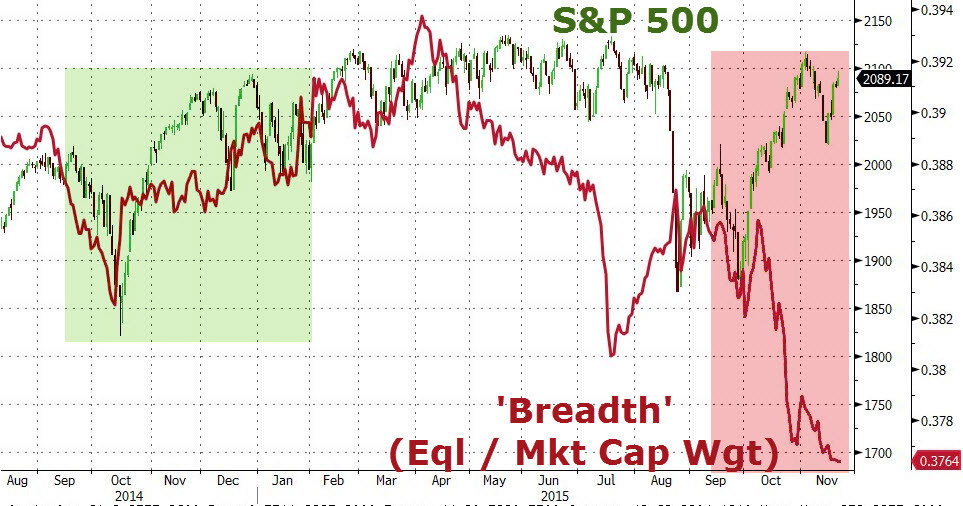
Above you’ll find a snapshot of market breadth, which continues to implode. This is from today’s zerohedge blog post.
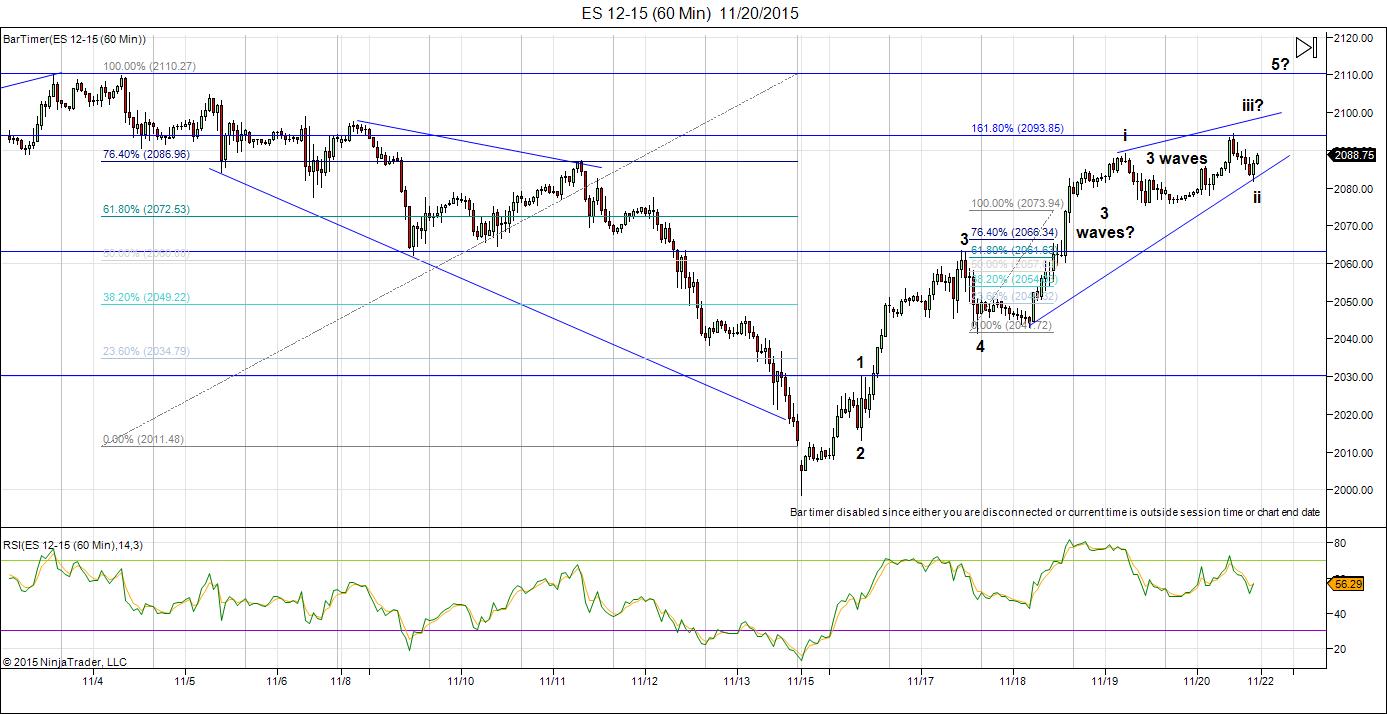
This is the one hour chart of the ES (SP500 futures). I’ve labelled the waves, which are much easier to decipher here than in the cash indices. Look at the final waves. The segment after my i label is definitely in 3 waves and the wave up before it also looks like 3 waves, but I can’t be as certain about that. This would suggest an ending diagonal, a wave in 5 subwaves, each wave of which is 3 waves (3-3-3-3-3). This is an ending wave and if this is what continues to trace out, it should give early warning of a top.
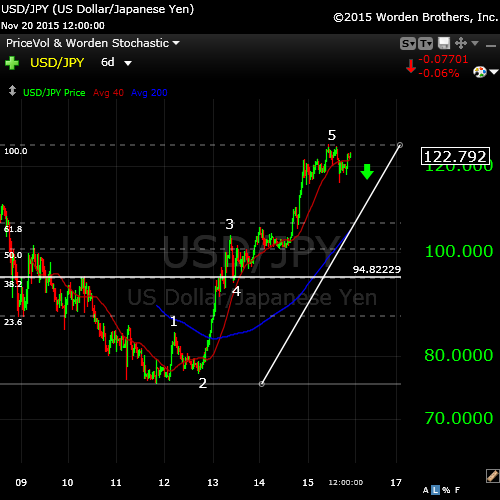
Currencies have turned, or are in the midst of turning. This is the 6 day chart of USD/JPY. It shows the first motive wave up from 2012. You can see that it’s complete five waves up. It needs to retrace in a second wave down and, in fact, has already turned. It appears to have completed one wave down, one up, and is set to start the C wave down. I would expect this wave to retrace 62% (the horizontal line).
This reinforces the “All the Same Market” idea that I’ve shown in previous posts. In fact, all the US currency pairs have either turned up or will do so in a matter of hours or days. There are some very good opportunities setting up here.
Now on to cycles:
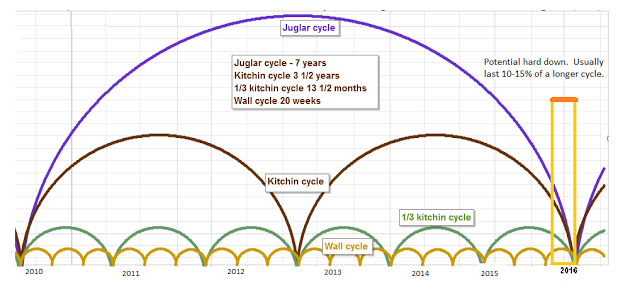
Here’s a chart of the Juglar, Kitchin, and Wall cycles which are harmonic. They’re forecasting a turn near the end of 2015 or very early 2016. More specifically, they point to the January/February time period as a bottom.
You can find this chart and a full explanation at http://swingcycles.blogspot.ca.
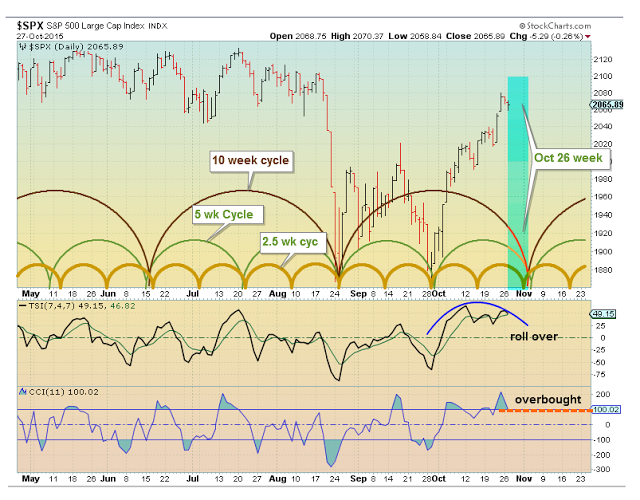
This is a similar chart of the recent past. You’ll see the end October/beginning of November forecasting a major top. In fact, we topped in wave 3 of C on November 4—a direct hit.
Andy Pancholi’s “Market Timing Report” forecasts November 23 as the major turn point for the month. I highly recommend it for its accuracy. You can find it here.
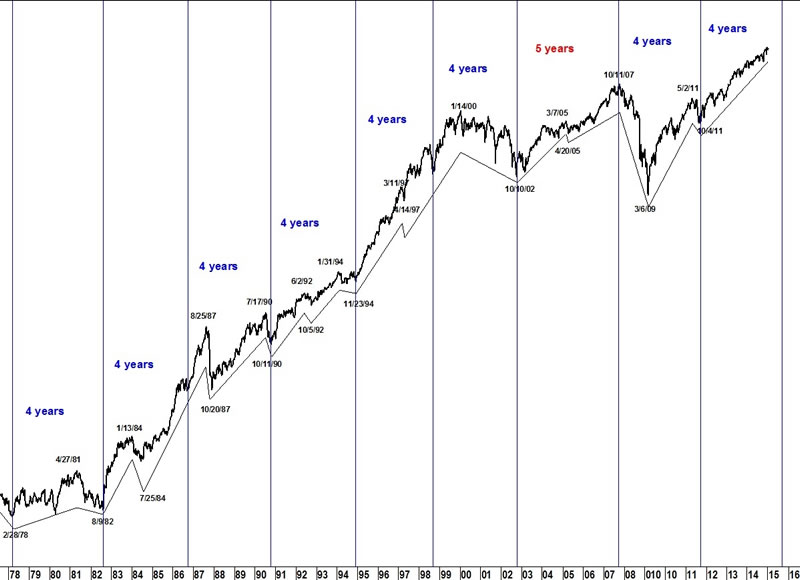
On a longer-term basis, here’s a look (above) at the 4 year cycle on the DOW. This cycles forecast looks to the end of 2015 for the turn. You can see how long-term and persistent this cycle is.
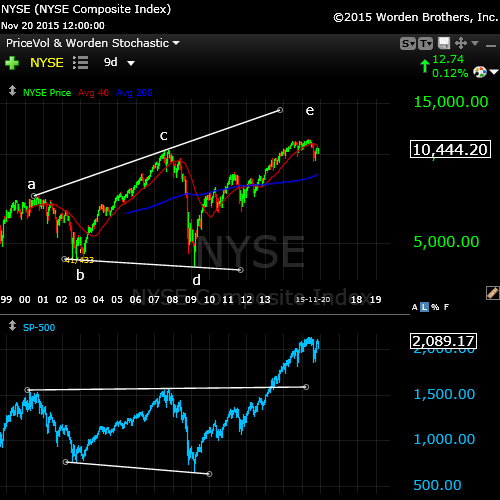
I was asked this week about the broadening market topping pattern (well-known market topping pattern—not Elliott Wave related), so decided to include it here.
Above is the larger broadening top of the NYSE in a 9 day chart going back to 1999. This would be called an “ending expanding diagonal” in EW terms. It’s an extremely bearish pattern and seem to be failing in the final stages.
It’s interesting to me to note the difference in the NYSE as opposed to the SPX (lower blue chart). It speaks to the breadth of the market. It tells me the buying is concentrated in the big cap stocks.
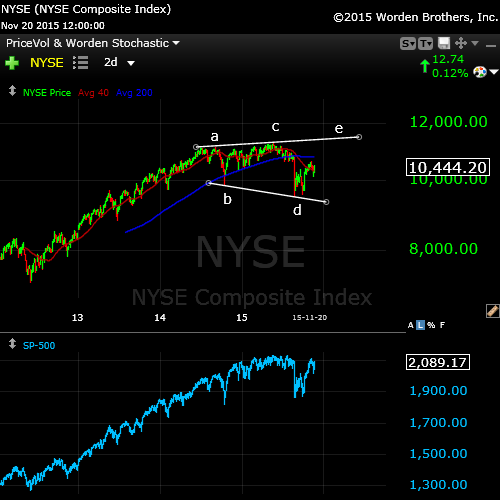
Above, we can see this same pattern on a short term scale in the final wave of the larger topping pattern. We have what appears to be a failing e wave in the NYSE 2 day chart.
There’s also a non-confirmation here, as well. with the SPX chart. This suggests the rally is narrow on even a short term-basis, with most of the buying in the big cap stocks.
DOW Theory (Transports and Industrials Non-Confirmation)
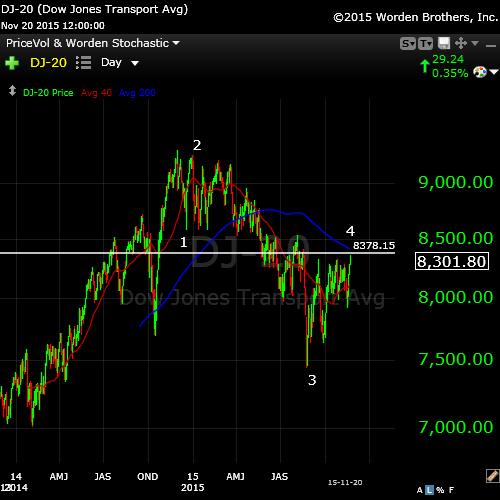
I haven’t brought up the Dow Transports non- confirmation for a while, but it’s been busy at work setting up for the next drop. The Transports Index (DJ-20) is tracing out a typical fourth wave (above), with the Industrial Index finishing off the 2nd wave (below). Both are setting up for a turn down in tandem. You can find background on the DOW Theory here.
For more confirmation, you can visit this article on the Baltic Dry Freight Index. Scary stuff!
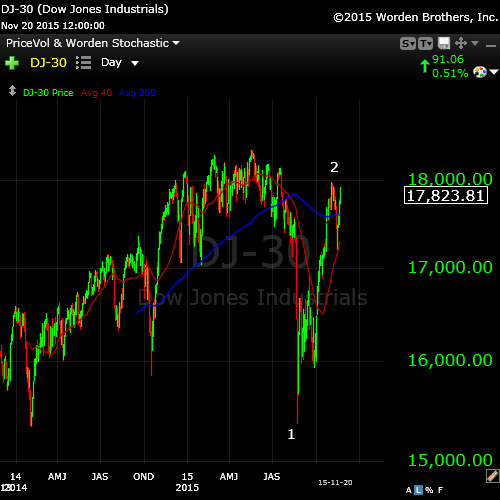
Above is the daily chart of the DOW, showing us at the top of wave 2.
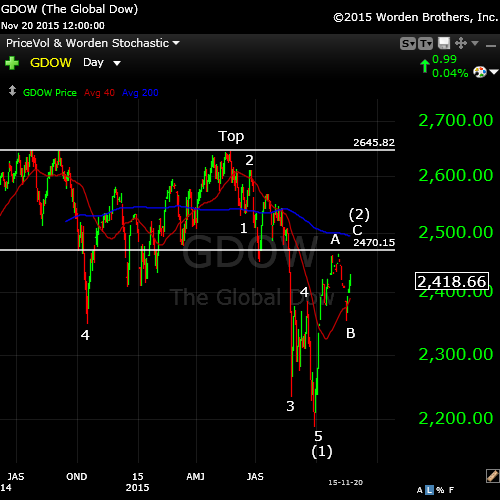
Next to last, here’s a daily chart of the Global DOW. Not much has changed here lately.
The Global DOW is like the elephant in the room, letting you know what’s happening on an internationalk basis. We’ve completed one set of motive waves down from mid 2014 and have retraced exactly 62% in a second wave, where we sit now. Actually, we’re completing a fifth wave up in this second wave rally, which should top at the same time as the US equities roll over. The writing is on the wall!
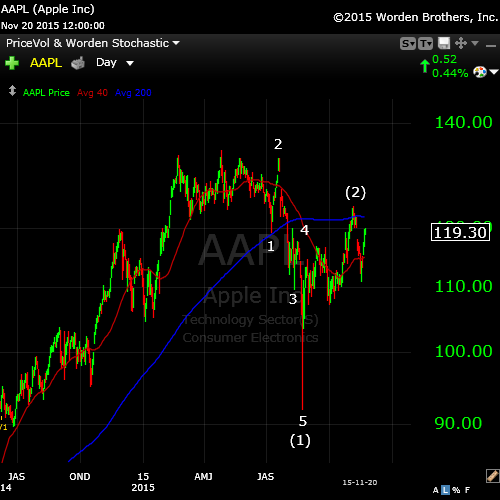
Finally, a daily chart of Apple Computer. Here’s a textbook Elliott Wave set-up, with absolutely perfect fibonacci measurements. We completed one wave down of 5 motive waves and retraced more than 62% bin an ABC second wave. The third wave down is 1.618 X the length of the first wave, which the fifth wave is a similar length. Nothing like hitting me over the head with an Apple bat!
The final small wave up will either turn over now or head up to test the top at (2) before rolling over into a third wave down.
There are a lot of stocks setting up in similar manner out there …
It should be an interesting week coming up, both with equities and currencies. Stay safe and profitable.


Dear Peter,
Great analysis.
I am in full agreement with you on the currency turn which will in turn lead the indexes down.
The USDCNY pair just spiked above or about the same level when the RMB was devalued a few months ago (end Aug)at around the same time you uploaded this report tonight.
“All the same ” scenario is playing out as suggested and well, give it some some as it is a big ship. In due time you will be proven right.
Just my 2cents, don’t take it too hard if a few waves run rogue.
Key point is overall big picture is in the right direction.
As they say, never the same but similar .
Btw, thank you for including the megaphone.
Vince
Thanks. Currencies are at double bottoms, so I don’t expect much of a lag.
Here are a couple of charts from 2000 added to the page link I sent you previously.
https://worldcyclesinstitute.com/broadening-top/
Thank you very much for the chart which depicts 2000.
If I am not mistaken , the broadening top also showed up in 2007 leading into the crash of 2008, just like the current one too.
All the 2000, 2007 and 2015 have the similar patter , but do pardon me if my view is too shallow or wrong.
May thanks again .
Great update peter
i only have 1 question
On your NYA chart , the broadening top . Could the a b c d e subdivision be pushed 1 swing further to the right ? if so if we labeled your initial b as the A then this would place us in wave D ?
This would imply the august lows ,must hold .
Joe
Hi Peter
Something just popped into my head that maybe you can see or think through .
Having just gotten home had time to look at the daily dow cash index .
Corrective waves tend to be 3 3 5 or 5 33 yet if we do go above nov 3rd high it would be 5 waves up as i see it . the prior decline was 3 waves from my point of view .
hence the pattern to me would be a 5 3 3 , the opposite of the typical 335 .
the larger pattern from the august lows may become a triangle formation.
whether or not it is a true triangle with 5 3’s 3 3 3 3 3 or not i do not have a solid case
yet 5 ups with 3 downs would imply a series of 1’s and 2’s versus a triangle if this
happens to take place . dec 9th 11th is looking more and more like a top and not a bottom at this point . if the market is bullish ? more sideways action would make sense
breaking the august lows would be an obvious bearish signal .
ill touch on my larger term timing later in the week once i have all my ducks in order
to explain it in more detail .
last consideration , what did the federal reserve do back in 1927 ? and why ?
Joe
Pattern to become 3 5 3 or 3 5 5 correction
hi peter
Last thoughts using the xau index .
the xau monthly chart fell in 3 waves from the dec 2010 high at 232.72
to a low at 82.28 in the month of june 2013 , a 64.64 % decline over 30 months
the index then had a 43 % sideways triangle time retracement ( 13 months )
and has been falling ever since .
on a % basis this wave C would fall .6464 % from the 106.01 high ( targets 37.49 )
a top to bottom to bottom count would target the month of dec 2015 for a LOW
The key to me is more price than time at this juncture .
a poke below the year 2000 lows would scare everyone out and most likely
create a bottom on its own . yet the 2 equal % moves should also be considered
the dec low might be the cycle low your thinking of yet in a different asset class ???
Joe
Today’s FED meeting !!
Interesting research here (13 minutes).
Gary G.
https://www.youtube.com/watch?v=F02jDjl3m-4
Thanks, Gary, interesting
Yeah, interesting.
Gary,
A couple of updated charts at the top of the post.
Jake Bernstain a noted commodity cycle letter writer and author said seasonals are weak and easily overidden by other factors. He said movements opppsesd to seasonals tells you more like a relative strength factor. Larrry Williams said an ideal trade is when commercials are buying or selling with themupcoming seasonal.
A MR John Harder wrote a study book on the broadening top. Published by welles wilder in 1981. He said the pattern is pure elliott. Point one is the elliott wave 3 top. Followed by an elliott bull flat correction with wave B at a new high. Afterwards the fifth wave. IMO on a weekly chart the dow has already done at least two broadening tops with sell signals that failed. WHY??? IS IT POSSIBLE THAT THE PERIOD 1974-19082 PRODUCED SEVERAL ELLIOTT 1,2’S THAT NOW HAVE TO BE RESOLVED AS ELLIOTT 4,5’S ???
SPY in Jan 2015 opened at 206.58, today we’re at 209.00, Based on the Dow in the past 110 years we have NOT had a down 5 year. If we do in deed have a positive year for 2015, one may want to write this down for 2025 I am bullish over all, we will have some small short set backs but nothing to worry about. In fact I have some shares on the UVXY ( average price 27.18) for a short term trade as for insurance on my longs. Good luck every one.
I updated today’s intraday charts at the top of the post and also made a comment a bit further down regarding the fact that Friday is 97 days from Aug 24, which was 97 days from the top of the market (May 20).
Peter,
Just another way to look at this. 34 times e from 5/20 is 8/21. HC Venus 90 Saturn was 8/23. That was a Sunday. So the low came Monday. Counting 34 times e from 8/23 gives 11/13, with HC Mars 90 Saturn.
Make that 11/23
André,
this is the fourth wave this morning. It’s come down in the SPX to 2.618 X the length of the first wave. Since we have a muted week of trading, I would guess it will take until Friday to reach 2116. So we might be seeing the results from Black Friday helping to deflate the market. It would also be 97 days from the low, which was 97 days from the all time high.
Hi Peter
just a thought on your updates .
Dec 12 you have a low ( plus minus a few days )
breadth is crashing ? true
my question is now : the last time breadth was this low when was it ? what did the market do once breadth ticked up ?
could it be market breadth is following the cycles and price somehow managed to hold up ? a time based correction versus a price based correction ?
how will breadth hold up coming out of this next decline in stocks
Will it diverge ? if so it will create a huge buy signal
something is amiss though and I have not yet figured it out .
silver/gold ratio not there for a bottom yet ,same with xau
I think the Dec 12 date. change, is more about a change of mind than a change of price .
looks to be an interesting next year with a potential change of mind showing up in the elections .
markets move on expectations more so than reality
Joe
Hi Peter,
Any comments / update on today’s market move please .
AZ
AZ, I just sent andre a comment on that.
Thank You Peter
AZ
As always, you’re welcome.
Peter ,
One more question please ,
If this wave ( 2 ) finish higher than 2116 but lower than 2136 ( the all time hight ) , then does this effect our count ?
Thank you
AZ
No, but I’m expecting it to top around the 2116 high. I just replaced the SPX chart at the top of the post and I’ll up date the ES one shortly.
The count would stay the same unless we make a new market high.
I placed a new chart of ES. It has a rather strange ending wave, which I’m guessing is an ending diagonal. That’s because the wave I have labelled as wave d is in 3 waves.
I am reminded of one of Hurst’s dictums from The Profit Magic of Stock Market Timing. Major int’l events have little or no impact on the stock market. Or as Peter would say, not until the Elliott wave counts are complete at least.
haha. Right on!
Hi Peter
a couple of things going through my head .
the elections in nov 2016 and how to play into the rest of the cycles .
my final thoughts as we go into next year is that next year will be
nothing more than a sideways range in the dow .
a high near 18151 in possibly early january if not dec 11th
a sideways range between now and mid to late dec 2015
this being a B wave now from the august A
it would take until nov 2016 to complete .
selling 18151 buying 16600 area ( C )
selling a weekly close above 18086.45
the puetz window closed oct 26 and the market has stalled ever since
we are presently in a minor triangle which should hold 17245 if 17910.33
fails to be broken . 17245 would be wave A of a minor 4th wave triangle
we are now in wave B which means we top any day now and fall.
wave C in this minor triangle should bottom near 17378 then bounce
back to 17737 or so in wave D then E around 17484 followed by a pop
up into the 18151 area which completes the larger ( B )a drop from 18151 to an
ideal low for wave C is 16541 which is a decent trade .
then the truth will prove out or not by showing us waves D
with E into nov 2016.
aug 24 ( A ) now ( B ) topping. wave ( C ) down is next , whether is be a strong C
or a C within a larger triangle remains to be seen .
joe
Peter–You cannot make this stuff up. Like they say in the South…..you can’t fix stupid !!!! Does anyone ask the question, when is Europe going to totally lose confidence in the EU and the EURO? Dollar bears might want to take these stories into consideration….perhaps an explosion in the dollar to the upside comes next as capital flight become the operative words? Gary
http://www.zerohedge.com/news/2015-11-25/did-mario-draghi-just-leak-bazooka-two-tiered-nirp-system-may-presage-big-rate-cut
http://www.zerohedge.com/news/2015-11-25/what-draghi-hath-wrought-german-yields-negative-7-years-swiss-14-years
Yeah, it’s nuts. It’s like the perpetual liar, who has to keep lying to avoid being found to have been lying in the beginning.
In the meantime, euro/usd is heading into a third wave of the fifth by the looks of it, and once this thing hits the bottom of this set of waves, we should have a top in equities. Pick a used currency pair. All doing the same thing.
Peter–I have been troubled for some time that what is coming will be far more than a stock market event….it will be a systemic financial event. “The one lesson history teaches in the financial markets is that there will come a day unlike any other day. At this point the participants would like to say all bets are off, but in fact the bets have been placed and cannot be changed. The leverage that once multiplied income will now devastate principal.” Martin Mayer “The Dangers of Derivatives”
Gary,
You’re troubled for good reason. This is the largest financial bubble in history. The resulting depression will be the largest in history. I expect much of the infrastructure and delivery systems built up over decades to break down. There will be a pandemic, we are going into a mini-ice age, and many will lose their homes and net worth will plummet to zero. Chaos will rein across much of the North American continent. It’s getting time to think about how to batten down the hatches.
I think this first big drop will be OK, but after that, life is going to start to change dramatically. I’ve said often that it’s a fabulous time to be alive, but at the same time, some of the events we’re going to witness will be downright frightening.
Back at the ranch, I will mount an update chart of ES tonight, maybe SPX, showing today’s fourth wave triangle and also the euro/usd showing the ending diagonal. We’re very close.
My main computer has been down all day as I got so crazy with Apple’s new el CRAPitan system (buggiest thing they’ve ever put out) that I decided today to bite the bullet and roll it back a version. One of the themes of the eventual breakdown of societies is overall complexity and the diminishing returns resulting from it. I need say no more.
Peter
Your last 2 sentences were perfectly put.
🙂
The $ looks far more bullish to me. It has a 6+ year 1-2, 1-2. It is now in 3. But extremely similar chart formations (fractals) like coming off the Aug 1982 stock market. It strung out a long flattish 1-2, and then started straight up,, paused like the $ now. It made another measured move much like the $ going to 120 or euro to 80 over the next year. The 1983 bull mkt in the $ is very similar, also.
markets seem to like to move to expected events, like the market bottom on the day Iraq 1 started. What are we moving toward now? The rise in interest rates in Dec. So that should be a short term top in the $, a high in rates and a low in the stk mmkt.
I added a labelled dollar chart.
Peter–I am not a pro EW type but I have a good friend who is. He says we are in a massive Wave 4 (triangle) ….he is looking for another 3 wave move to complete the pattern before we head up in Wave 5. Since I am not competent to comment, my view is based on old fashioned TA….if we take out the previous high watch out. Joe Granville once said…”markets always crash from oversold.” Could apply to commodities and the EURO for some now unforeseen reason such as a spike in the USD? Gary (Denver)
Not as far as I’m concerned – the triangle. Don’t see it.
And currencies don’t support it.
Peter–Actually I do not see the triangle either. Still has the look of a cup w handle or a completed flag or pennant. I still say if we break out of the top of the pattern we could get fire works. Gary
http://www.barchart.com/chart.php?sym=DXY00&style=technical&template=&p=WN&d=X&sd=&ed=&size=M&log=1&t=BAR&v=0&g=1&evnt=1&late=1&po=1&o1=&o2=&o3=&sh=100&indicators=&addindicator=&submitted=1&fpage=&txtDate=#jump
Thanks Peter. I see what you are saying. From late July to mid Aug of 2014 the $ had what clearly appeared to be an ending diagonal, but broke to the upside. I am very long the $, so Murphy’s law is on your side. I read mostly goldbug stuff and they are so negative on the $, it makes me positive.
I’m with you….if we pop out above the previous high..watch out. Gary (Denver)
We’re going to get a dramatic reversal at some point. Don’t know that it’s today. Futures and cash should still tag the previous highs. Currencies are almost at bottoms.
Latest charts up from today at the top of the post with a bit of commentary.
i think 17245 should be considered very important support over the next several trading days .
my wave count has changed into a corrected wave count . i have to accept it atleast.
aug 24 low a b c 1, 2 being the late sept low , a b c 3, nov 3 peak , wave 4 nov 13 at 17245
A now 17245 to 17914 B now in effect 17914 to ?17479 ? B then C up to complete 5
that would be 5 3 wave moves hence a b c x a b c .
Time is running out for this rally !
Joe
There are 2 versions of time. One made up by humans – assuming a day is a day – and one being natural : solar degrees.
The 5/20 high was at 58,6 degrees. When we add 34 e degrees we get 151. Adding again gives 243.4. Back to human time we get 2 dates : 8/25 and 11/26. Next date would be 2/25/16.
This confirms Peter’s timing. Next week we’ll see the 3rd !!! 34e solar degrees down.
Squaring price and time would suggest – if my calculations are correct- that S&P has to touch 2190 for this squaring to happen. Opposite this price we find 2098.
The general idea is that not every squaring gives a cit, but that every cit happens with a squaring.
We’ll see.
p.s.
Every hard angle is valid for this analysis. So, given Peter’s analysis the 2098 seems the relevant number. When S&P touches this point it becomes the new equilibrium price. A close beneath would confirm the cit.
The crash angle determined by 1792 and 1929 gives 11/28 as midpoint.
Hi André,
As Peter knows from me in personal, Nov 4th was the real top for America. However, Europe (DAX Index) shows that the top is today/tomorrow. Where have we seen this before… Oh yeah, 20 April TOP in the DAX, 25 May TOP in America. So this time it is the other way around. 😉
In other words, a failed/truncated wave 5 up for America and some European Indices like the AEX (which I trade since I am Dutch). And a ‘normal’ wave 5 for the DAX (higher than wave 3) and a few other European Indices.
I wish I could upload some graphs…
The BIG 3 should be around the corner any time now!
Cheers,
W
Whazzup,
I think you are right. The holiday shopping will show how many people are living on foodstamps. Should be an interesting week.
By the way, I made an error calculating the crash angle. The real midpoint gave the 2000 high. But this won’t change the strong timing we have this weekend.
Another technique is to just use the square of nine on the NYSE birth date and the 1929 crash high.
Using the wheel of 24 1792 gives 11/28 and 1929 gives 11/27. This means the 2 squares of nine cross. Should be significant.
Using the 3/24/2000 S&P high date, the 2000-2007 angle gives 11/29/2015.
This is the main angle and it connects the highs. Always used the nyse april timing, so see this for the first time. Should really be a very significant high.
The square root method on the S&P 2009 low gives in the midpoints (=90 degrees) 5/18, 8/22, 11/28.
Yet another confirmation of the major cit we will see in a few days.
André!
Super info, thanks man! I still need to find some time to do the squaring on highs/lows like you explaind. I printed it, it is on my ‘to do’ list. 🙂
Cheers,
W
Thanks for all your work, André,
We inch ever closer to the previous high. This is the fifth of the fifth of the fifth, so once it’s over, we have to change trend. Friday is a half day market day and Sunday is usually positive, so I lean towards Monday, but I’ll be watching closely Friday. 🙂
The market will hold the gains until ECB if nothing exeptional happens before
Peter,
I know You “love” AAPL and AMZN.
So, You may like this:
http://www.zerohedge.com/news/2015-11-26/buy-and-hold
Yup. Buy and hold! Hold right to the friggin’ bottom.
Just shows how far may go the exuberance
And that was the market driven by the natural forces.
Imagine ECB and the FED buying the stocks and ETFs like BOJ and SNB.
Where will go the prices?
Amazingly, the square root method can be applied to astro degrees.
3/24/2000 HC Jupiter was at 43,8 degrees. As Jupiter’s cycle is about 11 years, we need the second cycle. We see 2 relevant values : 149.2 and 193.3. Calculating squares we add 11 to 149,2 and get 160.2 Jupiter touches this degree 11/24/15. Jupiter needs 12 days to move one degree, so allow for a few days either side the 24th.
The amazing thing is that this is not about financial markets, high or lows; it’s astro degrees. One square is 4 months; so 11/24 +/- some is significant.
The square of nine rules the universe!
Now, this fascinating. I know from the Uranus/Neptune conjunction (171.2 years, this time 1993) that the climate changes and gets dry and cold. Exactly 14 years after than conjunction, (2007, 1835, 1663 … etc) we get a financial depression. The only thing stopping this one from completing has been the central banks. Well, nice try. Nature wins in the end.
Yes, it’s all about electromagnetic waves, gravity, and the planets … go figure. Who knew? (our ancestors …)
I found this today and I am flabbergasted. That Jupiter moves with time is no secret. But if Jupiter had been at a different degree I would have seen a different timing. So Jupiter had to be precisely there at the 2000 high. The vibration (all the things you mentioned) must be very fundamental and impacts everything we know. I am not religious, but sometimes I wish I was 😉
I’m in the midst of trying to equate the major movements of planets with the key cycles we know of. For example, the 18.6 year Lunar Nodal Cycle is also the 18.5 year Real Estate Cycle that one of my videos is on. I’m just starting work on a book called “The World Turns” which will be about all of this, so the deeper I get, the more I find I don’t know. But how the solar system affects us on Earth is mind-boggling.
My first book, which I’m now into is a little one on “How to Profit from Deflation.” No planets involved … haha.
My real interest is in the bigger picture and how all of this works like a complicated engine that just rolls on and on, over and over again through time …
Sorry 18.6, not 81.6. I just corrected it.
I use the 18,6 year cycle in the Dewey algorithm. Starting from the 2009 low this gives 5/18/2015. Next stop 6/23/2018.
I think this is what Gann meant with the law of vibration. What interests me most is how the square of nine fits into all of this. Now I found Jupiter I am sure I can find more.
12/1 HC mars-Jupiter conjunction; opens disaster window…..
If you find more, please let me know. I’ve played a bit with Gann and will try to spend some more time over the holidays. 🙂
At the 1929 crash HC Saturn was at 63,17 degrees. We will use the 3rd cycle (Saturn 29 years). Using the same method as with Jupiter I see 232,4 and 293. On square is 15,16 degrees. Add 15,16 to 232,4 and we get 247,5, Saturn will be there 12/2/2015.
Saturn takes 30 days for one degree. So a square is 15 months. And the timing is +/- a few days. And 1 week from the 2000 Jupiter timing!
And this is calculated from 1929. Can you believe it?
All the data I use can be found in the HC ephemeris. So for those who can’t believe it; You can do this calculation yourself.
André!
HC Ephemiris??? Explain please!
I was going to buy an Ephemeris guide for 2016 via Amazon but if you have a better idea. 😉
Cheers,
W
http://www.astro.com/swisseph/swepha_e.htm
Wow, André, this is COOL! Lots to learn.
Now we are talking André! Thanks mate!
So the HC Ephemeris is best or? Can you elaborate a little on this?
Cheers,
W
For traditional astro (Mercury retrograde etc) the GC ephemeris is fine. But for timing the way I illustrated you have to use HC as retrograde moves disrupt timing. Time can never go backwards.
So, look for the HC position of the relevant planet at an important date (like a major high or low). Take the square root from this degree and add it to the degree you had. Take the square root from the first square root you had, add 1 and resquare. And so on. Other than with price you will find the calculation can give degrees > 360. At these points you deduct the amount by 360 and you have completed one cycle in the zodiac. With the second cycle you deduct 720 etc.
Now you can count zodiac cycles. This is important. Jupiter’s zodiac cycle is roughly 9 years. When I use Jupiter from 2000, I have to use the second cycle as the first one ran out 2009.
You will see this timing works amazingly. This method on price works as well. So when planetary timing confirms price timing it means the planets determined the price.
Just play with this technique. Use slow planets for longer terms and fast planets for shorter terms.
Enjoy!
André
AWESOME ANDRÉ!
Peet!
All the stuff that you are saying… DAMN, like we are using the same pair of brains… If you are ever in Holland, PLEASE NOTIFY ME.
@André, you are welcome for a cup of coffee as well. 😉
Cheers guys!
W
For you, Wouter, here’s a preview of my speaking video promo … I’m building two new websites, so the text on this page is somewhat preliminary … https://worldcyclesinstitute.com/speaking/
But I just finished the video about ten days ago.
Gives you an idea of where I’m going with it some of this info – I have to speak to an audience that has no idea of what’s really going on out there.
TY Peet! Will look at it tomorrow!
Cheers,
W
For shorter cycles we use solar degrees. 10/15/14 gives 246,98 and 5/20 gives 245,7.
Sunday Sun at 246,3
With the 9/19/14 high Venus was at 153,1. Same method brings 133,14. Venus will be there 11/30.
No matter what you use, everything resonates with the vibration. How long the cyle is doesn’t matter. Just use HC as retrograde moves are fake and distorts the calculation.
At the 2009 low HC Mars was at 306,9 degrees, Same method, 4th cycle we see 158,1. Mars was there 11/25. For a 6.5 year period +/- 5 days is really nothing,
Posting more is useless; it’s all the same anyway.
Would be interesting to see is we can use the moon for 3-4 day cycles.
Steve Puetz’s book has a lot of charts on lunar and the market. I’ll have to get back into it.
And for very long cycles Uranus (83,75 year). In 1792; the birth date of NYSE, Uranus was at 138,25 degrees. Same method, 3rd cycle gives 15.0. Uranus now at 19.0. This is exactly 4 degrees further. One uranus degree takes 3 months.
This one a bit experimental, but I know 4 was special for Gann.
Ryan Detrick
#BlackFriday has been red 5 of the past 6 years. The good news? Rest of year up 5 of 6 times with >+3% avg return. $SPY
I am taking a cautious approach here despite the above. Although I have been long most of the past few weeks, I am concerned with some gann cycles into the mid Dec time frame. I will be hedging more aggressively during this time frame. I still do not believe we will see the Aug lows penetrated at this time. Good luck every one.
Peter,
the gold is going to the new low.
How does it change your count ?
Can’t see that chart at the moment, but it should be in an ending diagonal, so no
The gold has got out from the triangle to the downside on heavy volumes.
Triangles spell the end. So we may have a tiny additional move down, but the next major move should be up. This is also an ending diagonal.
Hi peter
along with my thoughts i sent earlier today in regards to dec 11 2015
im going to go into some shorter timing setups im seeing using basic
math .
bottom line dec 9-11th is full of time clusters yet dec 16th and options expiry should
be considered just because of the skews that tend to happen near the expiry
that said here goes .
the print low on aug 24 to print high on sept 17 was 17 trading days .
im going to label that as wave 1 ( yes i know its a 3 wave move but bear with me )
taking the nov 13 closing low and adding 17 tradings days targets dec 9th
hence 5 would equal 1 in terms of time ( this is about timing )
the bottom on aug 24 to the bottom on sept 29 was 25 trading days .
( the 25 trade days shows up alot so should be considered until proven wrong )
sept 29 plus 25 trade days targets nov 3rd , low to low to high count
nov 3 can be labeled 3 or c depending yet not my point here .
adding 25 trade days to the nov 3 high is 8 trading days from today .
that targets dec 9th . so 2 matches .
oddball math yet on the dec ym dow futures contract .
wave 5 ( yes subjective ) will equal .618 of wave 1 ( i know a 3 wave move )
at 18029 , the high on june 22 was 18002.
the 18029 level is only 228 pts away . given the fluctuation in a given trading day
the market could achieve this level easily yet i would expect it to be rejected
forcefully .the futures and the cash index are basically trading a few points from each other so im not sure which to key off of .
the cash index to me is still important
its june 23 high at 18188 may end up holding yet its to soon to say
the july 20th high though at 18137.12 id still like to see taken out
at the least intra day .
combining everything together i view the dec 9-dec expiry a critical time frame
for a minimum short term peak .
the drop that follows cant be calculated until i see where that top comes from in terms
of price .
nuff said for now .
Joe
The 2000/2007 angle gives 11/29.
The 5/20 – 8/23 angle has on 270 degrees 11/29.
The 1867 low 8/24 has an angle of 351,8 degrees. Add 351,8 to the vernal equinox and we get 3/5/16. Midpoint 8/24/2015 – 3/5/16 = 11/29.
So 11/29 seems to be a very major cit. This is Sunday. So either Friday or Monday.
This weekend we have the Sun conjunct Saturn; both square Neptune. Should provide the final low in gold and oil/commocities.
So I really expect the turn to come on Monday, with equities down, dollar down, gold up, commodities up, euro up.
Thanks Peter and Andre for all your insights.
I was just wondering how this next down waves fits to the cycles Peter last time posted. The cycles pointed to a bottom for the 9th december 15 and than up into sommer 2016. This is kind of conflicting. It the cycle should bottom on the 9th dec than the EW count must be wrong or do I misunderstand something. Thanks for any explanation here.
Best,Jaze
Jaze.
Don’t mix up cycles with Elliott Wave. They’re completely different. Nothing has changed on the count. The next major move is down. We’re simply waiting for the cash and futures markets to tag the previous high. All the currencies are near bottoms. It’ll happen very soon. Timing right now is the only issue.
The 5/20 high at 2134 has an angle of 168,3, predicting a low 9/4. So I see 2 possible issues : a) the august low came early ar b) the 2134 price had a little overshoot.
As I think the real low was 8/23, the high price was a a few point too far. This would implicate we have really witnessed a triple top around 2130-ish with 3 failed attempts by the market (5/20, 6/22, 7/20) to break this. Chances it will be broken now are remote.
This supports the idea the trend is down; for years to come.
To answer Jaze; I don’t think that is what Peter suggested. I see a low 12/15 but this is just a retracement in a downtrend. Same as march 2016. This may cause a retrace into may/june, but only to resume the downtrend again.
At least; that’s what I think. I’ll let Peter do his own thinking 😉
Using the S&P birthdate and the 1982 bearmarket low, we get new crash angle.
The first date was 2/20/2009 and caused the major reversal. So this was not caused by central bankers! It was just a square of nine. The 6th date reads 10/14/14 and created also a major reversal. The seventh date is 12/24/15.
This date will surely be tested. So down from 11/29-30, into the 12/15 HC venus 90 Saturn (also gave 8/23 low), up into 12/24 when the downtrend will get more energy.
So the 2000-2007 angle gives 11/29 and the S&P crashangle gives 12/24. This combination of magnets explains why the market refuses to really tank.
So the trend is down (triple top; see above) but the market is waiting for the chance to go down. I expect volatility to pick up and volume will return. This weekend is significant. But there will be one last desperate pull back into 12/24 before all hell breaks loose.
Just my thinking – no trading advice 😉
André,
I’ve been thinking about this inaction.
This is an extraordinary time. All the markets are moving as one based on debt. This is more a physical reality right now and it’s all based around the dollar. When the dollar moves, the currency pairs will move and so with the equities. I think the trigger is going to be the ECB because everything is tied together based upon debt and credit. It’s possibly why neither traditional cycles or astro events are having their intended effect.
Any astro event has to move “the world,” not only a portion of it. From as EW perspective we’re down to days.
Looking at currencies, they all just have a portion of a wave left to go. In fact, euro/dollar may have finished its ending diagonal and may just be waiting for the up move. I see this whole thing teetering on the edge now.
Peter—This is nothing more than a financial hologram….once the confidence in the power source is gone …the whole mess disappears. “At some point a grain of sand will descend upon a finger of instability in the sand pile and cause a collapse. No one knows which grain of sand will trigger the crisis of confidence and loss of trust. But with a system run by thieves, miscreants, and scoundrels, one of these villains will do something dastardly and the collapse will ensue. Ponzi schemes can only be sustained as long as there are enough new victims to keep it going. As soon as uncertainty, suspicion, fear and rational thinking enter the equation, the gig is up.” Jim Q
“Algorithms may have more emotion in their code than their creators and central bankers expect!! David Barker
Gary (Denver)
Well, I can’t argue with any of that. 🙂
I don’t want to mislead with my previous comment on truncation. There’s only about a 1% chance that we won’t tag the previous high. That’s that this “wandering around” is all about. I suspect, though, that it will be on a spike, which might result from an announcement of some sort … either ECB or Yellen perhaps.
Currencies also have to properly bottom.
Hi Andre
If Primay wave 1,2,3 ended on May 11 2011, Oct 4 2011, and May 20 2015, could you please tell us the 2,3,4,5th touch of your new spx angle ? Thanks!
Peter
I’m in agreement that it is becoming a matter of days ,I think it will be the shorter time counts or cycles that will be the trigger .
Andre I’d like to mention your Dec 2 date as well as you Dec 24 date in regards to the moon .
Dec 2 is the 3rd qtr moon ,since March 13 2015 there have been 5 meaningful 3rd qtr market turns .4 have been lows
the last one on Nov 3 was a high ,4 out of 5 have Bern lows ,as for Dec 24. the full moon on Dec 25 is important
there have been 9 trend changes so far on the full moons this year 5 lows, 4 highs as I see it so it’s important but it’s a 50/50 slipt as to it being a high or low .
Dec 11 is the new moon , so far since May 17 7 trend changes ,5 highs , 2 lows , hence Dec 11 favors a high yet that is subjective .
the 1st qtr moon tends to rhyme with the full moon .
5 1st qtr /full moon trend changes June24-July 1 high
Aug 22-29 low, Oct 20-27 low,Nov 18-25,high,?
Dec 18-25 is next .
bottom line to keep it simple ,I’m focused on Dec 2 3rd qtr moon and guessing it’s a low and the new moon Dec 11 as a high ,the rest of it I’ll let the market decide .
I think Dec 11 will become a huge change ,what market it effects remains to be seen .
back to work
Joe
Ref my obsession with the $. I just see a giant bull mkt in process and we just started a bunch of threes after a 9 month correction. Your count looks good, so what is my alternative. What you are calling 3 is possibley a 5 and we have finished or close to finishing a running correction. In your update I hope you mention the Shanghai $ssec and the gold late breakdown on Friday, real or fake?
Kent,
I’m not sure it there’s a question in here. Gold is in an ending diagonal, which I flagged a long time ago. We may have another little drop, but it’s all but over. If you read goldbug stuff and you’re a contrarian (which you have to be in trading, because if everyone is negative on gold, which they are—daily sentiment is in single digits, it means they’re all short), then you would be thinking “long on gold.”
All you have to do it look around the market to get answers to most of your other concerns, I think.
In terms of the dollar, I’ve stated my position several times. And the currency pairs should be your backup. Hard to dispute the ending diagonal in the euro and all the other majors have already turned up (and the pound has come down in 3 waves, so it looks like we’re heading back up to the top on that one—to complete the last leg of the triangle—really nice pattern shaping up there. I’ll post this chart in the current post).
A hard rule in EW is that a second wave correction must at least retrace 38% of the previous motive wave and neither the euro or dollar have done that. Now, if the dollar does a double top at about 100.37, that likely means it’s going right back down to the previous low (because it creates a larger wave in 3). It could also be in a fourth wave, but the indicators certainly don’t back that up (and neither do the other currencies, of course).
I have no question as to the direction, it’s the timing that’s the issue at the moment. I’m not planning on an update, as there’s really nothing to update until something actually happens. Hope this helps a little bit, anyway.
I wouldn’t rule out a truncation here. This market is struggling.
It’s rare, but it certainly could happen.
Thank-you for the answer. $ apears very wedgey. CRB was at 1976 prices. The COT however, is still bearish. Cat on a hot tin roof.
Peter,
You have told once that the waves should have some kind of correlation in terms of there duration too.
Should the fact that this supposed Fourth wave lasts already much more time than the previous waves influence the count ?
Dmitri,
There’s a somewhat complex answer to this question. I think I was referring to second and fourth waves. The entire wave needs to have the “right look,” meaning the second wave can’t be bigger than the fourth wave. In a motive wave, if the second and fourth waves get out of balance, the wave turns into a ‘3.’ There’s nothing in what’s happening at the moment that’s setting off any alarms in either cash or futures.
SPX and DOW are tracing out triangles at the moment, which tend to take time to develop. The short-term projection is up and we’re in the final wave.
Dmitri,
We might just get a top today … or tomorrow.
http://www.marketwatch.com/story/this-chart-warns-that-stock-market-investors-should-be-on-high-alert-2015-11-30
This website is for educational purposes relating to Elliott Wave, natural cycles, and the Quantum Revolution (Great Awakening). I welcome questions or comments about any of these subjects. Due to a heavy schedule, I may not have the time to answer questions that relate to my area of expertise.
I reserve the right to remove any comment that is deemed negative, is unhelpful, or off-topic. Such comments may be removed.
Want to comment? You need to be logged in to comment. You can register here.