
Update Friday, March 18, Before the Open
We look like we’re completing a very small wave 5. I would be looking for a top this morning and by the looks of things, it may be within the first hour or two, if not immediately.
Each of the waves in futures this morning are tiny and each successive one appears smaller than the last.
_________________________
Update Thursday, March 17, After the Close
The vigil continues ….
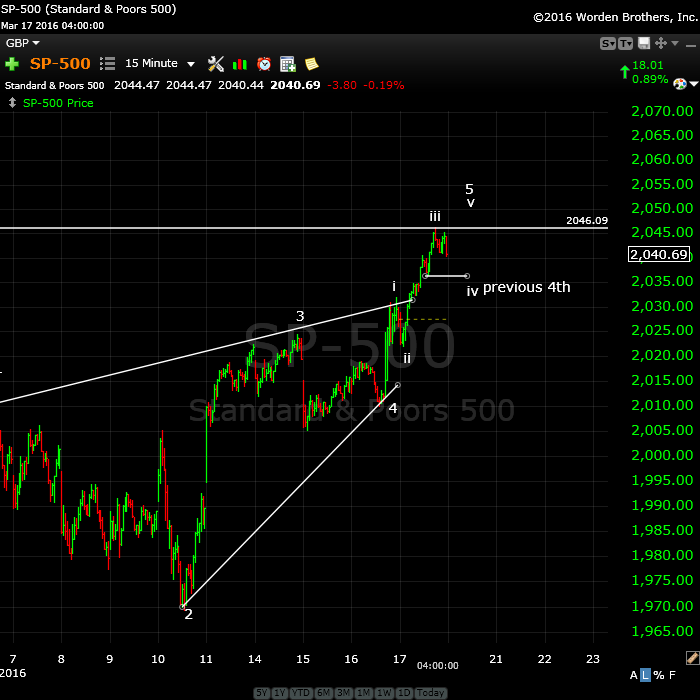
I know this is making us all crazy, but we’re really, really close. Above is a 15 minute chart of SPX. Looking closer at this final wave up, it appears after all to be not quite complete. The wave down in the afternoon is not motive and it seems to me that we have a 5th wave up to go. I note that the third wave up in SPX (wave iii) is actually much shorter than it should have been under the above count (it’s about the same length as the first wave (wave i). It’s actually just a little longer.
So the waves are progressively getting shorter, which often denotes an impending top. I would expect wave 5 then to be short.
I note that IWM (Russell 2000) is one dollar away from its target of $110.00, so this adds credence to the need to a further small rally.
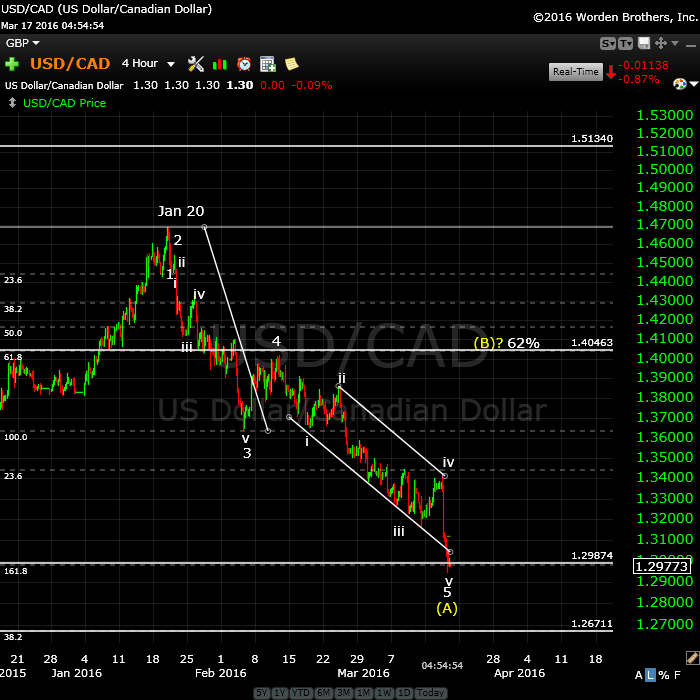
Above is a 4 hour chart of USDCAD. I have been watching this first wave down unfold and last night, it met the target. The wave measures and numbers as a first wave (and A wave in this instance). It has retraced right to the area of the previous fourth. It should now correct to the 62% level in a wave B.
_________________________
Update: Thursday, March 17, 1PM EST
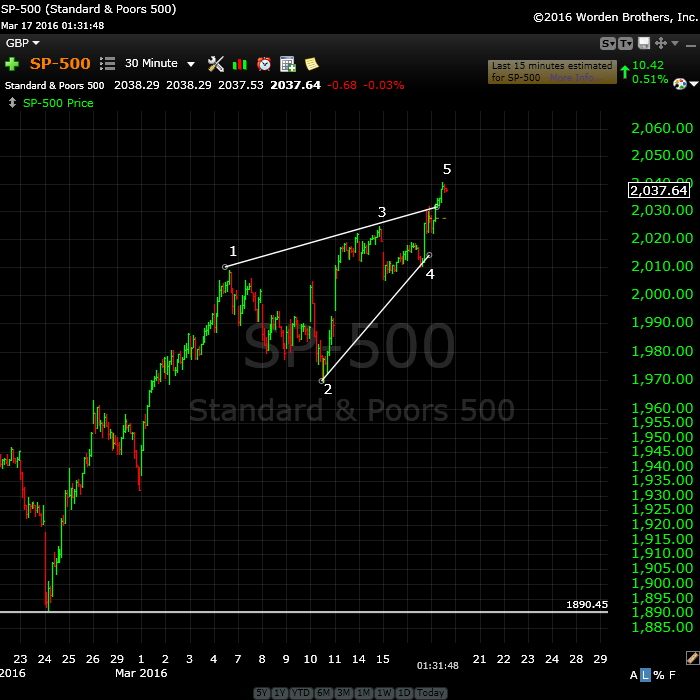
Above is the 3o minute chart of SP500 so you can see the ending diagonal formation I mentioned a couple of days ago. It’s now almost complete.
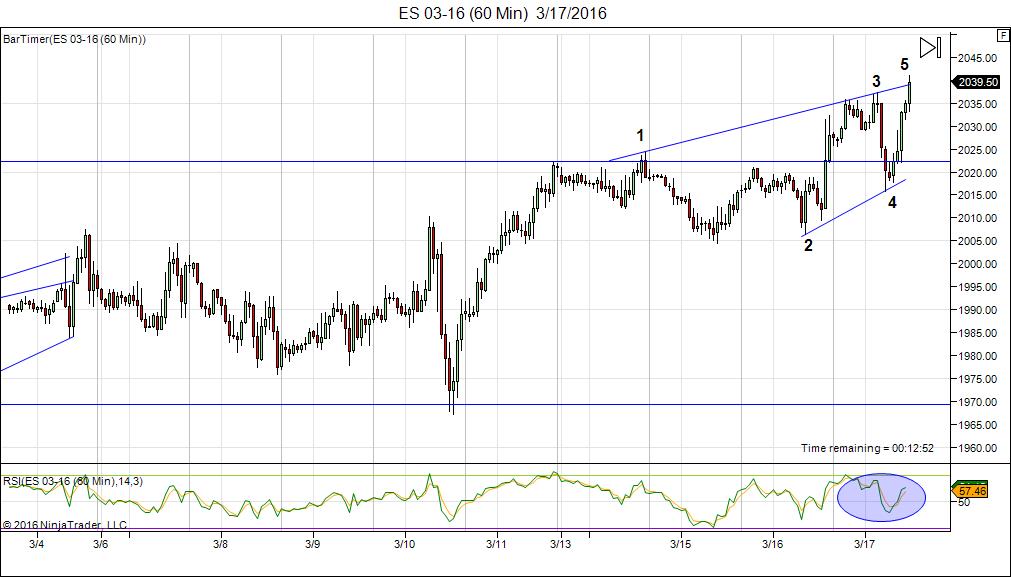
Here’s the pattern I’m seeing in ES (60 min chart). This is the ending diagonal I mentioned two days ago. It is just about “played out.” We’re in the final wave. I circled the obvious RSI divergence at the bottom of the chart.
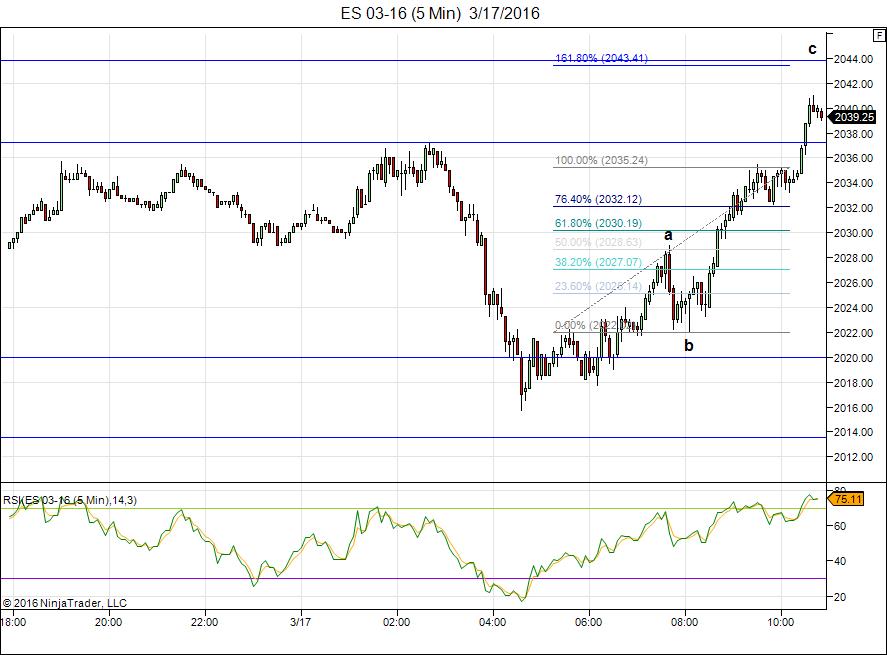
Here’s the 5 minute chart of ES. In the C wave, I can almost count 5 waves up with one more small wave to go. This gives me the target of 2044.
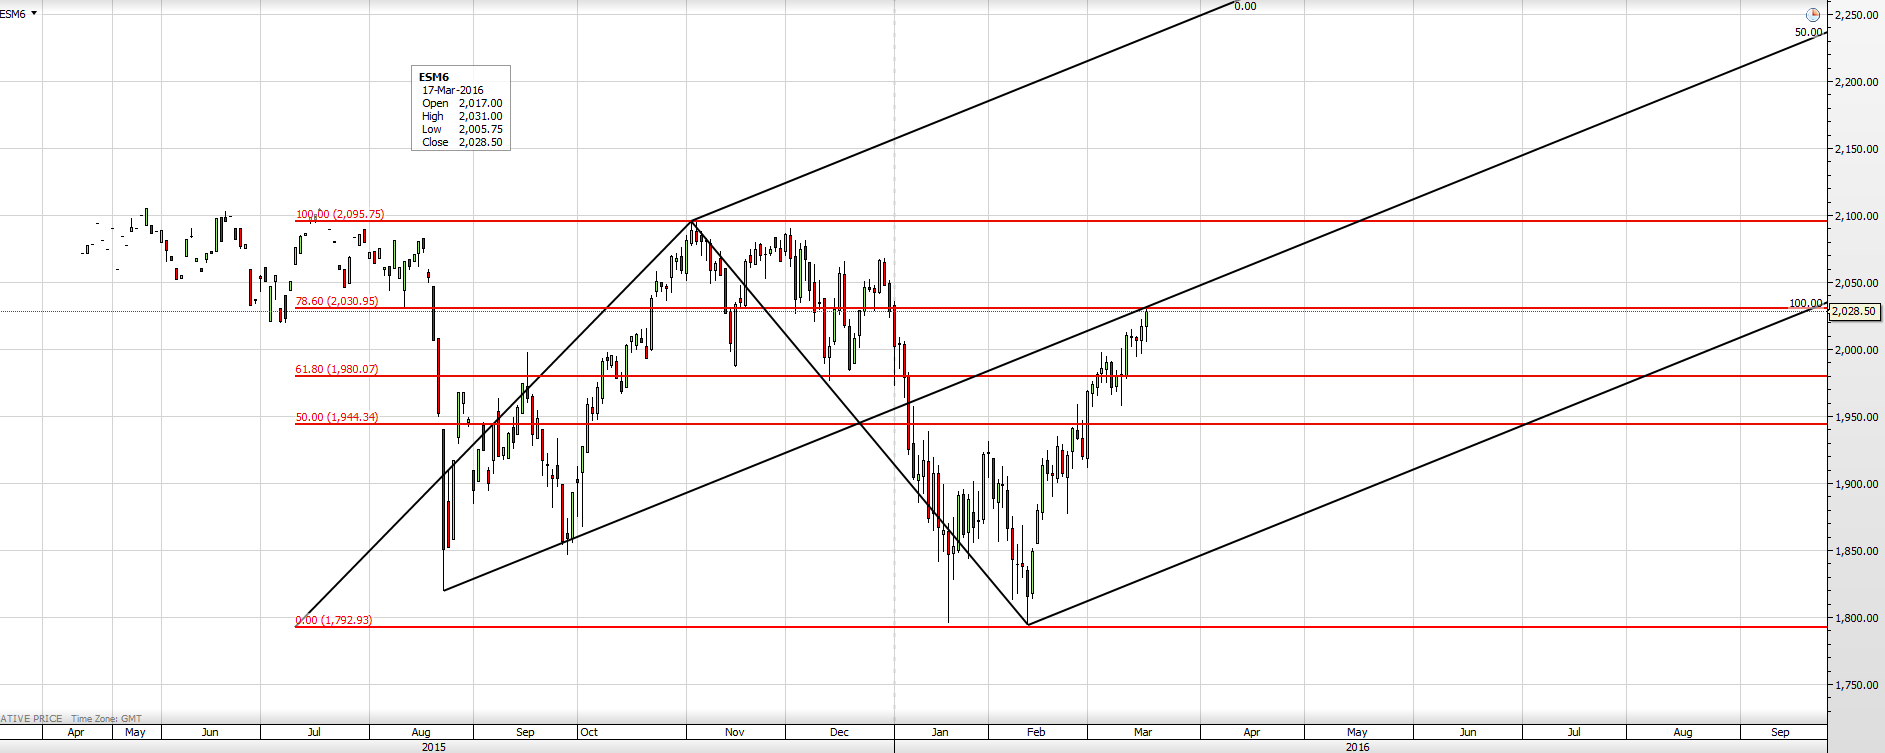
Above is a daily chart of ES courtesy of Mr. Fork (AZ). You can see Andrew’s pitchfork pointing to a turn just about where we are, so this is a different perspective that points to the same result: A turn in the next few hours (I think likely today).
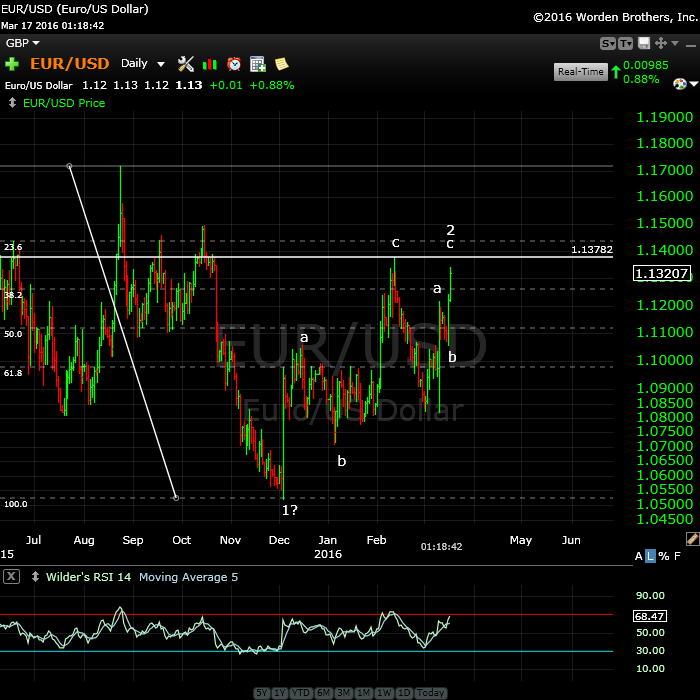
I’ve turned neutral on EURUSD. Here’s the daily chart of EURUSD showing the waves up over the past few days that are not motive so far. I was expecting the motive waves to continue, but this flashes a warning. We may have gotten as much as we can out of this pattern.
I have an issue with the first wave down as it doesn’t look motive to me, but the current look of the second wave forming cautions that we may be changing direction. So I’d watch for a double top with the previous 2nd wave spike and then a turn down.
________________________
Update Wednesday, March 16, 1:30 PM EST
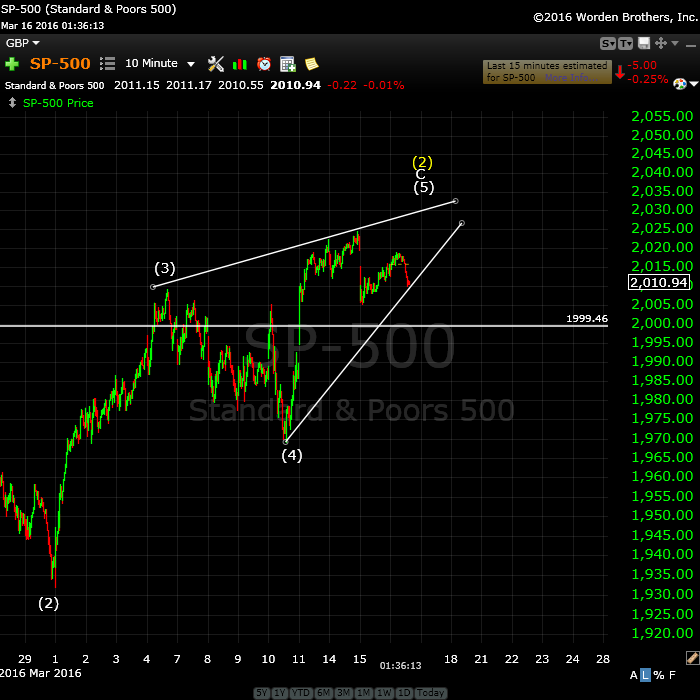
Above is the 10 minute chart of the SP500 showing the revised ending diagonal just ahead of the Fed announcement. It’s calling for a spike up to finish the pattern and the entire wave up. Whether it turns down today or tomorrow morning is the big question.
Update Wednesday, March 16, Before the Open
Scary looking charts in futures this morning (if you’re a bull).
I think what we’re going to see today (the most dramatic part is likely to be after the 2PM EST announcement) is a final wave up and a reversal. And by the way, it doesn’t matter what she says. Anything will disappoint.
The reversal may or may not come today, but we’ll certainly see it by tomorrow morning. I will post the EW preferred entry paragraph below here.
This final wave up will end the ending diagonal I mentioned yesterday and all of wave 2 up. We’re heading down into wave 3 and I’ll post a path once I see where we end up at the high.
Here’s an updated trade setup in EURUSD I posted a few days ago.
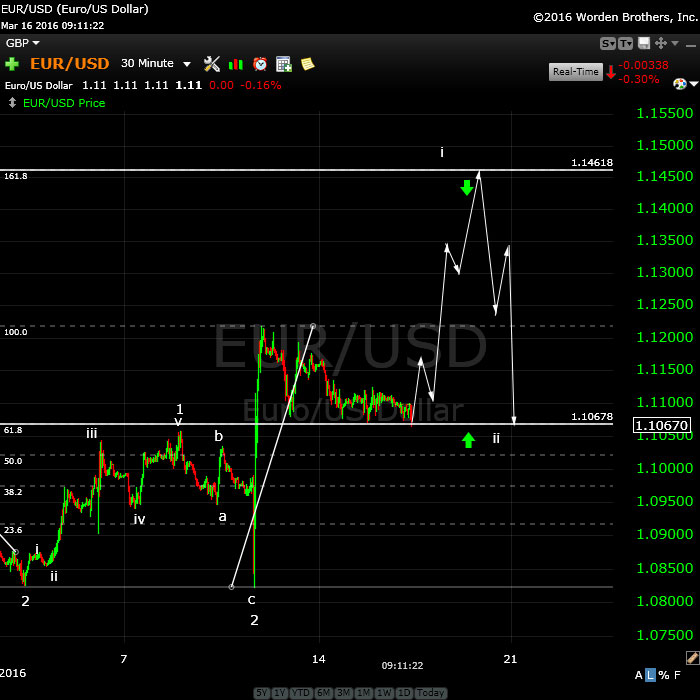
Above is a 30 minute chart as at this morning of the EURUSD showing the first part of a wave i up and a 4th wave retrace to the 38% level. It should head up when we get the reversal and the path after that is shown. Once it retraces to the smaller wave ii area, it will head up again in a large wave 3.
These moves should mirror the moves in the US market, but reverse (just like a mirror 🙂 ).
We’ve been sitting for a couple of days waiting for the US market to move, as you can see.
NOTE: The only issue I have with it is that this “fourth wave” it’s in now has taken a very long time to form and so this could end up being a corrective wave, so be careful if it moves down from here to any great degree. The larger trend appears to be up. I expected it to turn back up a couple of days ago, though.
___________________________
First Wave Down – What to Watch For
Tonight we’re dangerously close to a top of a second wave (in some cases, a 4th wave).
Let’s look at the SP500. When we turn over, we should drop like a stone. A good index to look at in terms of what motive looks like is IWM – perfectly formed motive waves.
The first wave down will be in 5 waves and will likely drop to about 1890 SPX (previous 4th wave). After that, we should get a second wave that will retrace in 3 waves to about 1958 (62%). That’s the preferred EW entry point. So don’t feel you have to rush in. There’ll be a much better opportunity at the second wave level than at the top and the risk is substantially reduced.
______________________________
Update: Tuesday, March 15, 2:15PM EST
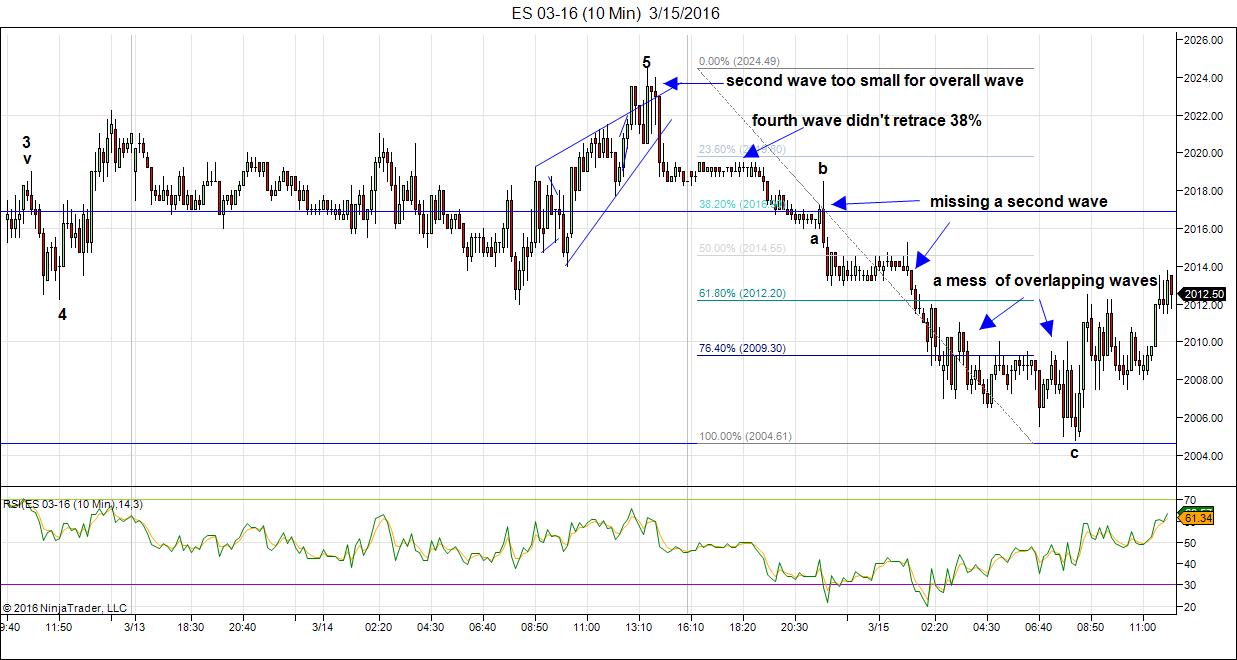
Above is the 10 minute chart of the ES (SPX futures). It shows the wave down last night and the things that jumped out at me when I analyzed it to figure out if it’s motive. It kinda has a motive look to it to the untrained eye, but it has a lot of inherent problems.
Elliott used to talk about the “correct look.” He meant that the key corrective retracements (second and fourth waves) have to look balanced. In this case, there’s a very tiny second wave that isn’t “balanced” with the rest of the wave. It’s way too small.
The fourth wave has to retrace 38%. This one hardly moved off the ground.
The third wave always has a motive set of waves within it, but in this case there are obvious second waves missing. When you have a sheer drop after a spike, it usually means it’s not a motive structure.
Finally, the mess at the bottom has no defined 2nd or 4th waves and it’s not an ending diagonal, which has a very particular structure to it. So what this tells me is that it’s a corrective wave.
So … one more time to the top, and then down for good.
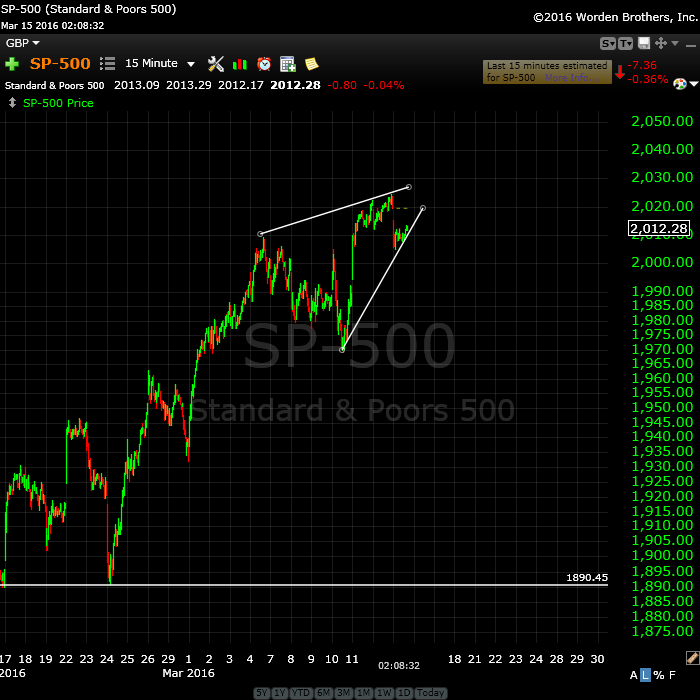
Above is the 15 minute chart of the SPX, showing the C wave up and the five wave structure within it, although I haven’t labelled the waves. You can look at the two charts below for all the labelling.
What I see here is another ending diagonal on a much smaller scale. The reason I went looking for this is that I mentioned in comments that the wave up this morning was in 3 waves … everywhere. If we’re going to a new top (or a double top), that would be an ending wave and should be in 5 waves. However, it’s not; we have waves in 3. So, that leaves only one option—an ending diagonal.
And when I backed out the chart, voilá, there it is! So expect a new high in a fifth of a fifth wave, but I can’t give you a target end number. However, when it stops (it shouldn’t go very far), it will end with a dramatic reversal. They always head for the start of the pattern (in this case, 1969 or so).
We have a Fed announcement at noon tomorrow (Wednesday) so I would expect the drama then.
NOTE: Actually, waves in three in a fourth wave create one general option—a triangle. An ending diagonal is a triangle (one of several different forms of triangle). You find them at the very ends of major waves (a 3rd, 5th, or C waves).
_______________________
Update: Monday, March 14, After the Close
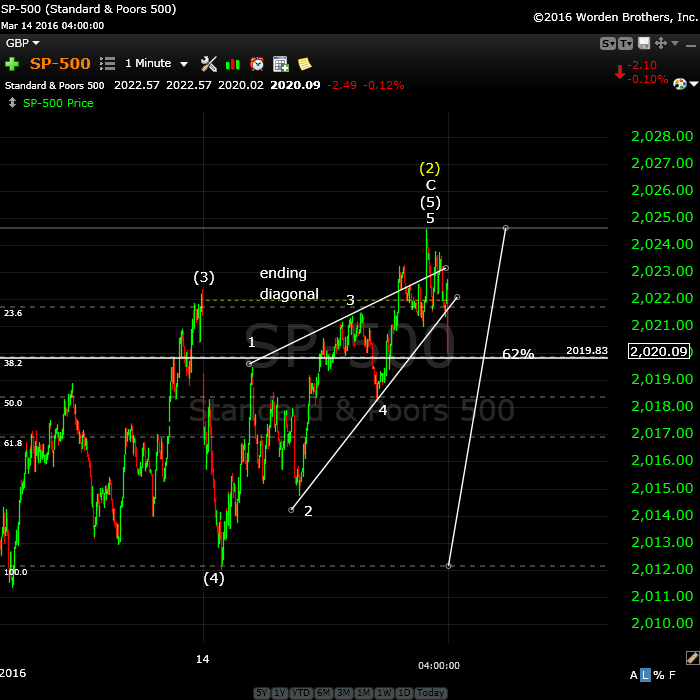
Above is the one minute chart for SPX for March 14 (at the close). The top appears to be in to me.
After five waves up, the trend changes, as I’ve been saying. We appear to be out of “up waves.” 🙂
We traced out an ending diagonal as wave 5 of 5 (the final wave) and we dropped through the lower trendline after completing a 2nd wave. So we’re on track to finish a first wave down, which should drop to the previous 4th (4) before retracing a second wave.
What’s interesting about the last minute drop in SPX is that it stopped right at the 62% level. I always look for clues at the end of the day as to what might happen tomorrow. The clue here is that if ES completes a first wave down tonight, when it retraces a second wave in the morning, it will end at the level the SPX ended at tonight, completely filling any gap that might be otherwise formed.
I don’t know if that will happen, but the possibility is there. There is an option that ES could do a double top tonight, but with the 5th wave seemingly already complete, it should not go up any higher than that.
Breadth and volume were negative today.
IWM (Russell 2000) completed a double top to a second wave today. It looks like it’s already completed a motive first wave down.
Note that EURUSD appears to have turned up. It also completed (or almost so) an ending diagonal. If it continues through the upper trendline, then this would suggest to me that the US indices will continue down from here.
__________________________
Original Post: Sunday, March 13, 2016
The Larger Count is Down
As I’ve been saying since May 20th of last year, this is a bear market. The larger count is down.
Now, there are still a lot of skeptics—both on Elliott waves and the idea that the market is heading down—that view this blog. It honestly beats me how, with the record I have in forecasting this market, how they can still doubt every single count and be proven wrong over and over again.
However, I guess that’s human nature. It’s why people get slammed every time we fall into a major depression. Elliott waves, analyzed properly, is how the market moves. Coupled with Andy Pancholi’s cycles analysis (the best I’ve seen anywhere), you have the holy grail in trading. The major cycle turn date coming up is March 14/15.
I’m in the midst of reading “The Secret Life of Real Estate and Banking” by Philip J. Anderson. I’ll get it added to my reading list before the weekend is done. It’s a fabulous book that documents the ups and downs of the American economy from the early 1800s through about 2007. It’s an eye-opener in terms of the role of inflation, deflation, and real estate to any “free” economy.
Fiat currency, credit expansion, and fractional reserve banking are, of course, the biggest culprits leading to an eventual lack of confidence and ensuing crash. This pattern happened over and over in the 1980s and into the early 20th century. We just never learn.
Well, here we are again. But this time, we have the largest credit expansion in the history of the world. Coupled with a major cycle downturn, the forecast is bleak. (I have a video ready to mount on “Global Cooling” which explains the larger climate cycles and why we should be concerned about this one. Look for it later today or Monday.) So far, it’s on Youtube only.
I have an interview coming up in a week or so on trunews.com on this subject and I’ll update you when we get a little closer.
The best TV right now is the US election. If you think the political landscape in the U.S. is particularly negative now, just wait a few months … the coming downturn should change just about everything.
We’re about to top again and this time, there will be no question as to where the markets are headed. However, there are those who will expect a turnaround and a new high right to the bottom. It happens every single crash cycle.
Time to start getting prepared …
Here’s a video overview of the market for Monday, March 14:
Market Report for March 14  |
 |
Make sure you zoom the video to full size with frame expander (arrows) in the bottom right hand corner and also set the quality to as high as your web connection allows. This is an HD quality video so the best viewing is at that level. |
_______________________________
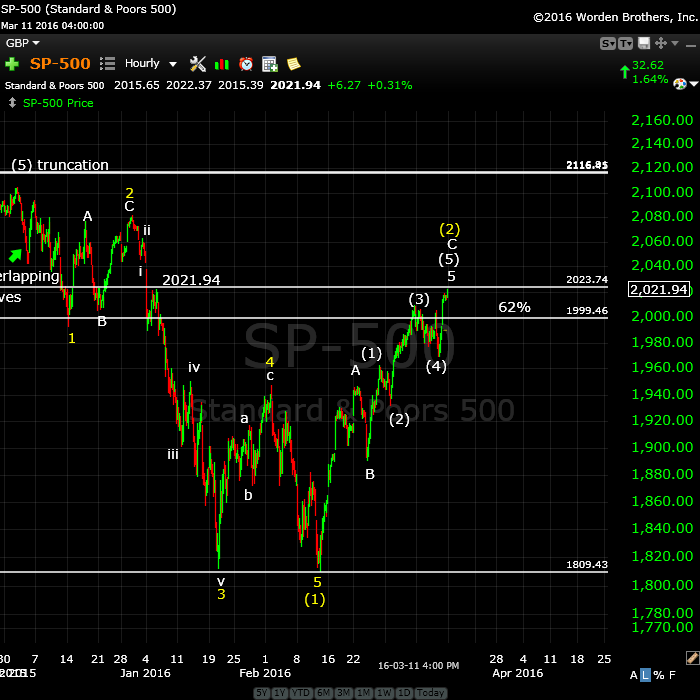
Above is the one hour chart of the SP500 showing the path from the top of the larger second wave on December 3 to the top of this smaller second wave on Friday. Five waves marks are trend change and we’re almost there. The most recent set of five waves makes up the C wave of an ABC corrective pattern that will send the markets to new lows.
We’re not quite finished. We have a small 4th and 5th wave of the 5th to complete (likely over the next few days) and then down we go.
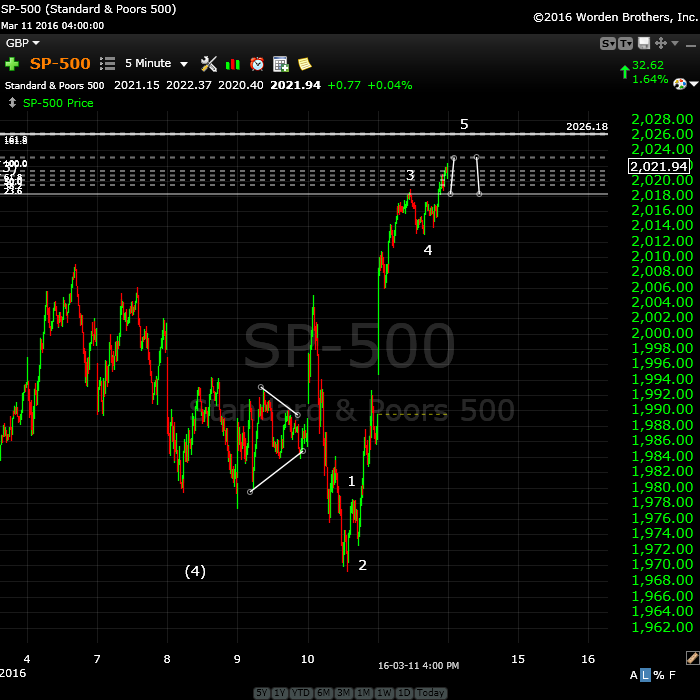
Above is a 5 minute (zoomed in) chart of the SP500 showing the structure of this final 5th wave. We’re finishing the fifth of that wave and the waves themselves are tiny. The end is very close.
The fibonacci tool shows the projected length of the last wave up. Now, this will depend on the depth of the 4th wave drop which will help determine where the final top tick end up. On the top chart, you can see there’s a previous wave top at 2021.94, which is exactly where this wave ended up on Friday. So the market might be signalling that an up and down wave will reach this same position and then turn over. We’ll have to wait and see.
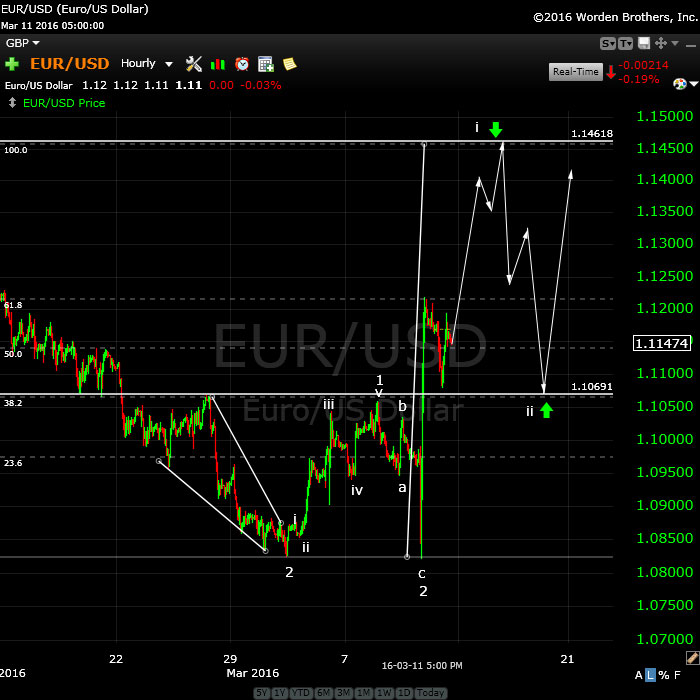
Here’s the one hour chart of EURUSD. I’ve drawn in the projected path. I would expect to see the completion of wave i (above) as the US market traces out a fourth wave and then the second wave (wave ii) in EURUSD to 1.10691 as the US market traces out its fifth wave.
This event would place them both at the beginning of third waves. Third waves are “no where to hide waves.” Either asset will would be a great opportunity.
Have a great week! It will be a volatile one.


Hello Peter,
Thank you again for the updates. Just looking at the SPX chart.
SPX High on 3/11 2022.37 is sitting just a little above SMA 2019.
Hi on 9/19/2014 – 2019.26
Hi on 9/17/2015 – 2020.86
Low on 11/13/2015 – 2022.02
Low on 11/16/2015 – 2019.39
Hi on 12/14/2015 pivot low – 2022.92 but rally failed
Hi on 12/21/2015 piv low – 2022.9 but rally failed
Hi on 1/5/15 – 2021.94 but attempt to stop downtrend failed.
LizH … very interesting.
Sorry, I forgot to put 200 SMA.
From the oct2014 low S&P rose 314 points into the 2015 high. When we add 314 to 5/20 we get 3/29. This is a major date to test as it represents squaring out of price and time. So one scenario is a low 3/23 and then a test up on 3/29. As it happens, april is Cardinal and will bring a massive vibration.
So, volatility will pick up, but the real panic will hit next month. I think.
André
This would be a cool scenario André! My dates for March were 5 / 15 (as you all knew) and looking at the end of the month, my system tells me 27/28! However, EW speaking we are very close to a top so somehow it is hard right now to think that we can go higher than the 2026. So in other words, we see the high tomorrow (2026± that is) or we go way lower than Peet thinks right now and later we will still see the 2026± to finish the C wave.
@Peet, your comment about people still doubting you, haha, +1. 🙂
Cheers,
W
On 9/1/2000, s&p set a high at 1530. Multiply that with 7.024 days (a week) and we get 10747 days ars 19,4 years.
The midpoint of this cycle is 5373. Add that to 9/1/2000 and read 5/19/2015.
This analysis says that the high of 2000 is dominant and that the 2015 high was not just any high. The midpoint of a 29 year cycle is a major event.
New analysis shows 2019 and 2020 are extremely sensitive years. And there is nothing in between to bring a low. So I agree with what Peter wrote above. And the best (worst?) is yet to come. I still think the real panick will hit next month with Pluto and Mars turning retro together (very special) and april being a cardinal year.
In my analysis july 2015 was cardinal. The high came in May but the august decline had to wait untill the cardinal vibration hit the market. Another square of nine shows that 2016 is a cardinal year, That’s why 2015 was so consolidating. Combined I see April will be the first real cardinal month in a cardinal year. Can mean only one thing.
André
typo 19,4 = 29,4
I agree, April is trending in the direction which we like best right!? 😉
P.s.
Doing the same analysis on the 2007 high we see that 90 degrees in this cycle (30,3 years!) gave 5/9/2015. So this was confluence in a 7,5 and 15 year cycle turning within days. It would be foolish to ignore this.
DJ 1929 set a high at 386. Price is time. 81 cycles further we get 4/11/2015.
81 is very significant as 9 is the end of any cycle. 9 squared is very strong. And this is a period of 86 years. Read this together with what I wrote above and weep. I know, 2+0+1+6 =9.
We appear to be very near topped in the Nasdaq and DOW. SPX is lagging. My timing in EUR/USD is all wrong. We did such a shallow 4th wave that nothing has moved yet, but we’re still completing the pattern, by the looks of it.
SPX and ES at a new high might seal it.
btw, sentiment was at 74% bulls on Friday, which is consistent with a top.
Be on the lookout for a top when SPX reaches the previous high. I count 5 waves up in the DOW. Nasdaq COMP may have already done a small wave in 5 waves down on a 1 minute chart.
I think SPX will struggle above 2000 until the FED on Wednesday and then will try to hold as high as possible until expiration of futures on Friday
This might not even be that crazy Dimitri. 🙂 A topping proces can take stupid ages… Even though I have 15 March as a turndate (as does Peet), it might just be the bottom of wave C.4 around 2000-2003. My turndate of 27-28 March might be more significant as André explained… We have to wait and see!
Cheers,
W
I think top this friday or next Tuesday after that we will see the Chinese monkey jumping again… after all this Chinese monkey year has a great reputation to fool around (lol).
https://www.youtube.com/watch?v=ksJ6QP8BYn0
I posted a chart of SPX and my thoughts.
Hi Peter
I think your wave count is correct .
from what im looking at though i see a few oddities that bear considering .
im down to a 10 minute chart but todays notes are the daily chart .
the jan 20th low is more important as its also the lows in the xau ( gold stocks )
the feb 11 low is the indicator lows in the dow . so both those dates are key dates .
jan 20 to feb 11 was 16 trade days , low to low to high would have been the march 7 high . yes that high did get taken out yet it was a low to low to high count .
going a bit further there is another correlation .
jan 20 plus 8 trade days is the feb 1 high
adding 8 trade days is the feb 11 low
adding 8 trade days is the feb 24 low
adding 8 trade days is the march 7 high
adding 8 trade days is march 17th ( Thursday )
thursday and friday this week will create a fibonacci time series .
dec 29 high plus 55 trade days targets Friday
jan 29 closing high plus 33-34 trade days = thursday-friday this week
feb 29 low plus plus 13 trade days = thursday this week
( the 21 trade day mark would be the minor high feb 17 )
march 7 high plus 8 trade days = thursday
the recent low march 10 plus 5 trade days = thursday
bottom line for me :
im looking for a high to get short and Thursday Friday fits
this implies this week as a topping week .
price is being and has been satisfied yet time is not yet finished.
This week is also an options and futures expiry and i tend to avoid them
for position trades , next weeks lunar eclipse i am keeping an open mind
at this point .
march 23 to april 7- 11th should be a powerful move
it looks like topping action presently .
Joe
Well, Joe,
There actually is a fourth wave triangle alternative that I’m attempting to make work for all the indices, but it’s a challenge. However, I’ll attempt to put it together and post it in the forum. It would mean that we’re going to go into a B wave down now. It should be relatively easy to figure that out (if we’re in one). Because it this is a third wave, we’re going to come down hard. If it’s a B wave, not so much.
It could lead to a new high but it would be near the end of the year, I think, and would likely need a new stimulus package to make it plausible. But I want to make everyone’s aware of any alternative that might be out there. It doesn’t affect the short term count.
I took a chance. Bought a few puts when spx hit a bit past 2023 just in case the puetz crash happens between the 16th and 26th.
We have very motive waves down in futures tonight. So far, my scenario for a first wave is playing out.
Yeah,
looks good
Yesterday lowest trading volume since Christmas.
I put a short blurb at the top. This should be a fourth wave.
Peter,
the fourth of what degree ?
I dunno. Pretty small wave. One degree lower than the leg up.
wedgies….
http://invst.ly/1c2pe
Hey Peet!
That is what I said, C.4 is underway and now we will be busy with C.5 until end of March / beginning of April. 😉 This topping process really sucks! I think we will top somewhere just below the start of the gap at 2037±. We will not close it, my best guess. 🙂
Cheers,
W
Not sure what your numbers mean exactly. We’ve finished wave 5 (or all but a final little top if there is one). There is no wave 6. This little wave you might consider as wave 5 of 5 up. Going back to the very first wave up, starting at about 1890, it puts the top (1.6 X 1) at the previous high, so EW tells me we’re all but done. We’re not likely to hang around within a 15 point range for a month.
So maybe you should use. C.5.5.
These are all SPX numbers.
Everybody’s headed up in 3 waves which isn’t helpful. Now we’re into Yellen territory, so there’s a good chance we could wander around for a bit. At some point, we’ll need to get back up to the top.
Peet!
You are calling it a fourth wave, that is what I am doing as well (C.4 of the 3.2 wave that started on 11/12 feb). Now we just have to wait until the C.4 wave is done to see if we are going further into the gap which started at 2037. I just do not want to see it get closed. 😉
Cheers,
W
If you’ve got 5 minutes and want something to do, I’ve just published my most recent video on “Global Cooling” which also shows the civilization cycles and why the economy is in such trouble from a high level cycles perspective … here: https://worldcyclesinstitute.com/global-cooling/
Thanks Peter,
It sounds very clear to me..
Peter,
Very convincing video! Thanks!
André
🙂
I added a couple of charts up top with my take on what’s happening (a little lesson on motive waves and what they don’t look like … haha).
As always very helpful. Certainly appreciate the annotation of issues with the wave down from yesterday’s high.
Thanks, the issue being that we don’t yet have a good motive wave down to show you what they actually look like (I’d have to go back fairly far to find one, since we’ve been in a corrective wave up for 7+ years … sigh). But I plan to keep this little exercise and I’ll post both the real one and this one there once we have one to show .. not very much longer, I don’t think.
377 Td from 9/19/14 gives 3/21
144 td from 8/24/15 gives 3/20
55 td from 29/12/15 gives 3/18
34 td from 2/1/16 gives 3/21
13 td from 3/4/16 gives 3/22,
The solunar model shows the turn the month should come between 3/13 and 3/20.
André
Hi Peter
im going to watch your global cooling video .
before i watching im just pointing out some things in regards to it from
my own research .
typically you will see an el nino which most claim were in right now
yet it isn’t confirmed . following an el nino you get a la nina .
when that takes place you look for drought like conditions in the mid west ( usa )
during the global cooling scenario the growing area in the mid west moves to
the south about 36 miles ( i forget the exact distance ) when this happens
the growing seasons get shorter and the area to grow gets smaller .
this will drive up grain prices ( wheat , corn , soybeans ) .
what i have yet to research is how this global cooling period will effect
the grain growing seasons in other areas of the world .
global cooling though is here and in a few years al gore can come out and
claim not only did he invent the internet but he also saved the world .
lol
Joe
All correct. The El nino cycle is 18 years, I think. I have that info here somewhere. In Calgary, we’ve had virtually no snow this winter. It dry, dry, dry and in fact, we’re in single and double digits every day (and this is March!).
Yes, expect commodity prices to rise, along with everything else linked to food. Major world-wide drought on the agenda.
Single and double digits centigrade, that is.
I haven’t been watching the market much the second part of the session. We’re retraced 62% in ES and done 5 waves up, so I would expect a B wave right about now.
ES and SPX are lagging everyone else, so I wouldn’t expect too robust of an ending wave from them (although, I can always get a surprise …)
http://www.zerohedge.com/news/2016-03-15/china-freight-index-collapses-fresh-record-low
Peter,
Thanks for the discussion and analysis above of what ‘motive’ looks like. I’ve struggled with it, wanting to apply the term to any move that doesn’t overlap. That may be part of it, but as you showed, there is more to the look. Just relying on not overlapping has gotten me in trouble by giving a false sense of a directional move, only to turn. You helped my understanding. Steve
Gann’s td system gives 4 strong dates this month : 4,7,20 and 25. Minor dates are 8,10,23,26 and 31,
3/20 is the equinox, the start of a new Gann year.
The volatility I expected is put on ice. But not for long. My tidal system says the top should come Thursday or Friday – at the latest. Combined with what I wrote above I think this weekend will seal the deal.
Thursday Jupiter lattitude extreme (also gave 7/20 high) and Friday Mars at 19.850 degrees declination. both long term – Multi month- astro timers.
So, relax, enjoy the weekend and prepare for the new year’s party.
André
144 squared is 20736 days. One 8th of this is 2592.
Add 2592 to 6-3-2009 and we get 4/10/16. As this is a long cycle, timing can be off a bit.
But this is yet another confirmation we are very close to a very significant turning point. This could indicate next vernal equinox will be one to remember.
Counting 2592 day cycles from the 1929 high we get 27-9-2007 after 11 cycles. The next one brings 11/1/2014.
This is is close to the 5/20 high and supports the notion the real trend turned by the end of 2014, causing october 2014 to give an inversion. This was the 12th cycle from 1929 or 1,5 cycles. Next stop 12/6/2021.
As 1 whole cycle is 8/8th, the first cycle ended 6/12/1986,
Let’s suppose the market feels both dates. Then 10/31/14 and 4/10/16 is one period. 5/20 came at 38,2 % in this cycle. Remarkable.
P.s.
Don’t think the market will be up into 4/10. But is could be a reason to test this date from below.
P.P.s.s. 20/3/16 is 21 days before 4/10. 3 weeks!. For Gann 3 was major.
p.s. 4/7 will be 180 td from 7/20 high. Likely date for a first low.
7/7/1932 was the crashlow.
One Uranus cycle takes 30865.5 days. Combined this gives 7/12/16.
As this is an extremely long cycle, a few months before or after is allowed. But it confirms we are living in interesting days.
And this could be one of the reasons the real crash hasn’t come yet. But it is very clear we are running out of time – fast. Near the end of such long cycle volatility should spike. I already told you April will be the first cardinal month in a cardinal year. See how it all fits?
Based on this analysis I don’t expect the Fed to raise interest rates. Soon they will be negative.
I like to read this Gann stuff since I am a hugh fan of him as well. 🙂 Thanks André!
Cheers,
W
Peter,
Thank you (again) for the site. It has become part of my daily (and intra-day) routine.
Do you recommend a review of Frost & Prechter before moving on to Elliott’s original work? Or is that book enough to get a good summary?
I read EWIs work for years. Chris Carolan was terrific. The others were lacking. In my naivete, I neglected to realize how much Prechter’s call from the year 2000 constantly tainted their outlook and objectivity. I also needed to learn that other tools help to understand where we are with the waves.
Anyway, thanks again for helping me regain some faith in the usefulness of using the waves for forecasting (and setting expectations).
Hi Peter
that was an excellent video on global cooling .
something i noticed in Jan 2000 was the ice in the Bering sea came all the way
down to unimak pass , ( i used to crab fish up there from 1982-2004 )
the last time that happened was in the 1970″s and we had just come out
of an nino back then . i remember saying back then ( i was new to the global cooling theories then ) we are going to have a la nina and there will be a drought in the mid west and grain prices would rise and probably a commodity rally was coming .
that is now behind us yet we did see one heck of a commodity boom following that
sun spot peak .
i find the subject fascinating
Joe
Andre
I want to thank you for your posts .
what amazes me is you and i come up with the same dates yet from completely
different approaches . something i was wondering about today is the republican
primaries and there end date for this cycle .
another thing you just mentioned is the end of 2014 as well as the oct 31 2014 date .
your posts definitely keep me on my toes , great work .
Peter, my thoughts to next week as a high ( or even Thursday – Friday )
i was a few days ago hoping to see it as a wave 2 high of some sort .
the march 23 date to april 7-11th date should be 3rd wave type action or
even C wave like action . this would imply a failed move going into that date .
im talking off the cuff here as i am up early going through my data and preparing
for my days trading ( if i see a set up ) data input morning for me to catch up
on my charts ( i use excel and base my decisions using the markets daily , weekly
monthly , and a 36 day chart , ( 36 trade days = 1 bar ) . i also use another set of data which i add up the major indexes . Everything is pointing to a high yet my gut
after the last failure says something is a miss . plan to keep my trading more short term rather than a positioning point of view until the picture clears .
the old style day trade stuff is 3 minutes before the fed announcement place
a sell short 90-100 points above the market if taking a bearish stance and on the news expect a spike then a reversal down . if bullish its the opposite .
time for my homework . i have not dug into the details for a few days and now is the time to catch up .
thanks for the update illl include it in my work
Joe
Thanks 😉
im talking about the dow in regards to the 90-100 point move
BPCOMPQ
https://twitter.com/allerotrot/status/709886205920419840
NYAD
https://twitter.com/allerotrot/status/709889840628760576
I posted a comment and a chart at the top of the page. There really isn’t a lot to say. We’ve been expecting today for a while. I’ll be around for the action later on, but I don’t expect a whole lot of action until “you know who” sings at noon EST.
Hi Peter
Just a thought here
Do you remember the dec 11 cycle low you were looking at last year ?
i find it correlating the the utilities , which by the way are testing the old
all time highs . they are also correlating with you march 14 turn date
( with in a day ) and today is a daily reversal down .
Just an observation.
Joe
I added a note above on the euro: NOTE: The only issue I have with it is that this “fourth wave” has now taken a very long time to form and so this could end up being a corrective wave, so be careful if it moves down from here to any great degree. The larger trend appears to be up. I expected it to turn back up a couple of days ago, though.
I just realized I’ve been saying the Fed announcement is at noon EST. No, it’s 2PM EST. (noon is my time zone, so apologies for any confusion.
2PM EST!
Hi Peter
My last post for the morning .
I re created your 15 spx chart from the other day .
this may or may not be valid but its worth looking into later in
the day today .
the jan 20 low on the cash spx at 1812.29 rallied 134.91 points
into the feb 1 high at 1947.20 . multiplying 1.618 to
134.91 equals 218.28 points . adding 218.28 points to the
feb 11 low at 1810.10 = 2028.38 cash spx.
taking it in simpler = moves .
adding 134.91 to 1810.10 = 1945.01 which was not far
from the 1946.70 high on feb 22 .
and again taking this 134.91 pt move and adding it to the 1891 low
on feb 24 would = 2025.91
simplifying this even more .
feb 11 1810.10 to feb 22 at 1946.70 was 136.60 pts up
feb 24 low at 1891 Plus 136.60 = 2027.60 ( cash spx )
feb 11 to feb 22 was 11 calendar days
adding 11 calendar days to feb 24 =was march 6th
11 calendar days * 1.618 =17.79 days ( 17-18 days )
feb 24 plus 17-18 calendar days =march 12-13th ( didn’t work Obviously )
Jan 20 to feb 11 was 22 calendar days .
22 calendar days plus feb 11 was march 4 a high but not the high .
22 *1.618 =35.59 days ( rounded to 36 )
feb 11 plus 36 calendar days =Friday march 18th .
hence C will = price in the 2025.91-2027.60-2028.38 range ( ave = 2027.29 )
tomorrow Friday March 18th 2016 . ( 31816 or reversed being 61813 )
anyways should be an interesting week next week .
short term ill focus on price today on the spx cash as well as the dow .
will see how this works soon enough
Joe
ps got to love that 1.618 time and price match
Joe,
Is your downside target also still valid ( around 16.200 for the dow)?
John,
It likely hasn’t changed by all that much, but as I said somewhere today, the target to the downside depends on where exactly we top.
I posted a quick chart of the SP500 showing the ending diagonal just before the Fed meeting. Expecting a spike up to finish the pattern.
rather “just before the Fed announcement,” as the meeting’s been going on for a couple of days.
3 down so far in ES and SPX, so I expect we’ll see a double top at the very least.
If we get 5 waves up in ES to a double top, that should be it.
My charts showing top should be at least
ES @ 2029-2030
SPX @ 2036-2037
AZ
I missed to say SPX price now is @ 2023
AZ
Yeah, we should get above the upper trendlines.
More likely now, we’re going to complete the ending diagonal pattern. If so, it ends when it ends.
This website is for educational purposes relating to Elliott Wave, natural cycles, and the Quantum Revolution (Great Awakening). I welcome questions or comments about any of these subjects. Due to a heavy schedule, I may not have the time to answer questions that relate to my area of expertise.
I reserve the right to remove any comment that is deemed negative, is unhelpful, or off-topic. Such comments may be removed.
Want to comment? You need to be logged in to comment. You can register here.