Update: Friday, Mar, 3, ~Noon
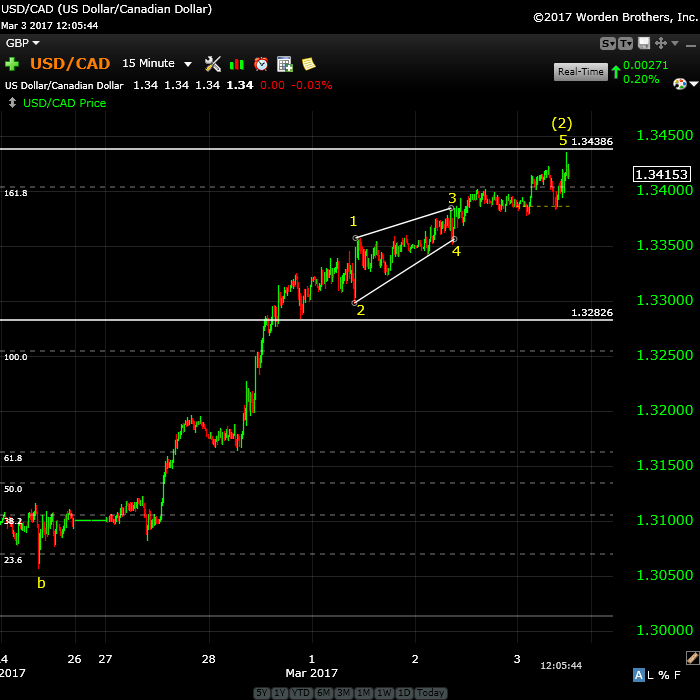
Above is the 15 minute chart of USDCAD showing the ending diagonal that formed yesterday. The 5th wave cannot be longer than the first wave, which gives us a drop dead top of about 1.34386. I also measure the A wave of the 5th wave to be the same length at the C wave of the 5th at about the same level.
Anything above that level is a problem and tells me this is not an ending diagonal and would be time to get out.
______________________
Market Update for Friday, March 3, 2017
Market Update for March 3, 2017 |
_______________________________
Market Update for Thursday, March 2, 2017
Market Update for March 2, 2017 |
_______________________________
Update: Wednesday, March 1, 9:45 am EST
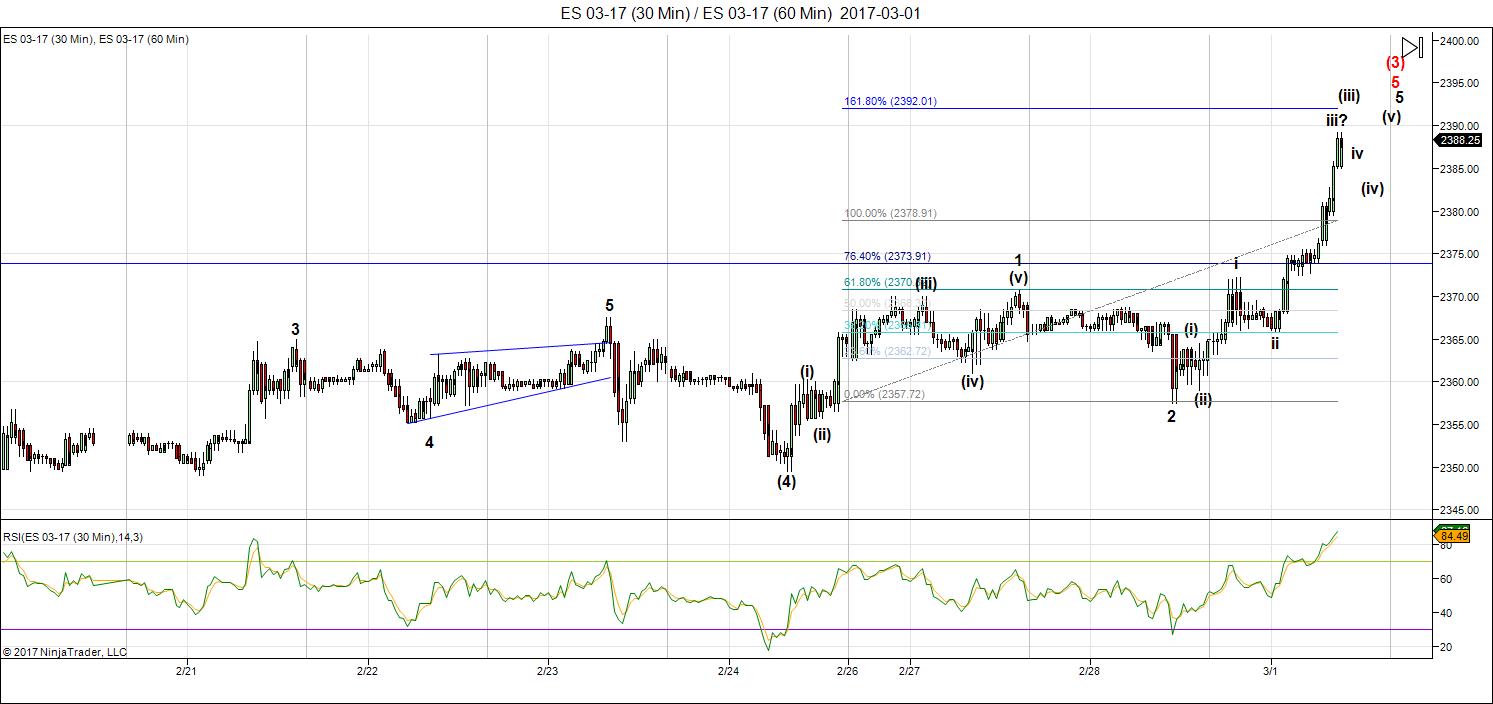
Above is the 60 minute chart of ES (revised from earlier). Last week, I mentioned I had one nightmare scenario for ES that measured to 2380, but I didn’t think we’d get that far. That as under an ending diagonal scenario.
And although this pattern started out as an ending diagonal, it has morphed into 5 waves. Wave three extended to five waves and so is now labelled as wave one. The current wave we’re in looks to be wave 3 and I have no end in sight at the moment. I’ve attempted to label it but these labels will change as it progresses.
Maybe the US market is going to do one gigantic blow-off. Currencies are already in their wave 4’s with USDCAD and EURUSD nearing a turn into their final wave.
It’s extraordinary.
USDCAD is close to a turn target. Currencies pairs are not in any way aligned with each other anymore.
_____________________
Market Update for Wednesday, March 1, 2017
Market Update for March 1,2017 |
_______________________________
Market Update for Tuesday, February 28, 2017
Market Update for February 28 2017 |
_______________________________
Update: Sunday, Feb 26, 9:30pm EST
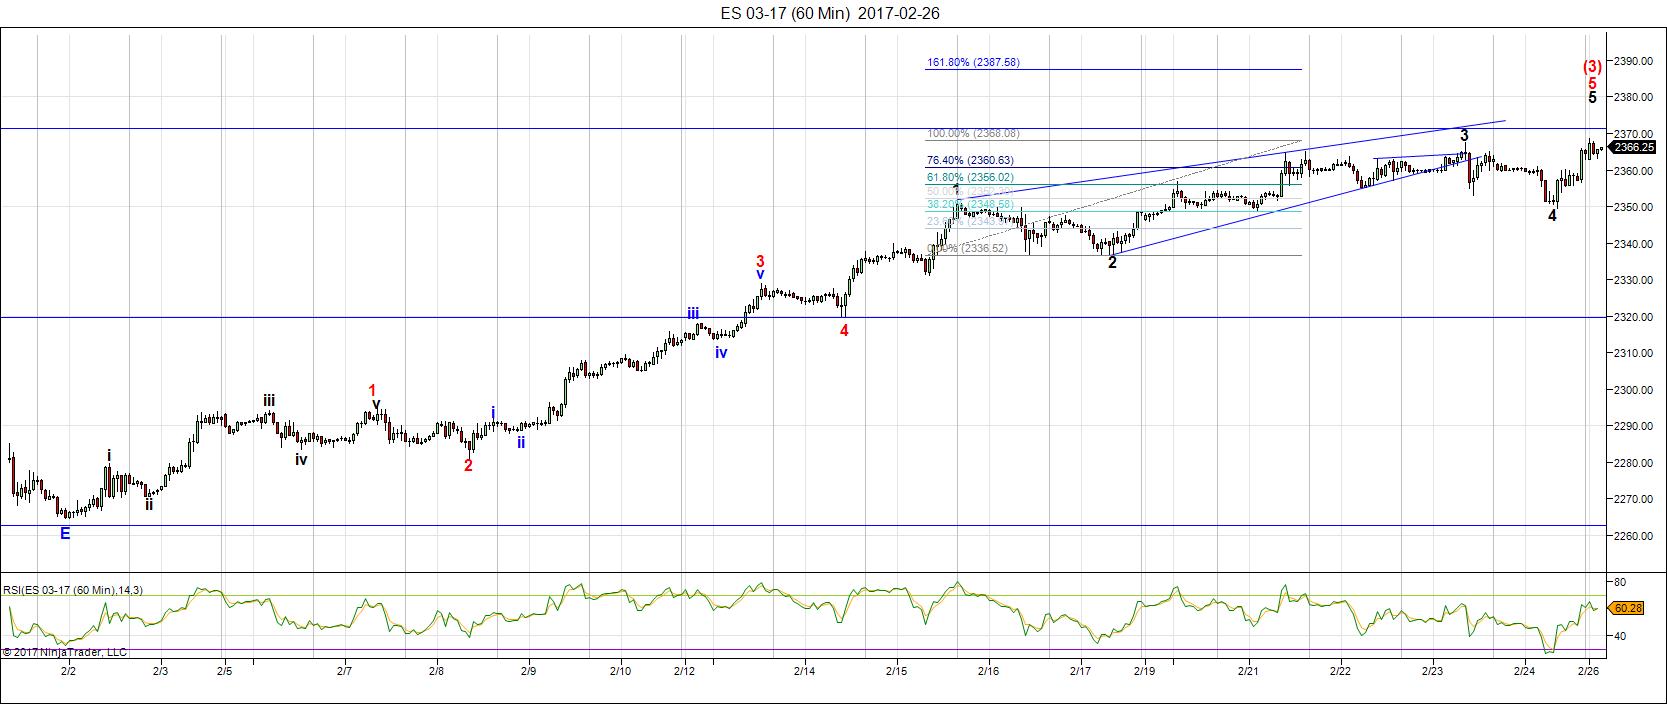
I’ve found an alternate ‘worst case’ count for ES, which negates the ending diagonal and shows this last wave up tonight as the fifth wave of an extended fifth. This is the 6o minute chart of ES. I can measure a worst case high of 2380, but the waves up are starting to get shorter than they should be, so I suspect we’re likely looking at 2375 or so if SPX is in the ending diagonal I’ve identified.
This is the final wave either way, but the structure of the last part of the wave up in ES is questionable. It’s simply not all that clear, partly due to measurements not conforming to expectations.
______________________
Original Post: Now that we have a top forming in wave 3, let’s take a more intimate look at what a first wave down looks like. We may see this configuration here; we’re certainly going to see it at the very top (after the final blow-off wave). I’ll re-post it then, for sure.
First waves are typically different in their configuration that a normal motive wave in 5 waves. They’re hard to discern, as all the waves need to be present. If they’re not, you’re looking at an ABC wave that’s going to retrace right back up to the top.
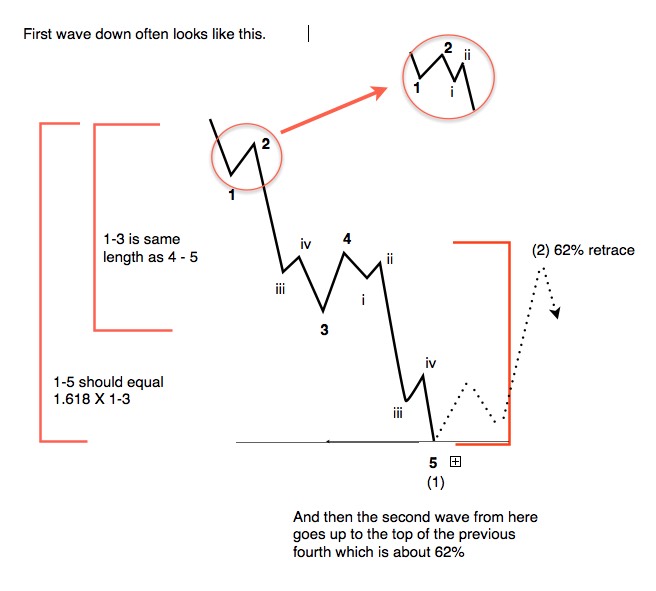
Above is an example of a typical Elliottwave first wave down. From a “big picture” perspective, you can break this wave down into two major waves. There’s a wave that comprises the 1-3 subwaves and then another wave of equal length that captures the waves 4 through 5. Of course, there are subwaves along the way. The 5th wave down (from 4 to 5 on in the diagram must have 5 subwaves). The third wave also must have 5 subwaves (I’ve included an inset circle to show the small wave i and ii of the third wave, as these can be quite small), and the first wave should have 5 subwaves, but they may be too small to make up properly.
So this is ultimately what we’re looking for in terms of a first wave.
The first wave should bottom at a previous 4th wave (of the final wave up in the opposite direction). The wave on Friday did not do this and raised a red flag. However, the wave down in the NYSE looks much better and so that caused me to caution that we second wave up might go much further up and to wait for the turn. Now (after more analysis), I think a slight new high is in order)
In general, once the first wave down is complete, look for a second wave up in three waves to at least 62%. Wait for the turn. This is the least risk entry for a short from an Elliottwave perspective.
Now, keep in mind that we could get a flat forming, which would start with a wave in three waves (just to complicate things), but with an ending diagonal in ES and now a possible ending diagonal in SPX, I would bet we’ll get a wave down in 5 waves. Ending diagonals turn fairly dramatically and head down to the very beginning of the ending diagonal, so this suggests a strong wave down (most likely in 5 waves).
The wave on Thursday/Friday shown below was a possible first wave down (it’s close) but it has problems, the biggest of which is the fact that it didn’t come down to the previous fourth wave. Once I had a chance to drill down to a one minute chart, it began to look less and less like a first wave and more like we might have a triangle of some sort at work (as I explain in the video).
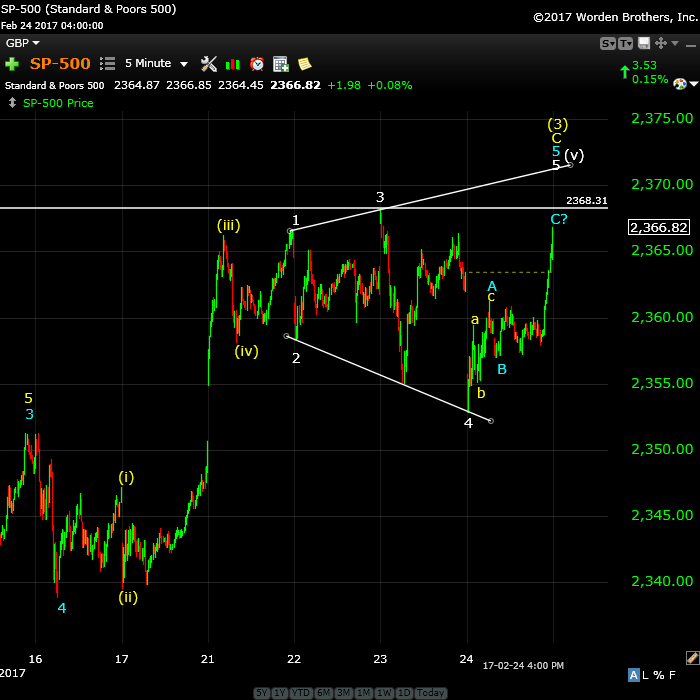
Above is the 5 minute chart of SP500 shown in the today’s video. I’m showing here my preferred pattern. I think we might just have an expanded ending diagonal in SPX. If we do, this is a pattern that’s about as rare as they come. I’ve never seen one and I don’t know anyone else who has.
If it is, it should hit the 2372 area and immediately reverse. ES already has an ending diagonal, so I’m not expecting anything more there than a double top or another point or so at most above the previous high.
I’m still projecting a final top to our five hundred year set of Supercycle waves sometime this year. However, looking at the road ahead, we might not see a top until September now. I’ve given up on being specific, as these waves have been moving very slowly. Ultimately, Mr. Elliott’s waves will forecast the end and give us adequate warning of the turn.
______________________________
Here’s the latest daily chart of ES (emini futures)
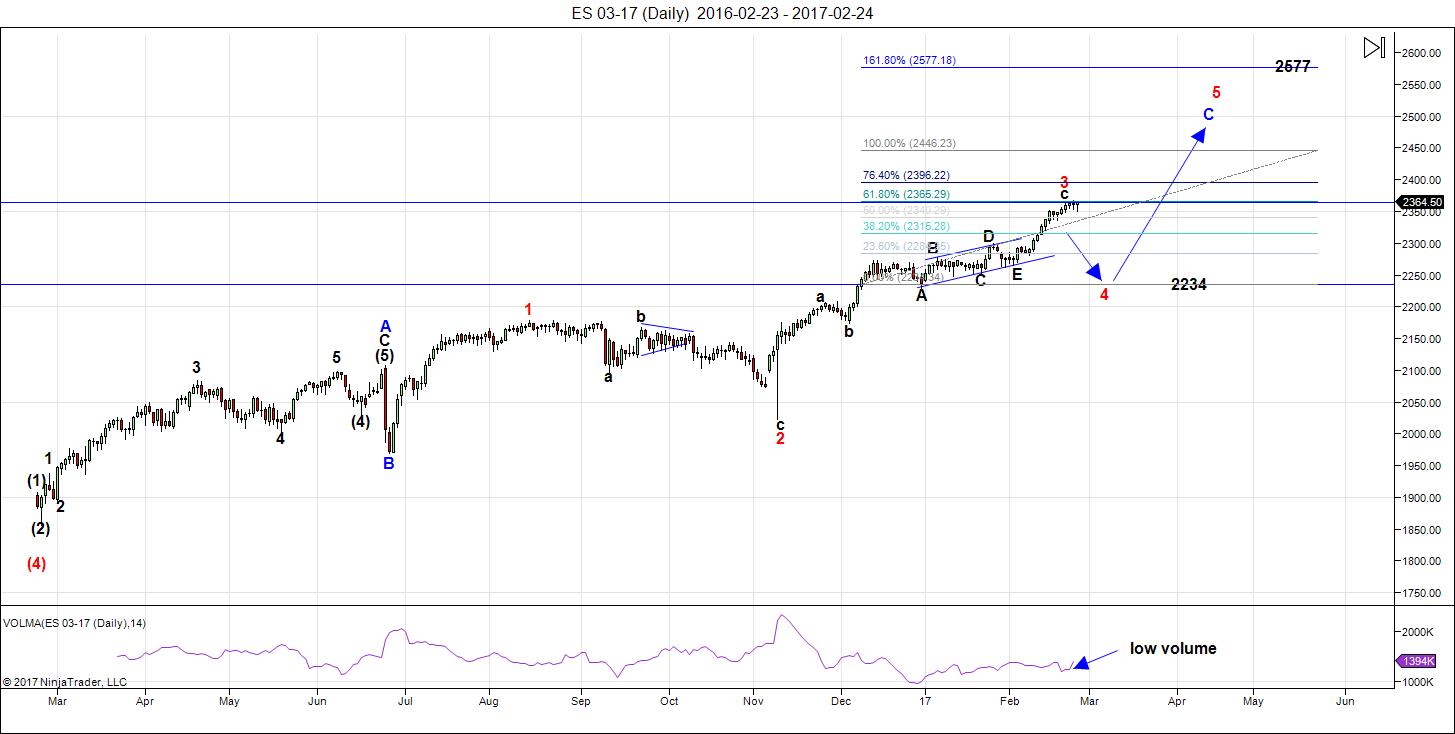
Above is the daily chart of ES. The full wave up looks to be like a triple three (a combination wave) which is at completion.
The final pattern of the triple three is now labelled as a very rare running triangle with a final motive wave as the final thrust wave. This would be the top of wave red 3. In high degree wave structures, the thrust out of a triangle can be a blow-off wave, and that certainly seems to be what we got.
There was a very obvious, large ending diagonal in ES. Note also that the volume is extremely low, which is bearish.
What is obvious at the end of the week is that in ES (not in any other indices that I see, although I could have missed a sub index), the third wave up at 2365 is exactly 1.618 X the length of the first wave, which is the typical length relationship between those two waves.
None of the other indices (SPX, RUT, IWM, etc) have that relationship and are much shorter (except for the DOW, which is longer). This tells me two things:
- the waves are compressing, as they very often do in a final sequence, and
- the market is starting to get a little sicker as we move forward.
ES reaching that milestone also gives me confidence that my wave count is correct.
Currency pairs are, for the most part in sync to where they should be in relationship to a pending final blow-ff sequence.
The 4th wave will come down in three waves. After we finish the A and B waves, we should be able to project an end to the C wave of the 4th wave. Once we finish the fourth wave , we’ll get a final blow-off wave for the month of March, with a potential top that month or into very early April now.
Here are the path predictions going forward:
- Wave 4 will come down in 3 waves with any of the corrective patterns possibly in play.
- Wave 5 is likely to be an ending diagonal. In any event, it will be in 5 waves (not motive).
Summary: We’re at the top of wave 3 of the final 5 wave pattern, ready to turn down into four with one more very small wave up to a new high. I expect all major US indices to turn this week. The larger wave (4) should come down in 3 waves (an ABC configuration to the target).
After completing the fourth wave, we’ll have one more wave to go, which could be an ending diagonal as a fifth wave. The long awaited bear market is getting closer.
_______________________
Here’s the latest HOURLY chart of ES (emini futures):
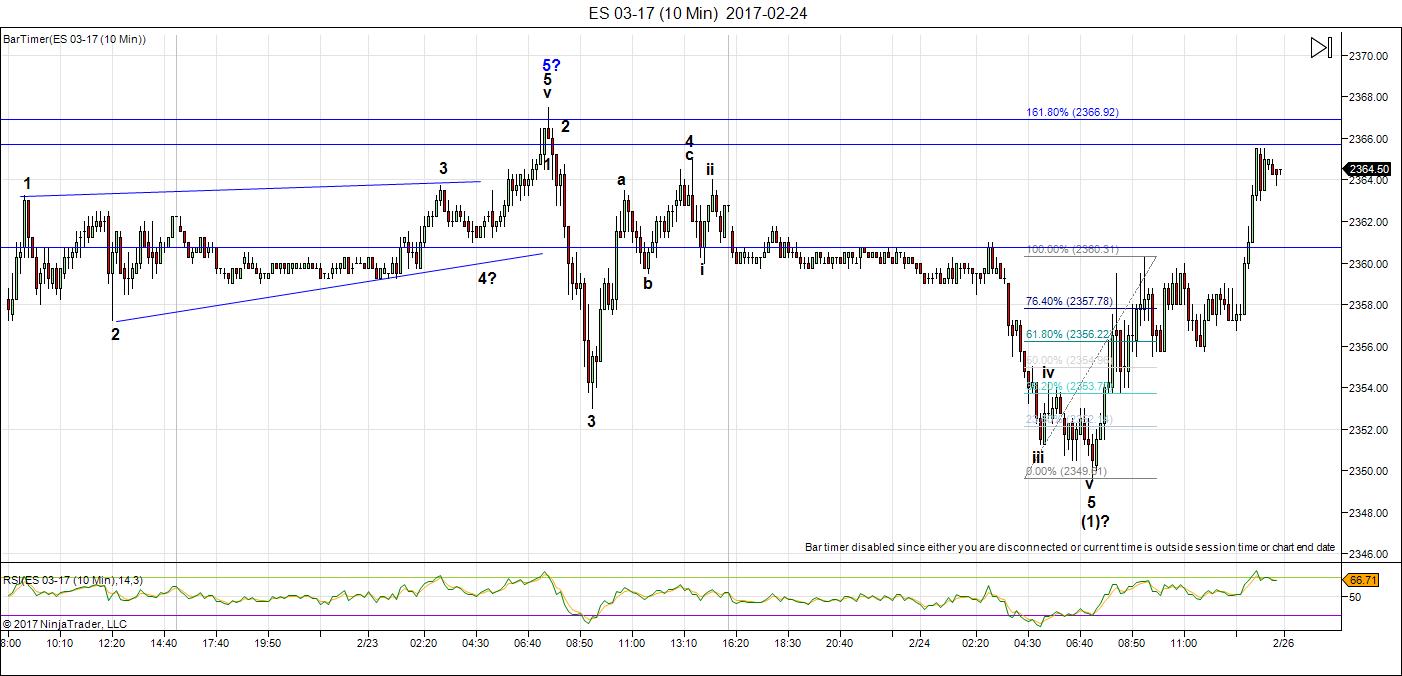
Above is the 60 minute chart of ES showing our progress to the end of the day on Friday (click to enlarge). We’ve rallied at the end of the day, but not to new high. Everything tells me this is the final few points of this wave up, if it hasn’t already topped.
We had an Andy Pancholi turn date on Thursday/Friday, and both a full moon and eclipse this weekend.
_____________________________
Some housekeeping:
Andy Pancholi Turn Dates (March, 2017)
- SP500: Mar. 1, 6, 13, 17, 28/29
- EURUSD: Mar. 6/7, 21/22
This is a big cycle turn weekend, with a turn date for the SP500 on Feb. 23/24, which often translates into a turn the date after. As I’ve said, we have a full moon and and eclipse this weekend (Sunday eclipse).
New Free Blog Post: Usury Comes to America
The Chart Show sign up is live for Thursday, March 2. You can sign up now in the usual spot: Webinars
________________________
Here’s a video overview of the market for Monday, February 27, 2017
Note: I spent some time going over the smaller degree charts in the SP500 and ES.
Market Report for February 27, 2017 |
_______________________________
The Charts Going into Monday
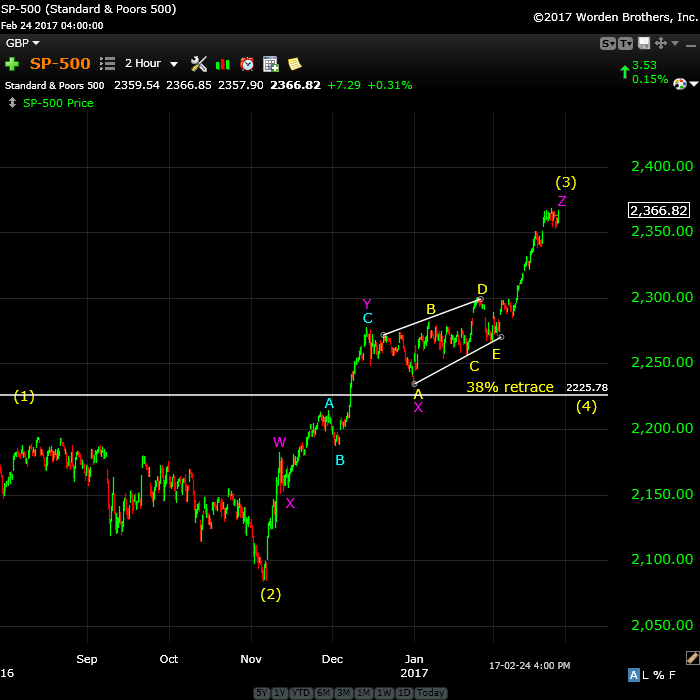
Above is the 2 hour chart of SP500 re-labelled to show the three sets of pattern in wave 3 (a triple three), which is a combination wave. The final pattern has been labelled as a rare running triangle.
We might see another small “poke” above the current high on Monday, which, if it happens, would be most likely be followed by a sharp reversal.
We had an Andy Pancholi major turn date of Feb 23/24. which often calls for a turn the next market day, which would be Monday. There’s also a full moon and eclipse on Sunday.
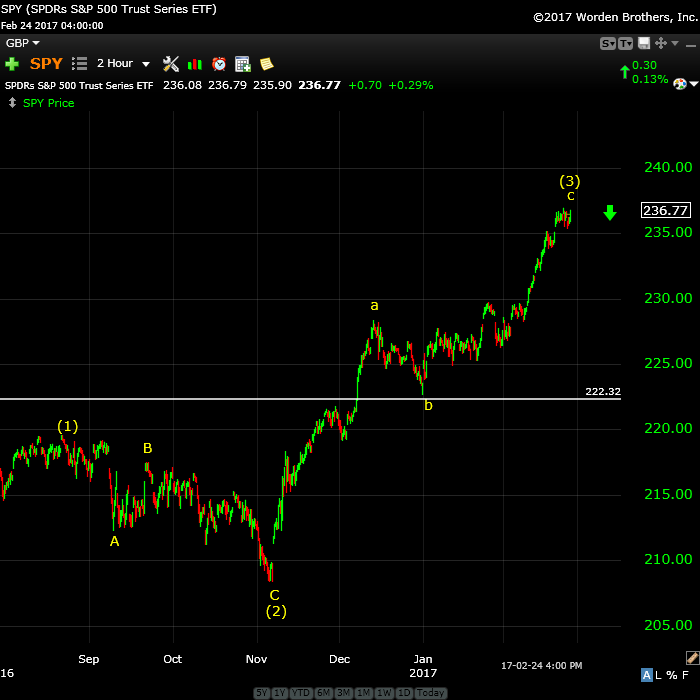
Above is the 2 hour chart of SPY showing a simple abc wave up. This labelling reinforces the idea that this wave up is corrective and has the same prognosis as the SP500 and ES. We’re at the top of wave 3 expecting a turn down.
222.32 is approximately the 38% retrace level of wave (4). The bottom of the previous wave 4 up, which is also a likely stopping point, is ~222.67.
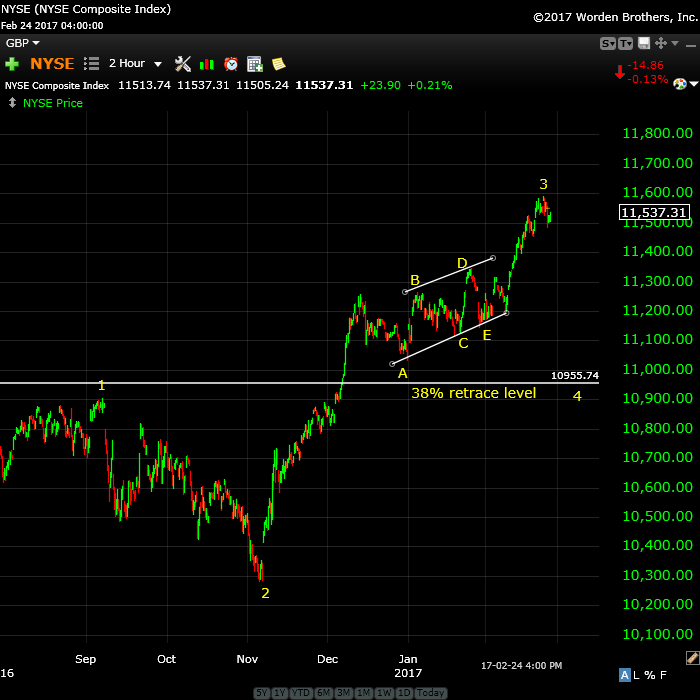
Above is the 2 hour chart of NYSE.
On a near term timeline, wave 3 is complete. The fourth wave down should parallel the configuration I’ve already mentioned for the other indices.
The 38% retrace level is at ~10,955, which is just above the first wave area, so this index still has the potential to trace out an ending diagonal—still to be seen. Wave (3) up also looks to be in three waves, so this is not an impulsive wave. We’re expecting an immediate continuation down on Monday.
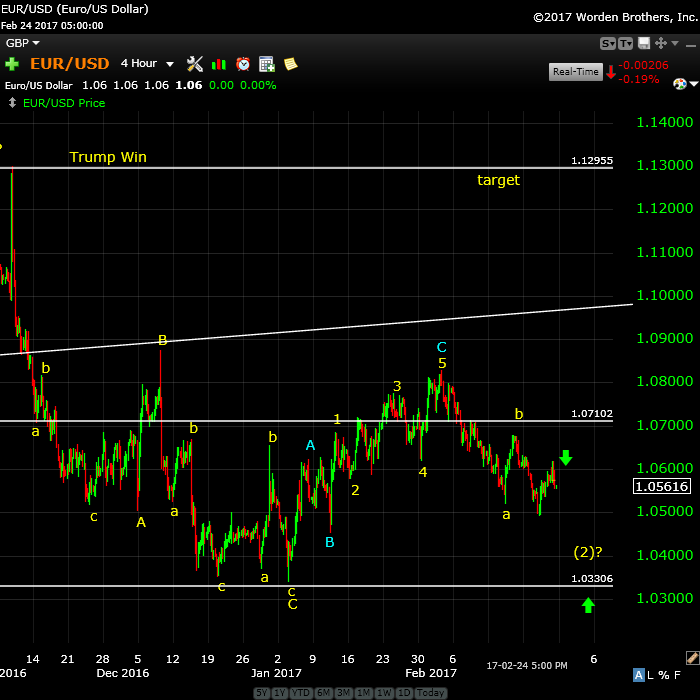
Above is the 4 hour chart of EURUSD. Here is the bigger picture for what I cover off in the video.
As I’ve been saying, EURUSD should continue down and may get to a new low. I’m uncertain as to the turn point, but I expect a wave up to a target of around 1.13 eventually before a larger turn lower.
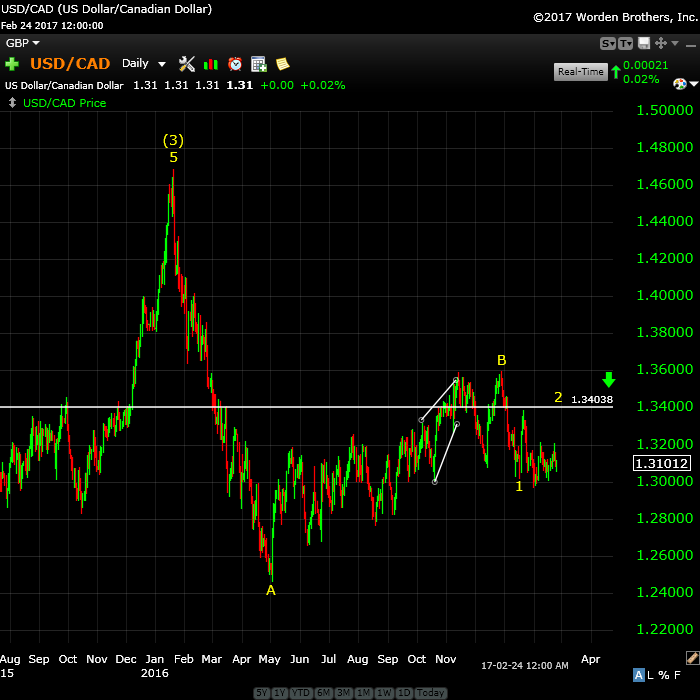
Above is the daily chart of USDCAD.
We’ve already hit my target of about 1.34 but I’ve been expecting a double wave (2) and we’ll slowly working our way to that end. We’ve completed blue wave A and B (in the video) and I’m expecting a C wave up in three or five waves before we turn over and head much lower. This is the look at the bigger picture. The next larger move is to the downside with a target of about 1.19.
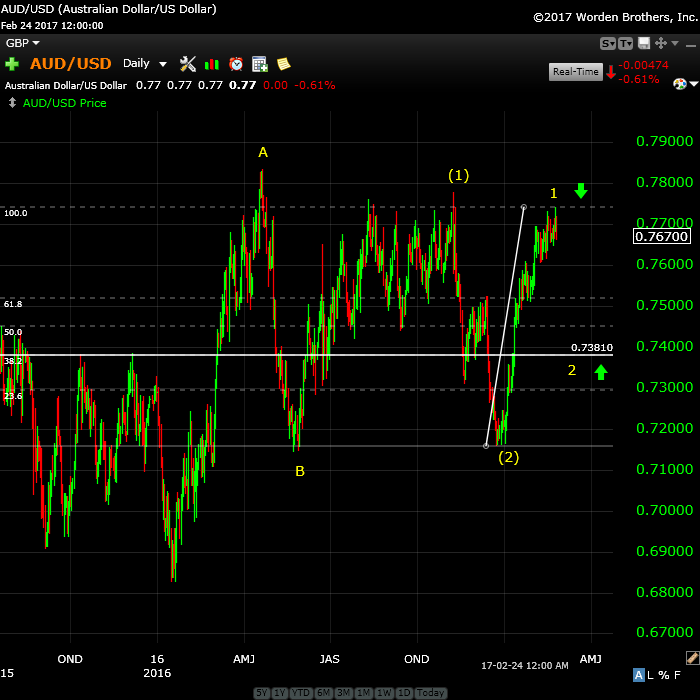
Above is the daily chart of the AUDUSD. This is the bigger picture to my short term projection in the video.
I’ve an eventual target of .828 for this pair, which is just shy of the 38% retracement level of the entire larger wave down (from the year 2011), which would make this wave 4.
In the video, I show that we’re already in wave 2 (within the A wave down). We will move to the target in three waves to approx. .738 before turning up into the larger third wave. More information for the short term direction is in the video.
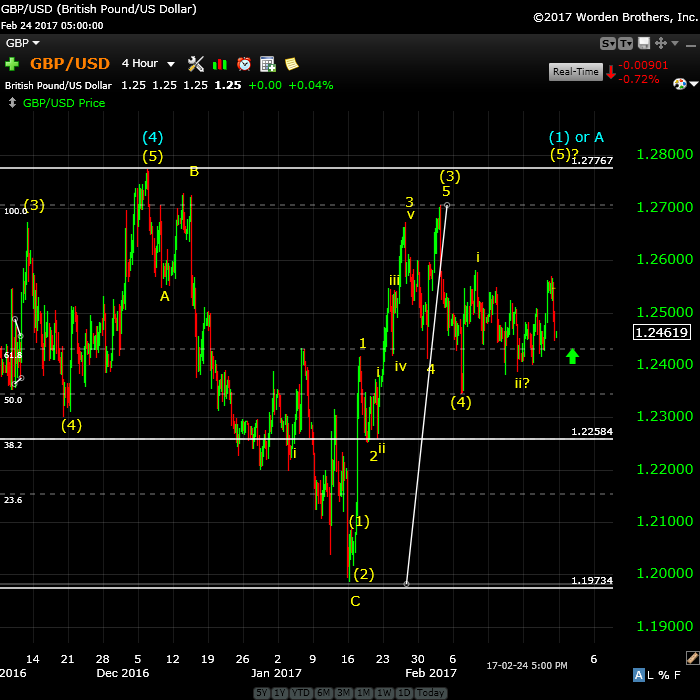
Above is the 4 hour chart of GPBUSD. During the past week, I’ve been calling for higher levels and the pound has not disappointed. This currency pair, however, is bucking the trend of the other pairs (moving counter to the EURUSD, for example), but will likely get back in sync soon. I would expect everything to head in to the 5th and final blow-off wave together.
Shorter term (in the chart above), we look to be in the final 5th wave of the larger first wave with a target of around 1.27767. After that, expect a turn down in a larger second wave to about 1.22864 (or lower).
My overall prediction here hasn’t changed from last week.
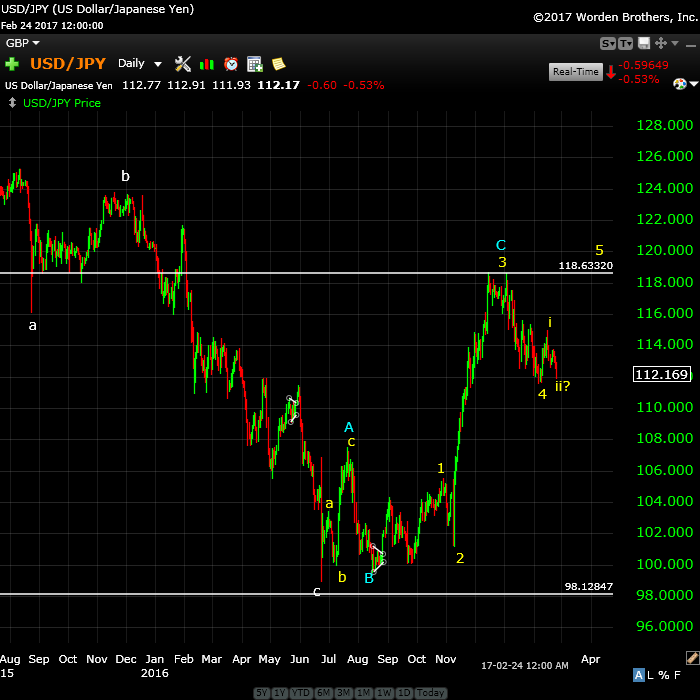
Above is the daily chart of USDJPY. We’re in a corrective pattern down and I’m expecting another correction up now to a target of about 118.63 (a double top). This will parallel the corrective moves in the other USD indices I cover (as they complete their second waves).
After hitting this target, expect a large C wave down with a target to come in the next update.
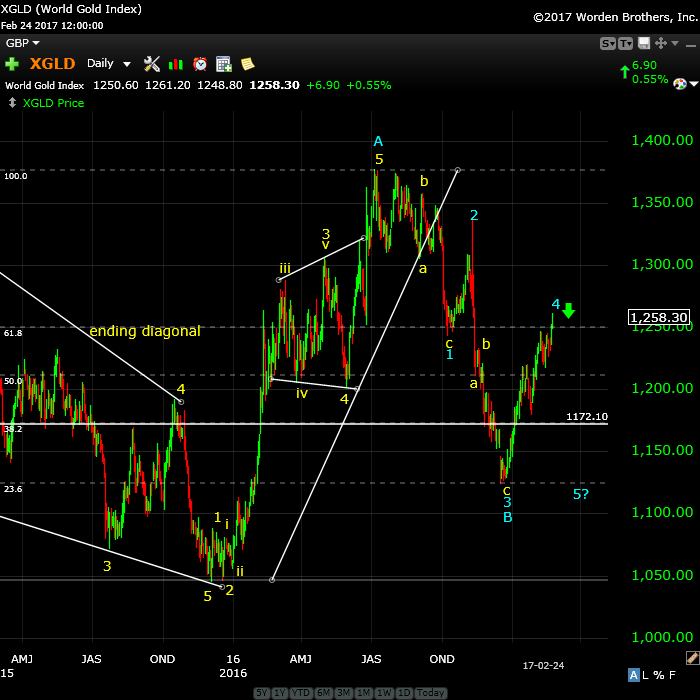
Above is the daily chart of gold. We’ve completed A wave up, but it looks to me as if it’s a wave four. It looks corrective.
I’ve been calling for a double bottom for gold and this is still my preference. The wave up in silver appears even more corrective and they tend to follow each other. The alternative would be a drop down to the 62% area around 1172, but I prefer the double bottom at about 1122.
The final upside target is around 1585.
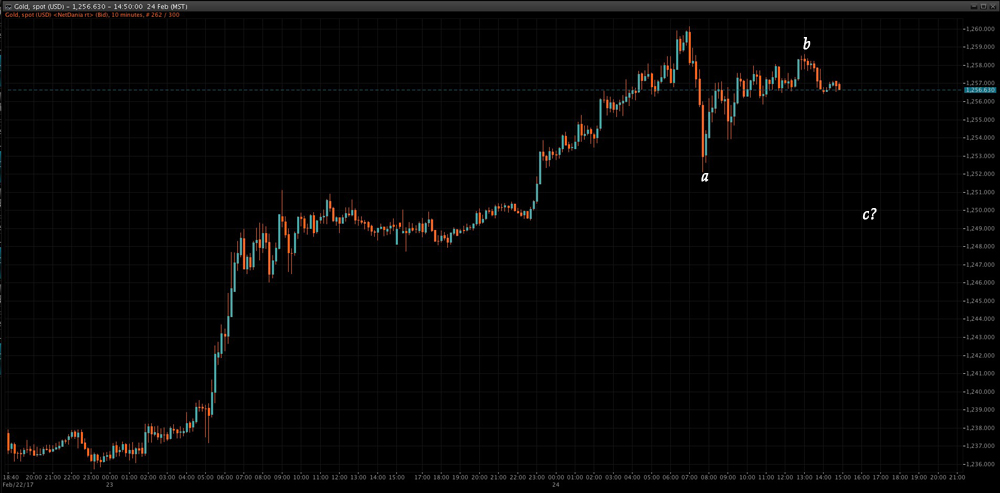
Above is the 5 minute chart of XGLD showing a potential top shaping up. There was a bit of a buzz about this on Friday. However, after drilling down to the one minute chart the wave down now looks to me to be an A wave and we may get a C wave now down to a previous 4th, perhaps to around 1248.
This may in fact, end up being a fourth wave with one more wave up to a new high still to go. I would think we’re getting close to topping out, but I don’t think this is it yet …
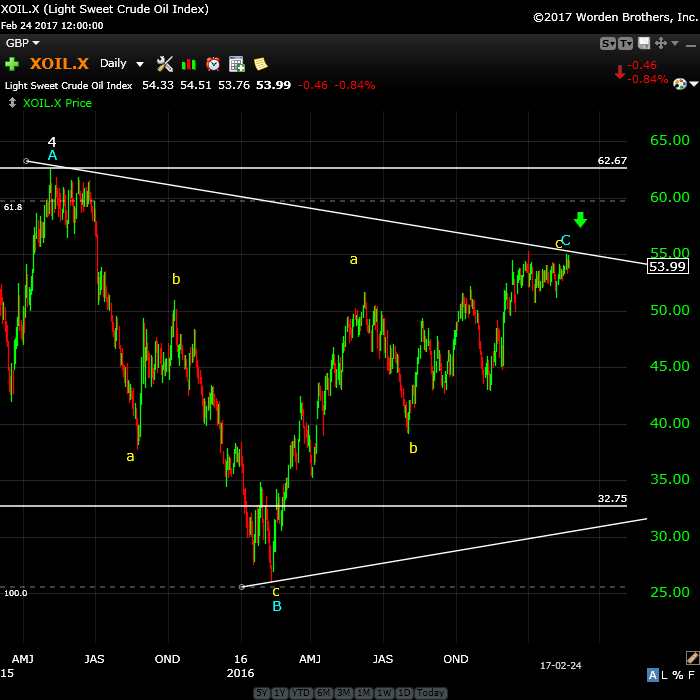
Above is the daily chart of WTI oil. Not much new here. We look to be completing a topping process.
The waves down from the top were in 3 waves (shown in the video) and we look like we might we in a fourth wave triangle. My preference here is for a double top.
Once we top, the next move is down to a target of about 33.00 (in 3 waves).
Finally, we should get an E wave up to the upper trendline to complete the larger pattern. That would be followed by a final 5th wave down to a new all time low.
Good trading!
_______________________




I’ve been able to come up with an alternate count tonight for ES which adds a potential few more points to a potential top. It’s a worst case scenario.
ES: Looking good. I put us in the second wave of the 5th of the first. We want to continue down here until ~2350 before a bounce into a second wave.
AUD looks lie it came up short of .771 last night. Do you think its going back up to make it?
Honestly, I have no idea what’s going on at the moment anywhere. It’s like we misplaced our keys and are wandering around trying to find them before heading out … this isn’t making a lot of sense …
Understood. When things make a little more sense I’m sure you will let us know.
I more suspect something like the SPX not hitting its target during market hours and having to go do that. I kinda doubt that AUD is holding this thing up because it’s such a small player. However, it has a habit of missing targets itself and then hanging around to hit them later on.
This is one crazy market, where these turns rely on everything being in place right across the board in order to follow through.
Gold is continuing to rise. Personally I think when wave 4 starts gold will get above 1300 and then will do a 62% retrace. The chances of a double bottom are fading very fast in my opinion.
Big sell off in miners today. Not much of a sell off in gold, but this might be a prelude to the down wave Peter has been projecting.
The hosting server for my site seems to be having some issues … it’s been up and down over the last half hour.
I don’t see any waves in 5 down, so we’re likely going to levitate today, with ES going to a double top on this second wave. AUD may go tag the .771 area as it’s come down to a point where a C wave would equal an A wave to that area.
It appears we’ve topped; now we need some follow-through.
I’m going to be out for the afternoon.
The never ending Wave 3 on ES/SPX continues…. I’ve just been buying on dips and riding to new highs. That has worked like a charm this wave up. Still holding on for 2400 with tight stops in place in case Wave 4 begins quickly. What area does ES need to hit now to confirm wave 4?
Why do you have a target of 2400? Where does the number come from?
2400 was the next highest round number once we got past 2300. SPX was just under 2200 at top of wave 1 so half kiddingly I said 2400 was the next target for Wave 3. It’s been working so far! Lol. I like round numbers 🙂
Plus the general bullishness keeps carrying on so I’ve stayed long until something changes the sentiment. Less scientific but I haven’t seen signs of wave 4 so I’m just staying the course with tight stops in case Wave 4 comes out of nowhere.
The Market Report for Tuesday is live at the top of the post.
Everything I see including gold and oil is down in three waves so far, so there are no setups at the moment. Trump speaks at 7PM EST (I think) and so we may see little movement during market hours other than a slow drift upwards, but I don’t see anything other than my projections from last night’s video … so far.
ES could do a flat (3-3-5), if it headed down from here.
My site was down for a couple of hours. No idea why. Very weird. Seems to be OK now.
If you use Amazon for anything that could be why. Big outage today
No, it was internal to wordpress. I just had to do an update on permalinks, which is odd. It took my two hours of trying everything else. No idea why all of a sudden something so benign would cause a problem. The last thing I would have thought of, and did … lol.
Mike,
Other than that, this is the strangest market …
I wonder if we’ll get a big reaction after hours with Trump’s address. I’d say we’ve topped in ES/SPX but until SPX goes to a new low here, I can’t 100% guarantee it. It’s in a fourth wave. ES is in something else (not a fourth) but I can’t really confirm anything.
I just thought this was interesting as you have us coming to the end of a 500 year cycle.
October 2017 marks the 500 year anniversary of Martin Luther reformation.
http://www.visit-luther.com/explore-luthercountry/events/2017-500th-anniversary-of-the-reformation/
Yes, and the Renaissance, and the printing press (internet) slightly before it. Every five hundred years, a major revolution.
The Market Update for Wednesday is live at the top of the post.
Trump has his talk before Congress beginning tonight at 9:10 pm EST. We may see some action in ES, the dollar, and USD currency pairs.
Stocks heading up again! Looking like new highs here we come.
Wow! Dow 21,000 and SPX 2400 are within striking distance! If we exceed your worst case scenario of 2380 on ES, then what? We are just about at that level.
There’s Dow 21K, now SPX 2400?
Trying to pick the end of wave 3 with EW has been a complete disaster. I’m not even sure we really are in wave 3 as this action is more like a wave 5 blowoff top!
I know. I’ve just stayed long, buying on dips, and have stops in place if it breaks down. Up pretty big in this wave.
I put us in wave 3 of an extended wave, and I don’t see an end immediately. We should have a ways to go. I just replace the ES chart to try to place some more labelling on it, but it’s fluid at the moment.
We should see a series of wave 4’s starting soon.
So should be okay to stay long/bullish for a while?
I placed an ES chart at the top of the screen. We’ve now morphed into 5 waves, and I don’t have an upside target for this wave.
Will be interesting to see how it pans out Peter but after today I have absolutely zero confidence in shorting. We have been trying to nail the wave 3 top for months now and it just shows even with EW finding market tops really is a fools game.
Well, last night, I said it could to either way in ES/SPX (and NQ) and the direction ended up being up, of course. The third wave extended. We’re in the third wave of the fifth of the larger third. But we still have more to go in this wave we’re in. The projection as far as I can see will be in the report tonight. You don’t want to short the US market. This is a blow-off and we still have more to go.
The top of this third wave of the fifth of the larger third is likely to be about 2413, which is 2.618 X the first wave. Then there should be a fourth and fifth wave up to end the large third wave, by the looks of it right now.
USDCAD has possibly topped. Currencies pairs are pretty much moving as projected. Note that AUDUSD missed it’s second target by a few pips, came down in three waves and looks like it’s headed back up to retest the top of that second wave.
So maybe 2500 or so for the top of 3? That would make sense with your original projection of 2800 for top of wave 5.
Depending on which high you use to measure, Gold looks like it retraced 61.8% here. If it goes higher, next level would be 1253.22.
Been sticking with Gold & AU since SPX is just out of hand.
Mike,
I don’t see anything that looks interesting tonight in gold, silver, or oil. Overlapping waves down in gold so far, is what it looks like to me, which means at least another top.
Took a stab at it at 1250 and closed at 1247 after the next 5 minute candle indicated it was headed back up.
With everything so out of whack, the only way to turn a profit seems to be trading within the ranges we’ve had, and only in the direction we see it headed. ie– Sell AUD spikes, close & leave a small amount open, rinse, repeat.
Yeah, I just finished the report. It will be up shortly. AUD keeps missing targets and retracing, so you almost have to day trade it. USDCAD is at a potential major turn, so that’s one to watch. AUD should head down, but not before testing the previous 2nd wave high. It’s a very, very tough market.
I would think Oil would be coming up for a trade soon, but still no movement other than sideways …
The market update for Thursday is live at the top of the post. I’ve included a potential low for this fourth wave in ES. We have an accordion-type wave structure ahead before we find a top in this wave 3 from today and then another 4/5 up/down combination before a top.
AUDUSD. It looks to be tracing out a triangle now (tonight), which after an E wave up, may head down to a new low.
Is the entry point still .77 or should I get in now since it hit a new recent low?
I had left a comment last night (maybe you missed it) that AUD appeared to in a triangle of some sort and might head down, which is what it’s doing.
I would think this A wave will get to .75165 before a meaningful bounce. Also USDCAD just hit the target and turned down (this is the big opportunity).
Guess I misunderstood the comment. Thought it would go back up to .77 and then new low. I saw CAD did hit your 1.33/1.34 target. Seems like its ahead of AUD in terms of waves. Let me know when to switch out of AUD into CAD. Don’t want to miss the big one down in CAD!
Well, the triangle was really odd and I expected an E wave, which we didn’t get … The AUD chart is getting extremely difficult to decipher – there are so many waves up and down now … and finally a break, almost out nowhere.
I am short both AUD and CAD right now but not in large amounts.
I’m in AUD late. At .77, it missed my entry stop by one single pip.
CAD looks like an ending diagonal on a 10 minute chart and so a break of the lower trendline is a good entry point. We’re at that point now.
This EW if very tough to follow. We were at a top then up we go. Now we have to go to another new high. Never seems to stop.
You’re witnessing an historic event. Wave 3 is always the strongest and longest wave, but we’re fast coming to the end of it. We’re in the fifth wave of the third. In fact, we’re in the fifth of the fifth of the third.
We’re at a multi-decade optimistic extreme. The percentage of bullish market advisors is at 63.1%, which is the highest since January, 1987. This is the longest bullish streak since 1987, as well. In fact it was this only one longer than this one in the past 100 years.
The mutual fund cash to assets ratio has dropped to a record low of 3%.
The gap in the SP500 this morning could be an exhaustion gap, which happens at the end typically of strong third waves.
Wave 5 will should not be as long or as powerful. This is the blow-off wave, although many not knowledgable about EW will melt the 5th and 3rd together and call it the blow-off.
We will not see other wave like this in our lifetimes.
“We will not see other wave like this in our lifetimes.”
Does this refer to this wave 3 which started with trumps election or a wave within it?
Wave 3 and I guess wave 5 to follow, although the wave 3 we’re should be the most bullish and powerful … we’ll see.
USD/JPY continues to look good. Still holding a small long so hopefully this market will rise as per EW whilst the ES does its own thing. At least with currencies you don’t get random blow offs so it’s less risky from that perspective.
AUD/USD finaaaaallly falling. That one has been frustrating so far. I think currencies look more exciting to trade than indices at the moment.
Gold and oil falling hard! It’s all happening now.
Silver has finally jumped on the bandwagon too. Makes me think this move is what we have been waiting for.
Yeah, I saw that and I’ve grabbed a subwave chart of both for the chart show. A little early yet and I’m cautious …
It looks to me as if we have an inflection point right here (12:15 EST). I think AUD is bottoming, USDJPY possibly topping (all A waves) and USDCAD topping.
ES has come down to the 38% retracement level, which is deep for the wave count I have, so I think we’re only going to have this large 4th wave and one more wave up to a new high – that’s what seems to be happening, but I have one extra small wave for some reason … not that it’s a big deal, but it should be an even number.
I’ll go over my concerns in that regard in the chart show. It doesn’t change the projection. This final wave has one more high to go in ES/SPX.
GBPUSD. It looks to me that this pair is now at the bottom of a second wave. I’m changing my count now as it’s retraced 62% exactly of the wave up. I do have one set of subwaves that are overlapping and that gives me a bit of concern, but this new count is the one that is the most probable. More in the chart show.
The chart show recording is live now at: https://worldcyclesinstitute.com/march-2-2017/
The Market Update for Friday is live at the top of the post.
Do you have any revisions to USD/CAD?
I was skeptical about it to begin with, since AUD & USD/JPY still have a ways to go before hitting their targets. Maybe UCAD is going to stall around here while the rest play catch-up, or we get a big move shortly in the others. I’m expecting things to whipsaw in 3 hrs with Yellen speaking.
USDCAD did a slightly larger ending diagonal last night, but I see a first wave down and we’re in the second wave now. We should head down from here. Anything else tells me there’s something else going on.
USDCAD can also to a double top without sounding alarm bells for me. However, it has to turn there.
(sigh) Let the games begin. On CAD, I’mn showing a measured potential end at 1.34378. I still put us in this ugly ending diagonal and that’s the best I can do at the moment.
Actually, A wave = C at 1.34328, just where we spiked to.
Head’s up. There is a good possibility that we’re seeing a major turn in currencies into the final wave. EURUSD had a double bottom last night and then did 5 up and 3 down, before turning up in earnest.
USDCAD has turned. There’s a chance that AUD may not do more than the 38% retrace (but I’m certainly no ruling it out).
ES/SPX still has to complete the small 4th wave to a new high (although it’s longer now, since it came down so far in the retrace. I put the final high for (3) now for ES closer to 2407 and it may not make it quite that far.
So we may have a potential bottom here on AUDUSD instead of .738? What about Gold & Silver?
AUD: I’m just throwing that out there. This wave down looks like an A wave only so my preference is for an eventual ABC to 62%, just a caution.
Gold is down in 5 potentially (may have a little further to go), so we want to watch for a 62% retrace. Silver still no change, really, but it will parallel gold, I’m sure.
Yellen is off to the races at 1PM EST. Until then and shortly after, I predict goofiness in the markets.
I just mounted a chart of USDCAD at the top of the post.
A tick or so higher on the drop-dead top for USD/CAD. Get out in profit here or is the trade still valid?
Still valid, but based on what I’m seeing, may be a moot point. We bought the rumour, I think.
I want below 1.338 and I’ll be happy.
Obfuscatory gobbledygook at its finest! I am listening to the fat lady live.
Thank goodness they got to the important questions, like “What do you discuss at dinner?”
USDCAD has now dropped below its previous 4th, which is a strong indicator that the top is in. I put the first target down at 1.33275 at least.
EURUSD has shown great strength today, so we look to be in the final wave up. The top is getting closer ….
ES/SPX still has to top off this third, but we’re not far away. More on the weekend.
GBP also turned up at a point where the A wave = the C wave, so I’m fairly sure it has bottomed now.
A new blog post is live at: https://worldcyclesinstitute.com/a-turn-for-the-better/