
Fourth Wave Triangle Warning
The warning is this: One more relatively small wave to the upside once the horizontal waves of the triangle play out. Then it’s down, down, down … until 2022.
I give it about a month until the top tick is in.
The Nasdaq
For the past few weeks, I’ve been referencing the pattern unfolding in the Nasdaq on a daily chart and making the case that it looks like we have an ending diagonal unfolding. This weekend I’m tempering that prediction slightly, as I can see either a contracting triangle or an ending diagonal (but my preference is still the ending diagonal).
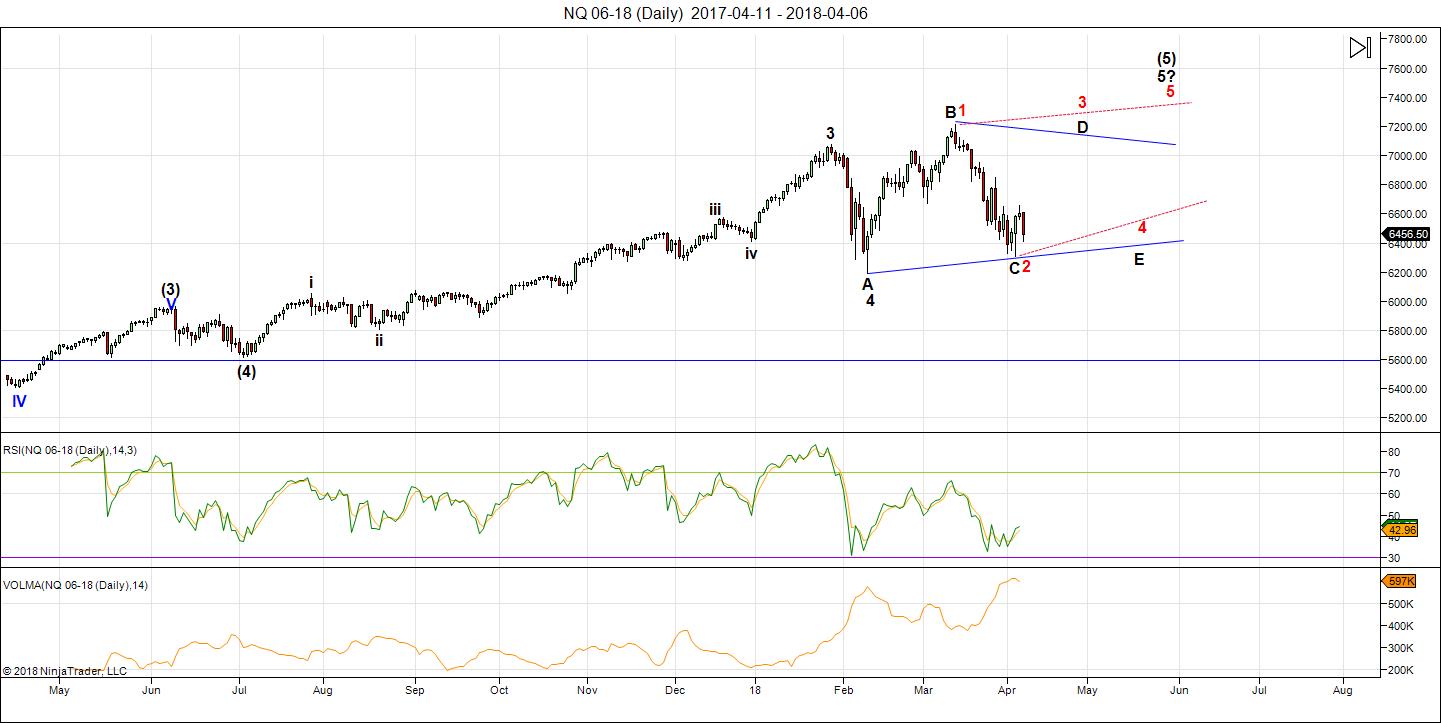
Above is the 60 minute chart of NQ (Nasdaq futures) in which I’ve drawn both the trendlines for a contracting triangle (blue) and ending diagonal (dotted red).
The reason I’m favouring the ending diagonal is due to the new high (marked wave B or 1) in the chart above. Normally, a contracting triangle will not seek a new high until the final wave out of the triangle at the very end (the fifth wave). On the other hand, each bullish wave of an ending diagonal seeks a new high.
Triangles are labelled with letters; ending diagonals with numbers. Each contain five waves of three waves each. However, there are subtle differences. Ending diagonals have a slope to them (in this case, to the upside), while contracting triangle are horizontal patterns.
As mentioned, each of the waves of an ending diagonal traces out a new high. The final fifth wave will be the shortest wave of the sequence and trace out three sub waves. In a triangle, the final fifth wave can be the longest wave and will trace out five sub waves.
If the current wave we’re in now traces out a new high, we have an ending diagonal at work. Otherwise, it will be a contracting triangle.
Summary: For NQ, we’re in the final pattern of this 500 year bull market. My preference is for an ending diagonal, but it also could be a contracting triangle. We’ll know the answer at the top of the next wave. It’s early yet but a triangle pattern of some sort is what we have here.
A Rare Triple Zigzag
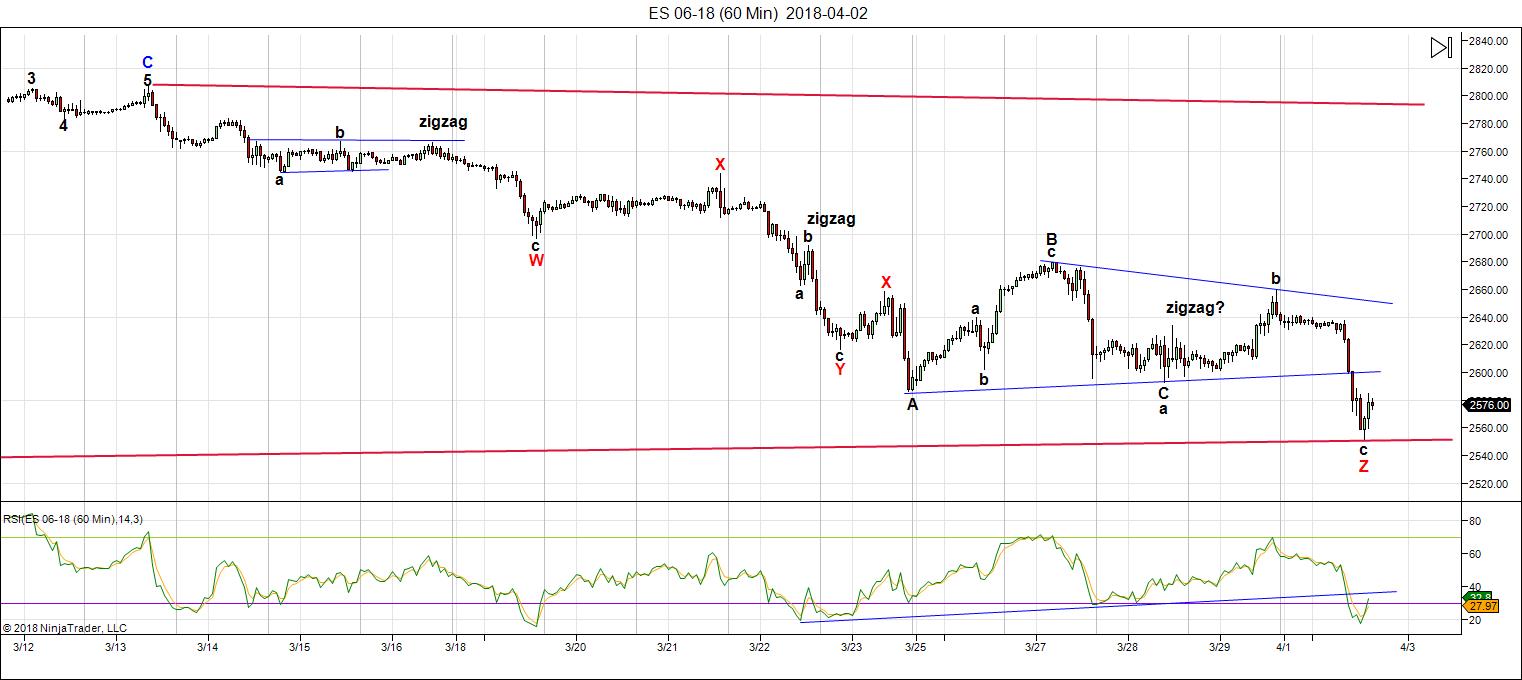
Above is the 60 minute chart of ES (SP500 emini futures) showing the C wave of the currently unfolding contracting triangle (the pattern was the same in the SP500. This is an extremely rare combination wave pattern that traces out three separate 5-3-5 wave patterns in a row.
There have only ever been three patterns in a combination wave, so at the end of the third zigzag, you know the trend will change. It did and that gave us some nice gains on the wave up on Tuesday and Wednesday of this week.
We also took advantage of the drop on Thursday night and Friday. On Friday, we put in a bottom, so expect us to head up over the weekend and into next week as we trace of the D wave of the contracting triangle (daily chart below).
For more detail, join my Trader’s Gold subscription service, where subscibers get hourly charts like this one and trade information on how to specifically take advantage of the move.
____________________________
Registration for Commenting
Want to comment? You need to be logged in to comment. You can register here.
If you register, it protects your information. It also allows you to comment without filling in your information each time. Once you’re registered, simply go to the home page and click on the login link top right in order to log yourself in. Usually, you’ll be logged in for several days before needing to be logged in again.
______________________________
Problem receiving blog comment emails? Try whitelisting the address. More info.
______________________________
A true expert in Elliott Wave FL 2
A true expert in Elliott Wave …You are a true expert in EW analysis. What you provide is not available anywhere and is priceless. Subscription on your services is the best thing I have ever done. Many thanks for your effort to make me a better investor. I now have more trust in my investment decisions. I hope you will continue the excellent work! —FL |
the real deal SM 2
The real deal …‘Educational, insightful and thorough market analysis for all levels of traders. It’s Elliott Wave at its best….Peter Temple is the real deal’ —SM |
Tops in your field DZ 2
Tops in your field …You are tops in your field. Tried to follow Elliot Wave international for years. They were always behind the market. After discovering you, I perceive that you are an expert in reading the waves, which puts you way ahead of the rest of your peers. And you can read the Waves like you are reading tomorrow’s financial section. I pray you stay healthy. —DZ |
Couldn’t be happier … KK 2
Couldn’t be happier …The analysis and insight you provide is simply amazing! I’ve been trading the futures and equity markets for well over thirty years and usually average around 5% monthly. Since joining your Traders Gold Service two months ago, that number has better than doubled. I couldn’t be happier.—KK |
Have not had a losing week RW 2
Have not had a losing week …I have been with Peter almost a year. The only thing that matters is have I made money with his service. I think I have finally turned the corner using Peter’s EW. I have not had a losing week in the last 5 months. Thanks Peter, for your amazing amount of hard work. —RW |
The best of them JL 2
The best of them …Last couple of years, I subscribed to several ‘market traders’. You are by far the best of them and the personal contact is awesome. Daily and daily updates are very well written! Besides your expertise in EW, I also like your cycles analysis. Best investment I ever made! —JL |
Get an upper hand … JC 2
Get an upper hand in trading …Seeing all the different currency pairs and the wave structures and hearing you explain why this has to do that on a nightly bases gives one a upper hand when trading. Elliott Wave applies to all stock and indices and can be applied to any candlestick chart. If someone ask what you want for Christmas – Tell them a membership to Peter’s “Traders Gold!”—JC |
Rise above the rest … SM 2
Rise above the rest …I have only ever met a few people who, in their chosen fields (astrology, medicine, music, martial arts, technical analysis), rise above all the rest and you are one of them…you have ‘the gift’…and that’s why I’m a Trader’s Gold member. —SM |
The Market This Week
Here's the latest daily chart of ES (emini futures)
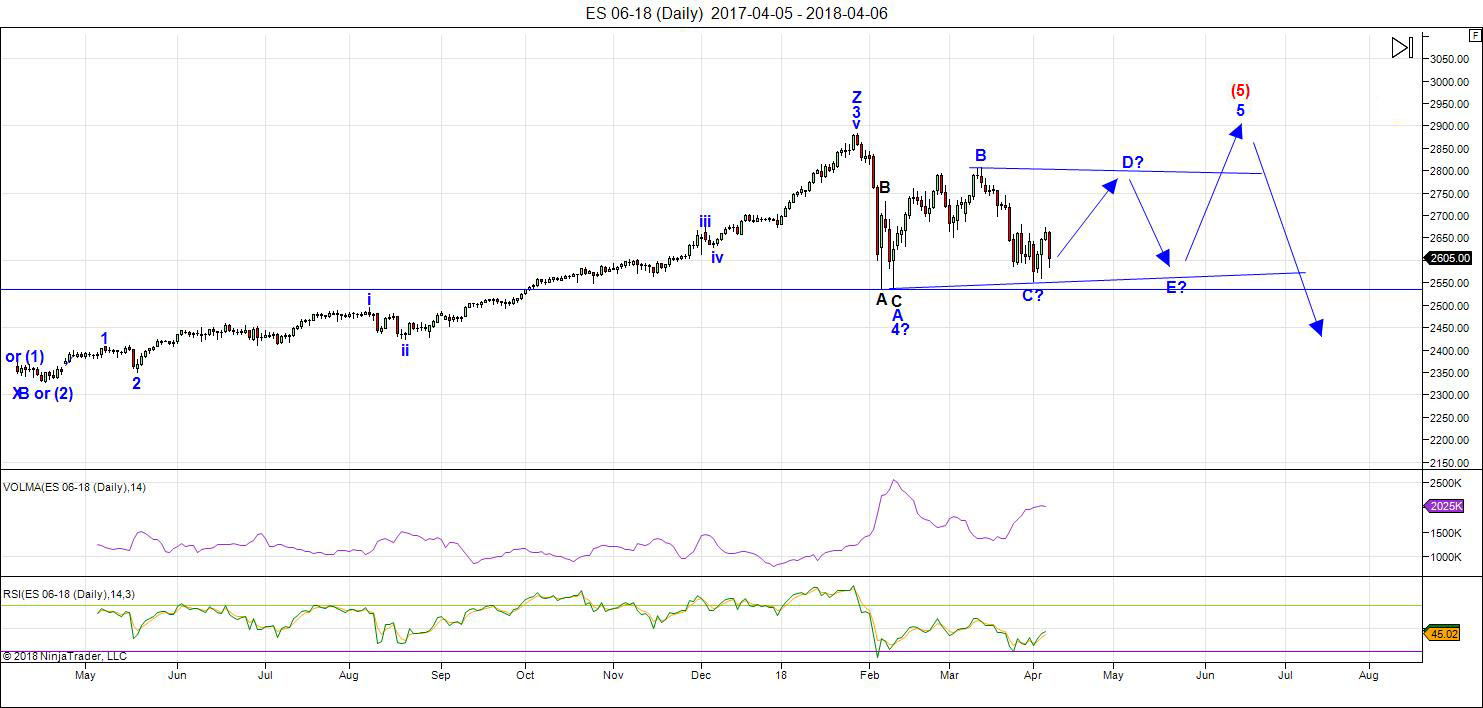
Above is the daily chart of ES (click to enlarge, as with any of my charts).
This week confirmed the contracting fourth wave triangle, which is the final pattern before the top. So, I'd give this bull market about a month. Then we magically turn into a bear market and we'll eventually head down at a breath-taking pace.
However, that action likely won't happen until fall, because the first couple of waves start off slowly. The crash doesn't happen until the third wave, and it usually takes a couple of months for the first couple of impulsive waves down to play out.
Until then, we'll go up and down a couple of more times (as per the chart above) before we take off to the upside in a fifth wave, which will simply finish off the pattern. We'll get to a new high and probably more, but don't expect (as I've been saying for a very long time) a large fifth wave that travels any great distance.
Over the next week, expect more upside as we trace out the D leg of the triangle.
Summary: More sideways to come as ES/SPX traces out a contracting triangle, which in a fourth wave position signals that a trend is about to end after one more wave (in this case, to the upside). That fifth wave up to a new high will be the end of the 500 year bull market.
___________________________
Trader's Gold Subscribers get a comprehensive view of the market, including hourly (and even smaller timeframes, when appropriate) on a daily basis. They also receive updates through the comments area. I provide only the daily timeframe for the free blog, as a "snapshot" of where the market currently trades and the next move on a weekly basis.
______________________________________
Sign up for: The Chart Show
Next Date: Wednesday, April 18 at 5:00 pm EST (US market time)

The Chart Show is a one hour webinar in which Peter Temple provides the Elliott Wave analysis in real time for the US market, gold, silver, oil, major USD currency pairs, and more. You won't find a more accurate or comprehensive market prediction anywhere for this price.
Get caught up on the market from an Elliott Wave perspective. You’ll also get Andy Pancholi cycle turn dates for the SP500 for the balance of the current month. There’ll be a Q&A session during and at the end of the webinar and the possibility (depending on time) of taking requests.
All registrants will receive the video playback of the webinar, so even if you miss it, you’ll be sent the full video replay within about an hour of its conclusion. For more information and to sign up, click here.


Peter T
Thank you :)…………………………
We are in Tune ……………….: )
My one concern in a much broader sense My Jan Low 2019 cycle date .
This year i view as overall bearish yet this initial cycle did produce a 10 %
plus drop and the next one should be as strong or stronger .
so 22 % 32 % drop coming next ???????
ill just say it can be done in this cycle by Jan 2019 .
the year 2019 should be up and at the least be a lower high than this year.
2021-2023 is open for debate yet forecast as a low ( It’s Debatable to me at this point )
im done for the weekend writing my thoughts in a bit technical nature
just getting back in the groove and trying to pin down price .
2019 will be a B wave. Around 2022 will be the bottom of the C wave.
believe the downturn will be an ABC…A to bottom last quarter of 2020/first quarter of 2021…
MODIFICATION: believe the downturn will be an ABC…A (possibly a) to bottom sometime between the last quarter of 2020 and the second quarter of 2021…
Gann’s Law of Vibration
https://tinyurl.com/ybz8euc6
Gann’s Law of Vibration
https://tinyurl.com/ybz8euc6
2022-1972= 50 years .
I have no data to back it up just pointing out
1922 1972 and 2022
2021 Minus
21 = Year 2000
34 = Year 1987
50 = Year 1972
61.8= ( – 61 ) 1961 ( 1962 was a crash )
89 = Year 1933 ( a lil late ?? )
144= Year 1877 ( have to look it up )
No doubt old Fibonacci is holding its own
2021 – 3 = 2018
2021 – 2 = 2019
1 = 2020
its just math and i have not become convinced how steep
the decline would be based on history .
The decline into Jan 2019 will give me more clues as to its shape
5 waves down in the $UTIL and were in wave C of a further developing
wave 2 followed by the 3rd of the 3rd , the wonder to behold ???
That would be into 2021-2023 if it develops as a decent wave structure
downward into jan 2019 is the cycle low of this bearish cycle that began
as early as nov 2017 to as late as jan 30 th 2018 .
All cyclical cycles label 2021- 2023 as a low .
That is why i question it !
Lets see how the markets look come mid aug – Sept
and then again in Jan 2019 and see what the wave count was with in this bearish cycle .
This Years wave count will tell the tale of what is coming .
We had several months of upwards movements with in what some call
the longest bull market ever ( counting from the 2009 lows and not considering year on year closes etc….. )
the year 2017 fit a 5 wave pattern coming out of the 2014-2015 sideways move.
This latest bull cycle is an extension from that aug 2015———–jan-feb 2016 low .
as a coincidence i could say this ??
Trump had a best seller at the top ( and became President )
If history is any guide the Donald would be going through bankruptcy court .
OR………..> Renegotiating Our DEBT .
Id say from a worldly point of view there is alot of countries that would prefer
the US Dollar remains strong ( Keeeps the US debt they own fairly priced in their currency )
Then of course we did have Helicopter Ben as well .
The Trade War is just the start ( Its really about the DEBT )
We owe it and who do you know that would have the balls to not pay ????
Donald Trump .
Call it stupid or Smart its up to all of us to decide but it seems to me if
there is anyone who would take this on .
ol Mr D T is the perfect guy to do it .
Fridays low in the dow emini was 23700
that level was very close to the .786 retrace i mentioned in prior thread
next week watch the 23671 level ( the .786 ) or use 23671 as a sell stop
against longs ( Very Very short term trading thinking )
the 23945- 23961 Pivot
Note the late closing bounce that tapped 23956 ( closed at 23920= Technical bearish close )
Warning its a bearish close yet not far from the pivot .
Next week would be a must be up week or all of this is wrong in many ways.
ok,
thanks peter for letting me put my thoughts down
Look at the dow futures monthly chart
Take the month of feb high to low
mutiply that point tange by .618 and measure from the top
of march to the .618 ext…..
next take the actual range of march and multiply that range by .618
and measure down from april high point so far and see what you find .
Narrowing ranges by a Fibonacci multiple.
the latest .618 ext was 23355
yes were making lower lows by lesser and lesser ranges
im finished
thanks again for the availability to post
Last example in regards to the 2.2 and 3.2
Fridays dow futures 60 minute chart
https://imgur.com/NiAof75
Peter T,
Please pardon my ignorance, but could you explain why, on your ES chart above, your Z3v high is not the final red 5 wave? Could this current pattern be the lead to falling off the cliff? Is there a Fibonacci reason?
Jeff,
I don’t really understand the question, so I may be way off base in my answer, which is very basic EW. The spiked wave at the top is the third wave. A trend doesn’t end on a third wave; it ends on a fifth wave. So the top of the third wave tells us there’s a fourth and fifth to go. That’s very basic, so if I haven’t answered your question, perhaps ask it in a way that gives me a better idea of what it is more exactly that you’re questioning. I don’t understand the references to a pattern (do you mean the triangle?) “falling off a cliff.”
Hi Peter you are early. I am not 🙂
I did my best again. Last week was OK but could be better.
Monday a LOW and the end of Tuesday/beginning Wednesday the HIGH. Wednesday could be a big turn. The rest of Thursday and Friday looks like a decline. But watch the site http://www.prognoseus500.nl/
I am updating it within 2 days
Thank you for sharing your forecast and site with us Willem. I am familiar with two of the indicators you are using. I have added your site to my frequent watch list.
Thanks SkippytheWondernerd, keep on searching and skip the ones who look like giving the right direction. That is how I started and still are searching and selecting.
Willem,
If you want to compare some more notes about these cycles, please feel free to send a note to me at my username (above) at gmail.
Copy from this site: “The warning is this: One more relatively small wave to the upside once the horizontal waves of the triangle play out. Then it’s down, down, down … until 2022”.
O.K. The Dutch predictor – 2 month’s ago – the High is wthin1% of the dutch index today. Tomorrow morning the high and then the decline starts. Watch the other news on the day. And if Comey on Sunday is bad news? We have seen the last High. http://www.prognoseus500.nl/
I agree
next week looks very weak
https://image.ibb.co/gZRpWc/April_9th_to_April_30th_energy_charts.gif
Hi Tom,
I have trown away the link to the black graph with green and red + + + +
just above the red bars. Second from below. Can you help me?
http://www.prognoseus500@outlook.com
Email = prognoseus500@outlook.com
we are now on the top of the Dutch predictor. Let see what happen. S&P500 2.666
Liz H,
Still following your August 2015 comparison to today’s market action. Looks like your “proposition” is still valid at least to me. The fact that the 50 day sma could cross down thru the 100 day sma…Does that encourage you that this has the possibility of working just like you proposed in your post a few weeks ago?
Not putting in new money Ed. If you’re fully invested in equities, no need to put in new money. Not when we’re towards end of the cycle and Fed is tightening.
Bearish around April 19th, tomorrow Friday the 13th (perhaps we get a 5/13/1932 kind of fade but won’t frontrun the trade until I see something). I’m bearish until May 8.
HI Liz,
April 19 I have a low, after that up again till April 24.
Sounds good John.
Nearly perfect tag of the 50% retracement of the March 13th to April 2nd move down today. With how choppy the move up from April 2nd was, could that have been a B wave in a larger C wave down and we are back to a Zig Zag instead of a triangle? Just some food for thought.
I am looking at the SP 500
Indicator 2b has his LOW on Friday. So now we should go higher until the 19th. Blue and Red line does not confirm this. On the 14th Astrology gives a negative signal for the financial markets. On Sunday 15th we have the interview with Comey and on the 17th we have the publication of the Comey report. Tricky week
sorry this is the “site” http://www.prognoseus500.nl/
Peter G,
Any thoughts on AAII’s Bearish Sentiment reading at approximately 17% which is the lowest level in 2 years?
I’m a little confused by your data quote, Ed. The latest (April13) measure of bears from AAII was actually a relatively very high 42.75%. It was the highest bear reading since March 9, 2017 (46.5%). Be careful with AAII numbers. They are not derived from a consistent universe sampling, as different individual investors answer the poll from week to week. I usually prefer Investors Intelligence survey because they deal with newsletter writers and the same ones every week. Their bearish numbers remain historically quite low with the latest reading there being 18.6% bears, and a 10 week MA of 16.1% bears (perhaps this is the one you were quoting). That (18.6) is their highest reading since 9-19-17. Going back to AAII and looking at the history of bearish readings as high as 42.75%, it might make you bullish. Why? Well, the following short term market bottoms were all between 42-43% bears…3-25-04, 12-21-06, 6-7-07, 6-16-11. BUT…be careful with those data. The following weekly reports were also between 42-43% bears…9-6-07 (down 1.7% in 2 days), 8-7-08 (+3% in 2 days, but then down 11.4% in 5 weeks, then down 42.4% in 14 weeks), 11-13-08 (down 17.5% in one week!). Sentiment readings can be important when you have supporting evidence or data, but by themselves, the are usually not a sufficient argument for either a bullish or bearish case…
Willem
without understanding your methods i find it hard to follow your link.
The inversion in the Bradley model you show i cant say is wrong but i do not agree with it .
it does not change my bearish bias for the year yet i must say that the present wave count does leave room for a sideways move .
ED
Im going to assume that bearish sentiment at 17 % assumes most are still bullish yet what does consumer sentiment say in regards to the present as well as next year ?
The close only dow daily chart has now broken above its downtrend line and
for the week we made a higher high than last week and close up on the week.
These are bullish sign’s
Liz
you mention may 8th as a low date .
ill mention something in regards to that date ( may 7th )
Feb 8 Low and march 23rd low ( both closing lows )
feb 8 march 23 is 30 trade days apart
add 30 trade days to march 23rd i get may 7th
that is 16 trade days from now .
I have mentioned before june 6th as a technical low based on a sideways pattern which if in effect targets a sept 8-9th high .
and lastly mercury retrograde is over .
Mercury Retrograde Dates 2018
In 2018, Mercury will be only be retrograde during the date ranges of:
March 23 to April 15
July 26 to August 19
November 17 to December 6
Peter G,
Wow! Thanks for guidance! Now that you mention it…I have not followed AAII and Investors Intelligence simultaneously. I am pretty sure that Investors Intelligence has been around for decades and never considered comparing the two.
I mentioned AAII because I considerd the17.1% as bearish. I read the AAII number which was quoted in something I read. Thanks again for the guidance.
A new post is live at: https://worldcyclesinstitute.com/expect-volatility/
This website is for educational purposes relating to Elliott Wave, natural cycles, and the Quantum Revolution (Great Awakening). I welcome questions or comments about any of these subjects. Due to a heavy schedule, I may not have the time to answer questions that relate to my area of expertise.
I reserve the right to remove any comment that is deemed negative, is unhelpful, or off-topic. Such comments may be removed.
Want to comment? You need to be logged in to comment. You can register here.