The 172 Cycle of Tough Times |
The 172 year cycle is one of the more important ones. Historically, it’s associated with financial collapse, colder climate, civil wars, social unrest, and epidemics. This cycle topped in 2007, along with the market.
We’re also at the end of an even larger 516 year cycle (a climate cycle, which also has implications for major societal changes).
For example, since 1998, the climate on Earth has been cooling. And yet the United Nations is yelling from the rooftops that the world is going to burn up. However, governments (and associated bodies) are always last in to an idea—the operate on consensus of the herd. This horse has left the barn long ago.
This idea of man-made global warming becomes very hard to swallow when you realize it was warmer on Earth during the Medieval Period and that the current climate scenario was forecast by Dr. Raymond Wheeler decades ago. In fact, since 1998, the Earth’s climate has been cooling off and it has certainly becoming drier.
Dr. Wheeler writes in his book, Climate: The Key to Understanding Business Cycles (With a Forecast of Trends Into the Twenty-First Century),
“The cold phases of the cycle are dominated by various kinds of civil strike—civil wars, class struggles between rich and poor and between conservatives and liberals, religious wares, democratic reforms, emancipations, broadening of the franchise, colonization, migration, and piracy.”
To that end, Dr. Wheeler developed the “Drought Clock,” a forecasting tool that predicted a turn cooler around the year 2000.
But let’s thumb back through a list of most recent 172 year cycles to get an idea of their regularity and similarities across the board. I’m assuming the top of this latest 172 cycle to be the year 2007, the top of the US stock market (or beginning of the “Great Recession”).
| 1663 | |
|---|---|
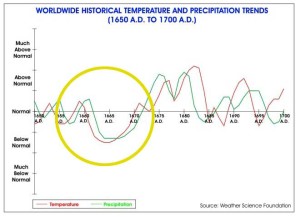 |
If you go back a further 172 years, you hit a major depression in England, followed by the Blubonic Plague in 1664 (one year later), and the Great Fire of London one year after that (1665), which burned the city almost to the ground.It began an 89 year bear market and was very cold and dry – the Little Ice Age they called it. It began 25 years of deflation and was the most severe depression in 500 years. But then, this also marked the larger 516 climate year cycle end. |
| 2007 | |
|---|---|
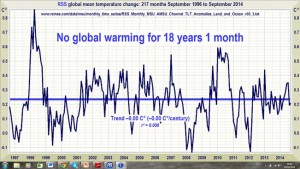 |
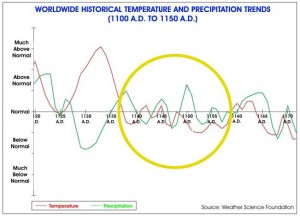
The chart on the left comes from the site of Christopher Monckton, who speaks around the world on Climate Warming (debunking it). Similar charts are readily available on scientific sites across the web. The pattern is not under dispute.The change in climate preceded the top of the market by approximately seven years (6.3 years is a less harmonic cycle).We’re expecting an even bigger financial crash to start to take hold this year (about 7 years past the top in 2007) and, in fact, the markets are heading down as I write this.Civil wars rage around the world, people are killing each other, and Ebola (which has been around for decades) has suddenly sprung up with the decline in social mood.The pattern is once again exerting itself. |
Are you seeing a pattern here? I hope so.
However, it’s not all doom and gloom. Quite the opposite. It’s a huge opportunity. Tremendous fortunes have been made in times of financial hardship. Look at the 1930s. Many families that are well-known in the upper echelons of society today made their fortunes during those very tough years and the years that followed.
The danger is not paying attention to the cycle we’re in—not getting prepared to be financially resilient. There are many who will pay no attention and end up in ruin. The smart ones will persevere, find new avenues to excel in, or hunker down and make their present situation indestructible.




You talk about the cooling cycle. My question is how do you know the cooling cycle will last 500 years and how bad wiil it be in the u.s
Jesse,
If you go to https://worldcyclesinstitute.com/global-cooling/ and look at the chart either on the page or in the video, you’ll see the time period between the warm spikes is 1030 years. It’s been that way since we have records. I don’t know the actual length going forward, but we’re at another 1030 year spike. The maunder minimum was a couple of hundred years and the 172 turn date was 1663 (large financial depression, fire of London, Blubonic plague). That was only a 172 year cycle, not the larger 1030 cycle, which is far more intense. I’m simply extrapolating from what’s happened in the past.
Good afternoon,
after reading your excerpt on the eminent downward trend of markets I wondered that if the grain prices followed the stock market down, could we expect a time of higher grain prices in lei of food shortages?
Michelle,
Good question. You would think so, since we’re going into a world-wide drought. On the other hand, reduced demand during a depression has reduced prices in the past. I give you this pdf file as background: http://history.uwo.ca/Conferences/trade-and-conflict/files/marchildon.pdf
So I don’t know the answer. Typically commodities tank just before a depression takes full hold, which is what they’re doing (or have done). What will happen regarding food futures, I’m not sure.