
On Being Bearish (and personal attacks)
 I seem to get pulled back into the question of decency on this site, which I honestly find to be a huge distraction, and keeps pushing me to do what I’ve been told is the intelligent decision and shut down the comments area of the free blog. But while it’s up and operating, here’s the rule: No personal attacks. You can be a bull or bear or a “sideways” advocate. I don’t care. But there’s no need to personally attack each other over it.
I consider this site an extension of my home. It’s an open invitation, but I happen to believe respect is important. At 67, perhaps that’s considered “old world.” So be it. I would like intelligent conversation, which can result in differing opinions. But, I believe you can have disagreements and still be respectful.
In the process of attempting to uphold this simple rule, I’ve been accused of all kinds of things, particularly of being a perennial bear. Let me be quite clear about that accusation:
It’s true. I am a bear!
In fact, if I could figure out how to be more bearish, I would be. It’s actually the whole point of all my writing here. But I don’t care if you’re on the other side of the market. However, I can’t be, because the work that I do tells me otherwise.
You see, I practice the Elliott Wave Principle. Since 2009, the US indices have been in a corrective wave. That’s bearish. That’s what the wave structure tells me. In fact, every single asset I cover is in a corrective wave (and has been for a very long time). I would be an extremely inept EW analyst if I didn’t pay attention to that fact. Believe me, there are lots of them out there. I fight that fact every day.
You might think I’m stubborn. In terms of Elliott Wave, you’d be absolutely correct! I’m also controversial, as a result. After over fifty years of a chronic health condition and building two million dollar plus businesses in spite of it, sticks, stones, and words don’t affect me all that much anymore. I haven’t seen everything, but I’ve seen a lot.
I also lost one of those businesses due to a self-styled “investment banker” who I believed. That was a big mistake and I ended up having to close down a million dollar business, and subsequently completely lost my self-esteem. Over time, I got it back, but I’ve developed a very thick skin, as a result.
Although I eventually re-built that business, I eventually lost interest in the corporate television profession (you can never really “go back” to what you had), and got the “market bug.” Through my research (after a few years), I latched onto Elliott Wave Theory done badly by Elliott Wave International. After getting burned after the 2008 recession by those bad calls, I determined that I would become more proficient in EW analysis than my contemporaries. It takes strict adherence to the key principles, but there are more rules that I’ve learned simply through studying EW and the market over 40 hours a week for several years. Over the past ten years, that’s slightly over 20k hours.
Over time, I’ve discovered a number of errors in the Elliott Wave Principle book—that’s not a criticism; after all, it’s an amazing piece of work. But the errors don’t help the EW cause.
As a professional speaker, I’m well aware of the adage, “Speak about what makes you crazy.” This site is a result of that saying.
To that end, this weekend I’m sharing (which was pre-planned) the wave down in 2007-9 that set me off to be as precise and correct in Elliott Wave analysis as I can be. Beat me up for it, but it’s proven to be quite profitable.
EW — Corrective Threes and Impulsive Fives
One of the core elements of the Elliott Wave Principle is understanding the role of “corrective” versus “impulsive” wave structures. Mastering this aspect of EW Theory is key to dramatically lowering risk in any market. Many EW analysis get this simple principle wrong. It’s this error that is without doubt the most frequent issue with Elliott Wave analysis—you must develop an eye for patterns and be as objective as possible in your approach to the market. Any bias invariably changes the count (subconsciously).
The concept of three vs. five is itself a simple one: a three wave structure will eventually completely retrace: Three wave structure is corrective.
A five wave structure, on the other hand, in most cases, means there’s a B wave correction coming (a partial retrace) and then another wave following in same direction as the original wave—a C wave.
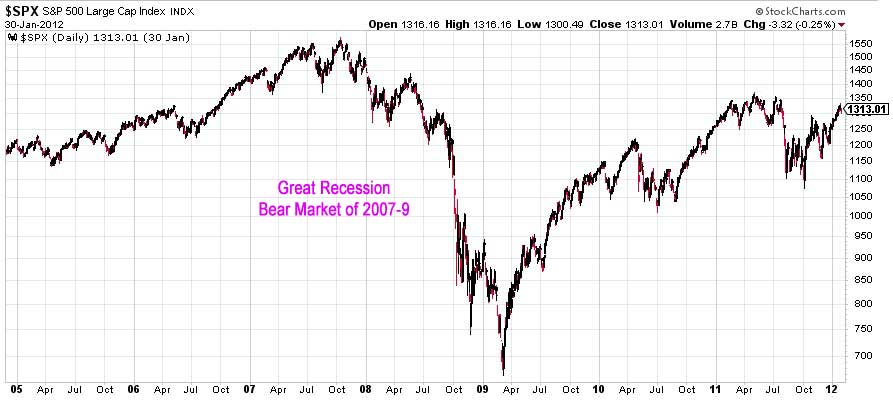
Above is the daily chart of the SP500 showing a seven year period from 2005 through 2012—what’s been referred to as “The Great Recession.” (click to enlarge)
What you’re seeing here is the wave down from 2007 that EWI (and others) still classify as an impulsive wave. It is not, it’s corrective. That means it will fully retrace to the upside. Because of that inept analysis, I lost quite a bit of money (I was not analyzing EW at that time, but it became “the last straw”). Lesson: Do your own research, form your own opinion. I tell my subscribers to have their own system and use my analysis as confirmation (or not).
I’ve been clear from the very start that unless the market is in position that makes the count dubious, I will take a position, either bearish or bullish, unlike others who tell you it will either go up or down (with two opposing counts). I’m a trader. I can’t trade that kind of nebulous, indecisive guidance.
In the chart above, to the trained eye, the look of the wave down alone is enough to flash warning lights. The large second wave is far too large relative to the fourth wave. It’s “top-heavy.” The look is not correct for an impulsive wave. It looks like a “three.” Looking under the hood confirms it:
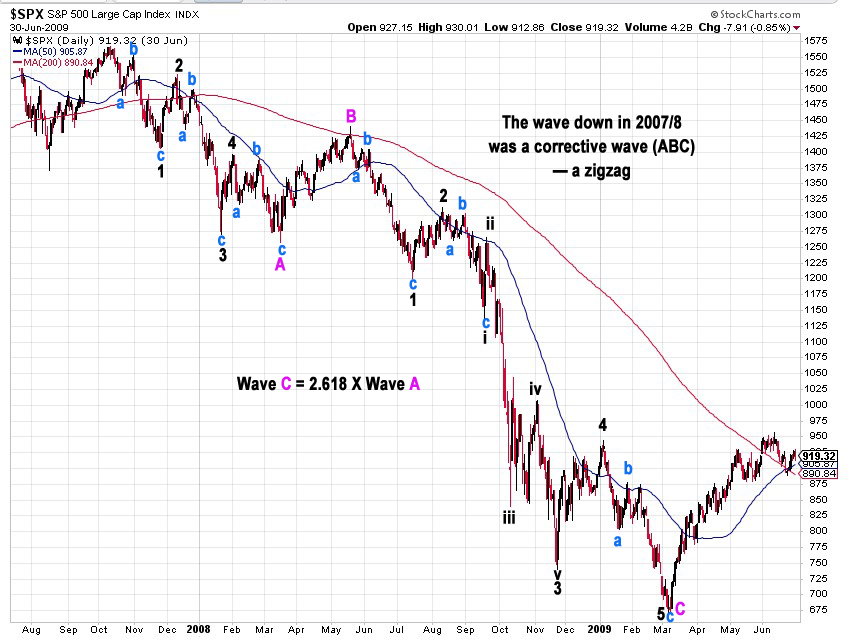
Above is the daily chart of the SP500 (click to enlarge) spanning the period of mid-2007 (the top of the bearish wave down) to mid-2009 (a few months after the wave bottom. What’s important here are the purple letters. This is a zigzag. There’s a purple A wave down of five waves, then a purple B wave in three waves, and finally a purple C wave that is exactly 2.618 X the length of the A wave, a typical length for an extended C wave. There are no fourth and fifth waves.
It was a corrective wave, which means it should complete retrace. It did, but most people got it wrong.
This is the importance of the three wave versus five wave count and why it’s so important to look at sub waves and be exceptionally stubborn in the application of the Elliott Wave Principle. I know the powers that be still think the wave down is impulsive. Not my problem; I know better.
A Higher Tide Floats All Boats
 Whenever we get close to a major top in ES (emini futures), the comments start to flow predicting a top (or not). Usually these comments seem to come from those fixated one one index—the SP500. But, the market actually consists of more than one index, and the driver of the entire thing is the US dollar (the reserve currency).
I have always maintained that once one index tops, they all have to (so that they stay in sync). This is a “market rule.”
But it’s more than this that keeps the SP500 from not topping until the others top. The next wave down will have to start with five waves—across all US indices. So to get to the point where that can happen, the indices all need a “fresh start”—in other words, a new high.
The key, as I preach over and over again, is to watch the entire market, certainly indices that are related to each other. Both the SPX and DOW are subsets of the NYSE. They move more or less together. The wave structures have to be correct in order for the next wave down to start.
In all US indices, we appear to have two more subwaves left to go—one down, one up. The NYSE is the one to watch as it’s the only one left not at a new high.
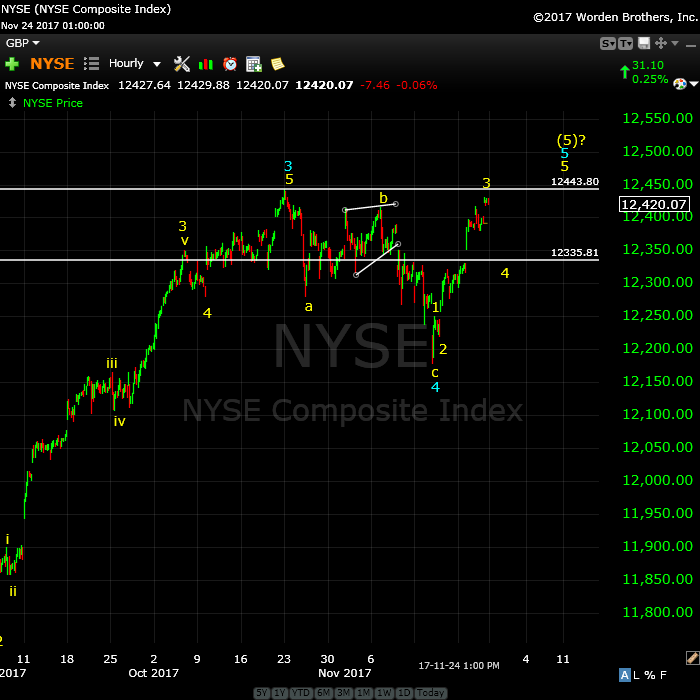
Above is the hourly chart of the NYSE Composite index. It’s what I call the “straggler” in terms of the US market major indices. All the others sub-indexes have now reached a new high (DOW, SPX, RUT, IMW, etc.). Even the Nasdaq exchange indices are at new highs. But ES (SPX futures) and the NYSE are not. However, they’re very close and will both reach their tops after a fourth sub wave down and a final wave to a new high.
______________________________
A true expert in Elliott Wave FL 2
A true expert in Elliott Wave …You are a true expert in EW analysis. What you provide is not available anywhere and is priceless. Subscription on your services is the best thing I have ever done. Many thanks for your effort to make me a better investor. I now have more trust in my investment decisions. I hope you will continue the excellent work! —FL |
Rise above the rest … SM 2
Rise above the rest …I have only ever met a few people who, in their chosen fields (astrology, medicine, music, martial arts, technical analysis), rise above all the rest and you are one of them…you have ‘the gift’…and that’s why I’m a Trader’s Gold member. —SM |
Have not had a losing week RW 2
Have not had a losing week …I have been with Peter almost a year. The only thing that matters is have I made money with his service. I think I have finally turned the corner using Peter’s EW. I have not had a losing week in the last 5 months. Thanks Peter, for your amazing amount of hard work. —RW |
Get an upper hand … JC 2
Get an upper hand in trading …Seeing all the different currency pairs and the wave structures and hearing you explain why this has to do that on a nightly bases gives one a upper hand when trading. Elliott Wave applies to all stock and indices and can be applied to any candlestick chart. If someone ask what you want for Christmas – Tell them a membership to Peter’s “Traders Gold!”—JC |
Tops in your field DZ 2
Tops in your field …You are tops in your field. Tried to follow Elliot Wave international for years. They were always behind the market. After discovering you, I perceive that you are an expert in reading the waves, which puts you way ahead of the rest of your peers. And you can read the Waves like you are reading tomorrow’s financial section. I pray you stay healthy. —DZ |
Couldn’t be happier … KK 2
Couldn’t be happier …The analysis and insight you provide is simply amazing! I’ve been trading the futures and equity markets for well over thirty years and usually average around 5% monthly. Since joining your Traders Gold Service two months ago, that number has better than doubled. I couldn’t be happier.—KK |
The best of them JL 2
The best of them …Last couple of years, I subscribed to several ‘market traders’. You are by far the best of them and the personal contact is awesome. Daily and daily updates are very well written! Besides your expertise in EW, I also like your cycles analysis. Best investment I ever made! —JL |
the real deal SM 2
The real deal …‘Educational, insightful and thorough market analysis for all levels of traders. It’s Elliott Wave at its best….Peter Temple is the real deal’ —SM |
The Market This Week
Here's the latest daily chart of ES (emini futures)
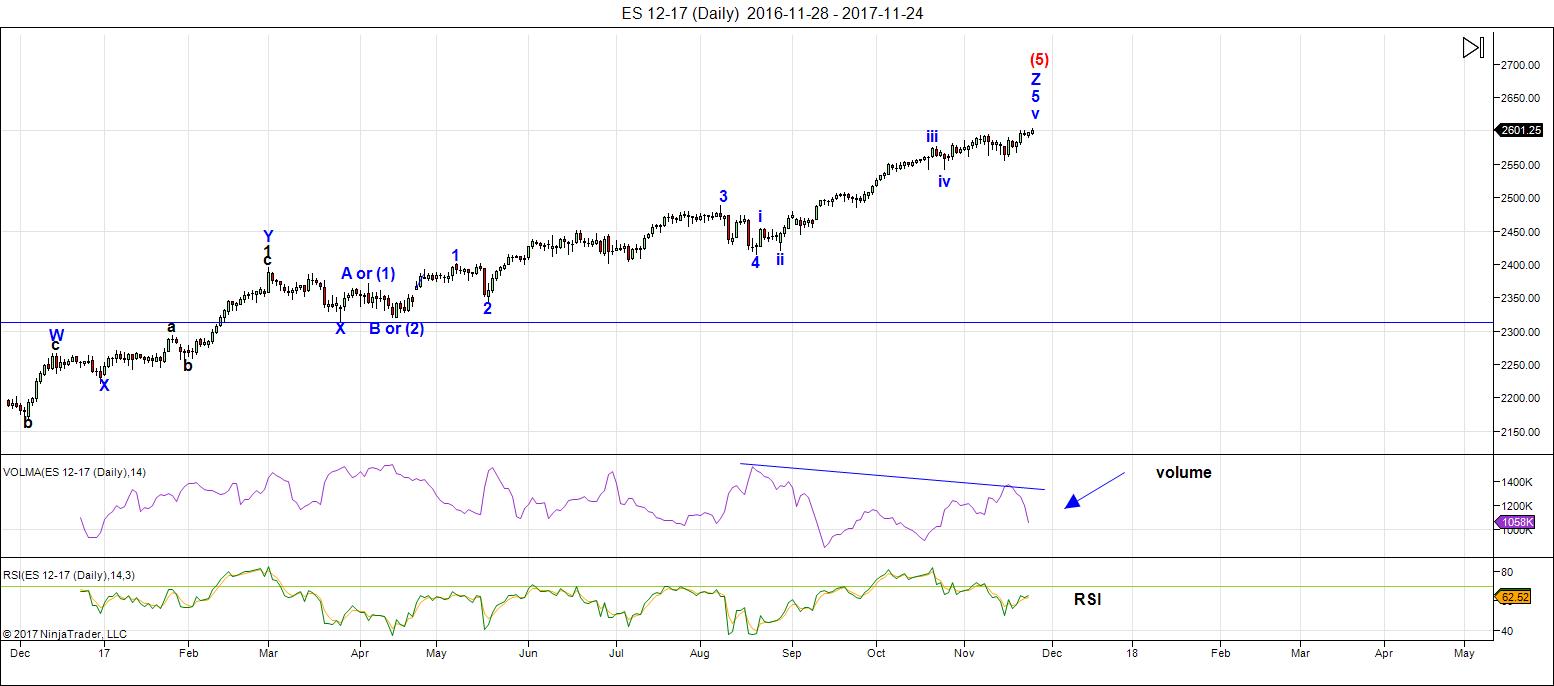
Above is the daily chart of ES (click to enlarge, as with any of my charts).
There have been no material changes to my prognosis. We are at the high. I expect this final wave to breach the previous high for the final time.
We're now down to hourly charts for all the action. It's been a day trading environment for the past few months.
Volume: Volume has tanked in ES, which is a well-documented phenomenon that accompanies ending diagonals at the top of a market. RSI is showing the expected divergence.
Summary: The count is full for the US market in general, except for small subwaves that form the balance of a motive set of waves in SPX and some other major US indices. ES and NQ (emini futures of SPX and NDX) are tracing out ending diagonals. This weekend we should turn down into a fourth wave and then eventually up to a new high ... and we're done. Based upon measurements within the ending diagonal, I'm looking at 2620ish in ES as the potential final high (although the final wave could extend or compress).
_______________________
Here's the latest 60 MIN chart of ES (emini futures):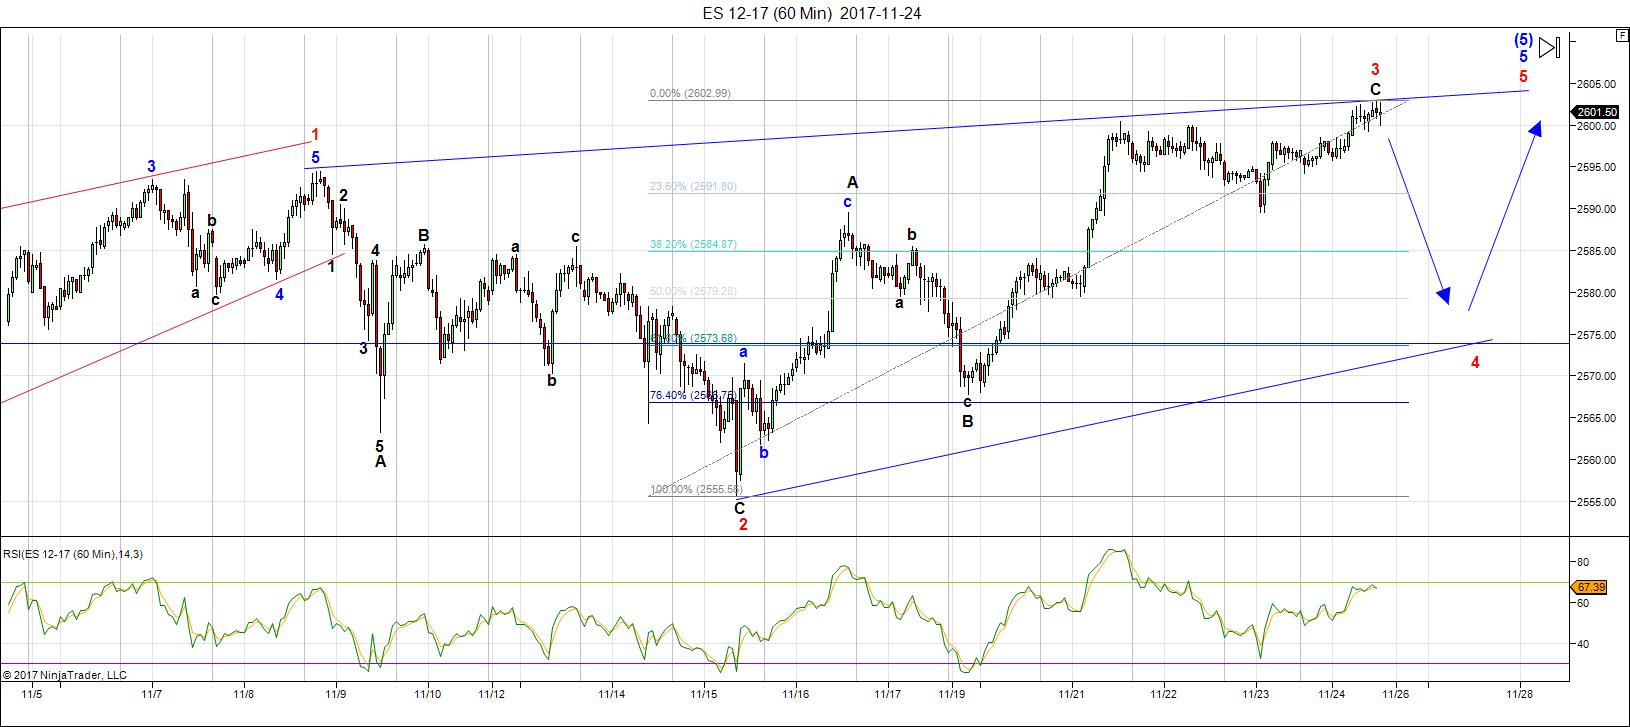
Above is the 60 minute chart of ES (click to enlarge). (commentary reserved for Trader's Gold subscribers)
___________________________
Trader's Gold Subscribers get a comprehensive view of the market, including hourly (and even smaller timeframes, when appropriate) on a daily basis. They also receive updates through the comments area. I provide only the daily timeframe for the free blog, as a "snapshot" of where the market currently trades and the next move on a weekly basis.
______________________________________
Sign up for: The Chart Show
Next Date: Thursday, December 7 at 1:00 pm EST (US market time)

The Chart Show is a one hour webinar in which Peter Temple provides the Elliott Wave analysis in real time for the US market, gold, silver, oil, major USD currency pairs, and more. You won't find a more accurate or comprehensive market prediction anywhere for this price.
Get caught up on the market from an Elliott Wave perspective. You’ll also get Andy Pancholi cycle turn dates for the SP500 for the balance of the current month. There’ll be a Q&A session during and at the end of the webinar and the possibility (depending on time) of taking requests.
All registrants will receive the video playback of the webinar, so even if you miss it, you’ll be sent the full video replay within about an hour of its conclusion. For more information and to sign up, click here.


Another well written post. Thank you again for an interesting read.
🙂
Thank you Peter
I have allowed myself this entire year to adjust from being bullish
To bearish
Amongst many reasons to be bearish I’ll now include the benner business cycle
Which has a very impressive yet not perfect track record .
For those interested you can read here :
http://www.davidmcminn.com/pages/brenfib.htm
Hi Joe,
Thanks for the link to Benner. I’ve read lots about cycles, Armstrong’s is good but not good enough for trading imho, Benner likewise. As Peter points out above, doing ones own research to plug in the gaps in terms of other people’s theories/analysis is the only way to trade with confidence, that way you understand the limitations and don’t bet the farm.
I took Armstrong, Benner and Dewey’s work into 9/18/36/54 year cycles and made my own cycle. The difference between me and Armstrong, Bradley turns etc is that I made some specific predictions in terms of highs and lows, which I need in order to trade. My cycle is good in my opinion, but can’t be traded alone. So I use shorter cycles plus TA to assist.
https://goo.gl/images/lvDBNN
John Hampson of Solarcycles.com predicted a turn in 2014, I said 2015. We agreed to disagree and that time would tell. A year is a long time in trading. Unfortunately he suffered financially and health wise and has stopped trading I believe.
Experienced traders are always alive to the fact they are wrong, newbies are looking for the holy grail that will make them rich and at some point believe they have found it, a most dangerous time. But we’ve all paid our tuition to the markets.
All the best to all readers of this board and of course Peter for hosting and facilitating discussion through his weekly posts.
Kerry
Ps the image isn’t clear but if you click visit it takes you to the original page
Yeah, Benner was an intertesting guy.
Table 2
THE 54 YEAR CYCLE OF LOWS COMMENCING IN 1913
Add A J Frost 56 Yr Sq
36 ysc S1 US Event DJIA Bear Market Low
1913 Sq 41 1913-14 Crises 7/1914 – 6 Months Late
+ 20 1933 Sq 05 Great Depression 7/1932 – 6 Months Early
+ 16 1949 Sq 21 Recession 6/1949
+ 18 1967 1966 Crisis 10/1966 – 3 Months Early
+ 20 1987 Sq 01 Black Monday 12/1987
+ 16 2003 After Greenspan Bubble 10/2002 – 3 Months Early
+ 18 2021 ???? ????
————-:::—–:———–
Table 3
THE 8-9-10 YEAR CYCLE OF DJIA MARKET HIGHS
1900 – 2010
Add
A J Frost
Major DJIA High
DJIA Bear Market
1902 June 17, 1901*
7 months early 6/1901 – 11/1903
+ 8 1910 November 19, 1909
2 months early 11/1909 – 9/1911
+ 9 1919 November 3, 1919* 11/1919 – 8/1921
+ 10 1929 September 3, 1929* 9/1929 – 7/1932
+ 8 1937 March 10, 1937 3/1937 – 3/1938
+ 9 1946 May 29, 1946 5/1946 – 6/1949
+ 10 1956 April 6, 1956* 4/1956 – 10/1957
+ 8 1964 February 9, 1966*
14 months late 2/1966 – 10/1966
+ 9 1973 January 11, 1973* 1/1973 – 12/1974
+ 10 1983 No High (a) No DJIA Bear Market
+ 8 1991 July 16, 1990*
6 months early 7/1990 – 10/1990
+ 9 2000 January 14, 2000* 1/2000 – 10/2002
+ 10 2010 No High Correction only
+ 8 2018 ???? ????
(a) 11/1983 marked a record high and the beginning of a -14.89% correction market that persisted until 7/1984.
It’s just another of many bearish Windows opening
I won’t claim to know how bearish the market will be
Yet I won’t fight all of these cycles if this market proves
Them all correct .
Lizh
Peter summed up what I was saying in regards to the football game.
🙂
Peter,
Let me tell you that once those guys got burnt by EWI and they will learn to,appreciate you.
I was with EWI for 10 years and when I found you I switched ASAP.”Let me repeat , this is not a paid advertisement”
I can assure you that your one the best out there. I am definitely renewing my subscription tomorrow as I was too busy to renew it last week as it expired.
I know you are right because you are aligned also many astro’s indicator.
Sometimes you are early but hey no one is perfect .Being right 90% of the time is good enough for me.
Good work!!!!!!!!!!
Thanks, Vincent.
Thanks Peter …nick
🙂 Still here, eh?
OH yes , Try to not comment to much….nick
I also got burnt by EWI. Frankly I am surprised that they are still in business. They consistently get slammed by Hulber’t as being the absolute WORST, when it comes to forecasting market direction correctly, whatever the time frame. I am going to say something that sounds like hyperbole but is the absolute truth. I got so frustrated with Hochberg’s consistently wrong counts, especially at critical market junctures, that I started doing the exact OPPOSITE of what his counts suggested, and VOILA! I actually started to make profitable trades! It was the most uncanny thing I had ever seen. I even started to wonder if EWI was deliberately misleading its readers! As I learned a bit more about EWT, it became clear that one of the most egregious errors of Hochberg’s analysis was a complete ignorance expanded flats. He ALWAYS got them wrong, and foolishly continued to indicate new impulses underway on the basis of new b wave highs. I did not think that ANYONE could commit the same error so many times and not realise it, hence my wondering about intent. I sent him a number of e-mails immediately after counts he made that I suspected were wrong and suggested he at least give readers the other possibility. He response was “We do the best we can”. No they don’t. These people are not to be trusted. You will blow up your account of you follow their counts. Sorry if any fans here are offended but it’s the truth. This is my own opinion, and NOT necessarily the opinion of course. of this site’s host.
No, that’s pretty much my opinion, too … lol.
Thanks again Peter T for the great reminder. Please remember you don’t have to defend yourself to the majority of us. We do trust your honesty and appreciate it!
tks, Jeff.
Kerry
Thanks for your insight 🙂
I completely agree that doing our own research is a must .
peter,
…..i have “issues”………#1 i am way too “smart” for my skinny jeans…….. #2. i am way too smart for my “fat” jeans………………………. #3. i am way too “smart” pants in general………………….. AND #4…………… your subwave count of the wave 3 in the ED of the ES……… i see you counted a w4 of C of w3………but your w5 of C of w3 is in 3 waves……… three waves…………….. The only reason i highlight this, is because this week is all about …….”3 waves versus 5 waves – THE PETER TEMPLETON STORY”.
I am of the notion that we completed wB of w4 of the ED of the ES…… please see chart attached…… i also have a “secondary” ED for the ES [the steeper ED with the teal colored trendlines]……………….
https://invst.ly/5y18s
EDs should consist of zigzags, which this one does. There is a fairly consistent look to C waves of EDs. Why are people calling me “Temple … ton?” What am I missing?
peter,
my most humble “surname” apology…………..LOL…………….i had “Franklin/Templeton on my mind………………………. please refrain from asking “WHY” i had Franklin/Templeton on my mind……………..
Oh, then I’m being “classed” with my buddy Benjamin … we’re about the same age, I think (although he’s been a bit quieter I’ve noticed over the past coupla centuries). That’s OK then.
Another thank you to Peter for his analysis and keeping the free forum open. I would miss a number of the posters here if it were to be shut down. God bless.
Great articles Peter,
Ignore the arm chair critics. The world is full of them?.
You are in a class of your own in terms of analysis.
Monday mornings always feels better after I read your
Valuable articles,
Love your work
Phil
Sydney Australia
Thanks for the kind words, Phil … from the other side of the world. 🙂
(the lands of the duelling real estate bubbles)
That particular bubble down-under is just about ready to go “pop!” 🙂
Sure looks like an ED in ES on five hour chart. Potential wave wave four precisely touches top of wave one at 2589.50. It does not get any more razor sharp than that…. 🙂
verne,
ok my leige……….. i “5-houred” time frame the ES……….we need to turn here, or 3 will be longer than 1…………..
https://invst.ly/5ye71
verne – i “couldn’t” help myself. I am a “whipsaw” megaphone topping pattern “junkie”………………………… I need an intervention!
https://invst.ly/5yevd
Yep! Much better than my eager beaver- thesis… 🙂
Anticipation…where is Carly when we need her?!
verne,
“carly”…….are you talking about Carly STEMPELMIER???……..if so, ahhhh…..”carly” i loaned you that 100$ – 5 years ago!!!! ………….[cough]………………
ah carly – “i gots to get paid!!!”………………….@ 9.5% interest, compounded monthly………….
At that rate, she is going to have to get another loan from old boyfriend JT! 🙂
verne, i am reticent about December 3, 2017………….what are your sources telling you, if anything, of this day [which is 6 days from now]………….is it a day of interest??
Let me do a bit of digging…
v,
i am being told the word “sharks” and the date of dec. 3rd……..hmmm…
Looks like a few short term cycles are calling for a Dec 3 low…possible wave 4 bottom?
https://worldcyclesinstitute.com/the-last-spike/comment-page-2/#comment-24419
“WADR to all the folks tossing out dates about what is going to happen and when, it has to be clear to all of us who have gone down that path that it is one of futility.”
Who said that??!! 🙂
It is possible this wave up could be extending. I personally still think a possible wave four ended with the thrust out of that triangle formation and the fact that we have not had a swift reversal after the upward thrust could mean it was a small degree wave one of five up with a second wave correction now underway…just my two pence…not by any means predicting a top just in case rotrot is concerned! 🙂
hmmmm……. verne,
thanks…………although – it would serve us well to “look” for any unusual and extraordinary options action in either “the defense” contractors OR the big banks for this week going into 12/3……………… cough………………………….is that something you can look for??
Yep! It is really amazing the kind of trades you can spot setting up in the options arena. This is the special domain of Dan Levy, a trader with Bottarelli Research who looks for these option “Whale” trades to predict monster moves in the targeted stock.
Will check open interest for that time window…
I am seeing more and more EW counts with smaller degree waves of greater length of size and duration than the corresponding higher degree wave. I think the rule or guideline is that it should not break a channel formed by a larger degree wave but I am not sure if the rules speak to relative wave size and duration. While it looks really weird, people seem to think it does not violate any EW rules. It all seems quite counter-intuitive to the idea of wave degree though…interested in some informed perspectives if anyone cares to comment. Thanks!
Price action in Square today highlights the shape of things to come. Think the market cannot give back 16% in a few hours? Why not?! 🙂
FYI. This guy is really smart when it comes to financial matters. Everyone who reads here knows that I am living on the somewhat bearish side of life. Nonetheless, when people like this with all kinds of technical savvy start talking about markets using this kind of language it should make your spidey sense start tingling….it does mine… 🙂
http://www.zerohedge.com/news/2017-11-25/francesco-filia-worlds-twin-asset-bubbles-could-collapse-under-their-own-weight
go to the 60 minute + mark of the interview and listen to Kevin Muir discussing the coming collapse of the short VIX trade…it is scary!
Shhhhhhh….! we don’t want to wake up the massive shorts too soon…let them keep sleeping for a bit longer…..I got some more positions to fill…! 🙂
you obviously haven’t listened to Muir!
Oh really now? After all at stuff I have been saying on this site for months now? Clearly the blow up of the short vol trade has to be structured to take into account what is going to be disastrous absence of volume. Only blind traders will fail to take that into account. 🙂
BTW, the quant guys have already figured out that the unwind trigger level for vol shorts i is not the possible 37 spike level for VIX that Muir suggests, or even 18.00, but as low as 15.00!!!! Think about it….!
Another thing I have posted on several occasions is that you are probably not going to be able to trade the third wave down, as some exchanges are probably going to go out of business, and not just because of the short vol trade. If you don’t take the money and run after riding the first wave down and the 62 % retrace. Muir is right that you will probably not get paid…that is a no-brainer….
1:22 mark through the 1:24 mark is key!
verne,
here is an “alt count” for a “new” ED in the ES…… if for some chance we head higher tomorrow……..then this count should be considered….https://invst.ly/5yjq9
oh yeah, and verne…..why i say we “might” head higher……..
the nya today retraced a minimum 23.6% today in a “potential” wave 4…..we are waiting for only the NYA to make a new high………… see for yourself….
https://invst.ly/5yjse
Yep. I think we are not quite done. I think we are going to get the signal from futures of the trend change, so if are still meandering overnight I do think we go higher tomorrow…
It has also been some time since I heard anyone talk about circuit breakers. I had forgotten that there are actually three per daily session at 6, 13, and 20% down, at which point the market closes for the day. The two first intervals are 20 minutes each.
verne,
here is daneric’s count of wilshire. we are only “days” from completing these subwaves…………..which makes my use of the word ……”hmmmm”……as it refers to 12/3 of so much more interest.
https://3.bp.blogspot.com/-yzDN6zpZDYQ/WhyOVEb-Y_I/AAAAAAAAd-c/PNIxxW5omYMvhv98cOREOdjKlVL2rognACLcBGAs/s1600/Wilshire%2B60.png
I agree. It looked like a 62% retrace of the move up yesterday. I know it can’t be a triangle if it some kind of second wave. At any rate, new highs ahead.
As improbable as it seems, it sure looks like yet another triangle of some sort. Upside breakout expected owing to its start. Trend change being vociferously resisted…completely nuts!!
Verne
Clearly the blow up of the short vol trade has to be structured to take into account what is going to be disastrous absence of volume. Only blind traders will fail to take that into account. ?
You really think the ” blow up ” in the short vol trade will happen on ” low volume ” ?
And I’ll add. Do you really think you won’t be able to trade the 3 rd wave down ?
If all hell breaks loose and you can’t get paid just where are you going to run to ?
Lastly, is this your trading strategy, fight the market until you finally catch wave 1 down
And 2 up only to run away as a total collapse unfolds wiping you out because no matter
Where you put your money you won’t get it back ??
Why even bother trading under that thesis ?
If you ask me, I’d much rather take my chances being short the entire way down.
Volume in the market has been declining for years, as we have gone higher, and that is not a good sign despite the incredible current evaluations. I expect there will be lots of folk wanting to sell, but who is going to buy?
Kevin Muir said something that I had not thought about in that interview. I always knew the buyback of the short futures trade was going to eventually be hell to pay with terrifying premiums of several hundred per cent. He has also suggested that there may be NO ONE, willing to let them unwind the positions, and that the issuers of these instruments could end up BILLIONS in the hole as the market blows up. I am conflicted about leaving my money in the market during the coming tsunami. What good is being right on the trade if your brokerage goes out of business? Remember these funds carry no insurance whatsoever when in the market. I suspect that is one reason or the reckless conduct we have been seeing from some folk who have no intention of paying the piper when payment comes due. My plan has always been to take out all monies that I cannot afford to loose ahead of the third wave down. I am not suggesting that everyone does this, but that will be my approach. I fully expect some bids to disappear in what’s coming…
BTW, your comment about “fighting the market” is funny. One thing I have learned a long time ago, as I am sure you have as well, is that when it comes to price, Mr Market is ALWAYS right, not matter what I think, so I am far less interested in “fighting” Mr. Market, than I am in making profitable trades my friend…. 🙂
There will be buyers in wave (1) and (2) AND in 1 and 2 of (3). Its only when we get to 3 of (3) when things will get really nasty. In November 2008, I had a tough time monetizing my trades simply because my brokerage account froze. There was so much traffic, that I did not know if my orders were filled for 20 minutes.
Hi Vik.
Clearly you are a trader. I get so frustrated sometimes trying to respond to comments from people who it would appear have not spent much time actually TRADING.
You are quite right. It happened last time, and it will be FAR worse this time around. Accounts are going to be frozen, orders will remain unfilled, bids will in some cases disappear, and many accounts are simply going to be lost when brokerages go under. I sometimes get the impression that a lot of folk have no idea what is coming their way. While it might be possible to trade the third wave, I think it will be very risky and I would do it ONLY with money I can afford to loose.
I also expect to see a surging about of outright fraud in the markets with spreads that border on plain and simply criminal. What does it matter for example, if you are sitting on say option trades that have gone up ten-fold but there are not bids when you try to sell them, or the market makers are bidding only a fraction of what they are worth? Can’t happen? I have seen it happen even when we were not in a crisis. Imagine what things are going to be like when all hell is breaking loose…
Joe,
Could you elaborate on the comments you made to Joe? Thank You!
…comments you made to Verne!
I am going to say something that I probably should keep quiet about but would certainly like to be told if I had not heard it. A few years ago I pressed Prechter on the exact same question you posed. I wanted to know why he was always stressing the safety of either cash or short term treasuries during the coming crisis. Why not put everything in on the short side and ride that baby down? What he told me at the time was quite sobering but frankly sounded a bit alarmist and far fetched. Subsequent developments makes me think the man had inside info. When the banisters brazenly made “bail ins” the law of the land, that finally convinced me. I will leave it at that.
I expect the market will hit my 2610 target later today and I will be exiting all but one of my bullish 258/256 bullish put spreads. The risk on the last spread is only 200.00 if SPY moves below 256 next week but I suspect it will be clear by then whether we have a top or not. Have a great day everyone!
PUT “spread” – THIS VERNE,
it looks like an ED happened in the wC of w3……https://invst.ly/5ytfr
Looks like one more correction before the final wave up. Reversal on that last wave up should leave no doubt. EDs usually retrace rapidly to their inception so the next day or two should be most interesting….
I like it! 🙂
Target hit at 2610. There may be a bit more upside but risk reward diminished in my humble opinion. I am out. I have never been able to label these thrusts out of triangles correctly according to EW rules but they are really a great “bread and butter” trade as they are so predictable. I love ’em!
I am on the sidelines waiting for a top…..
yeah, i am unsure of the triangle of which you refer, but the contracting ED is out as w3 is now larger than w1……. although a megaphone pattern is still there…
https://invst.ly/5yu3a
I used to really doubt myself on patterns I thought I recognized but did not seem to meet the EW rules. I have subsequently learned that it is ultimately getting the direction right that matters, not getting the exact rules to the letter. Of course there are all kinds of triangles beside contracting ones such as running, barrier, expanding etc etc. I just can never keep them straight. I do know one when I see it though and the simple rule that will give profitable trades more often than not, is noting what the direction the triangle is initiated from. I like to keep things simple! 🙂
verne,
triangles aside,…..all eyes on the NYA, we still have to make a new high there, and we are very close
https://invst.ly/5yu6r
I mentioned in an earlier post that for a final wave up, I would expect VIX to show divergence and move up along with market price…
On the matter of synchronous new highs. I seem to recall that at prior market tops not all markets did. In fact it is the failure of DJT to confirm new highs that gives rise to the DOW non-confirmation theory….am I missing something?
Blow off wave?!
luri, looks like we that new 52 week high in $NYA, albeit with notable momentum, macd, and volume divergence….
yup verne,
nya new high
https://invst.ly/5yun-
There is a good chance we are seeing a wave extension…
verne,
it could be a “capitulation” thrust we are seeing. https://invst.ly/5yv3i
nya https://invst.ly/5yv4f
Could be. I am absolutely fascinated by the refusal of VIX to head South in the face of the furious ramp higher. Does it know something??!!! 🙂
yes this thrust is “terminal”….. this IS the last spike!!!
we have overthrow….https://invst.ly/5yw0v
Peter,
What do you think of this move, I know you had been projecting 2600 to 2580, is it invalidated now.
Bill
There was what appeared to be a smaller ending diagonal that got invalidated, but the larger move is still a third wave of the larger ending diagonal. Other than that, nothing else is invalidated. That’s in ES. IN SPX, it looks like a similar situation. You always take the larger top from the measurement of the third wave (but this one is obviously not finished yet). What’s extraordinary to me is that ES and SPX are on their own. Everything else is going in the opposite direction. NQ has just been sitting, waiting.
Thanks a lot Peter. When you get some time please post a chart of the larger wave you are projecting. Appreciate your effort.
On the weekend will be the earliest, I’m afraid.
hmmm……so i am seeing a valid ED in the ES.
we have overlap, a/b/c for each leg, and w1=33.62 pts, w3=32.5pts, and w5=19.75 pts so far……..
https://invst.ly/5yvm-
hmmm….
and here is the NYA making a new high, and what looks like a w5?? https://invst.ly/5yvsf
I learned from Bryan Bottarelli to not take all of my profits from a winning trade at once but let a small position ride, even after your target is hit. It is really incredible how that can turn out sometimes. Instead of a 50% pop on the earlier spreads, the last one is sporting a 90% return. Yikes!
I got out a bit too soon, but that is what a whipsawing market will do to you. It is always better safe than sorry. As someone said, no one ever went broke taking a profit! 🙂
verne – where is jody these days?
terminal.
https://invst.ly/5yw6p
I was wondering…has she abandoned us??!! 🙂
verne,
jody is a “HE”………
Oops! Sorry about that Jody….Sir! 😉
Well, at least it’s not as bad as “Pocahontas” … lol
Luri, I decided to switch back to currencies until this stupid market tops. When we get that nasty down day that closes at the lows then I will be paying more attention to it, but I am not really following SPX ATM.
I do however pop in though from time to time to see what my peeps are talking about:) But no one really talks USD/JPY on the blog.
I do have to say I am shocked to see a 255-25-33 up day when NK firing missiles. It makes no sense to me. SPX at 2627 is stupid in my opinion. I agree with Peter – “if I could be more bearish I would” but for now currencies make sense and I like to trade when I have time and they run 24/7 6 days a week even during the Holiday’s:)
OK folks. I trade volatility. It is telling every trader right now to be VERY careful.
My positions are now all solidly in the green on a day when they should be WAAAAY underwater….
Brexit raises its ugly head. http://www.zerohedge.com/news/2017-11-28/sterling-soars-after-britain-eu-agree-brexit-divorce-bill-telegraph
I hear May is keeping details under wraps…wonder why? 🙂
…..ugly Brexit just needs a little “help” is all…………. maybe some BOTOX, a little COLLAGEN around the lips…….maybe a chem peel or two……and all will be FINE….. trust me!
we all need to ‘collectively’ breathe right now………and let the experts do their “un-ugly’ work……. :-))
I have one question for UK citizens. Are they going to sit still for their hard-earned sterling being handed over to these disgusting perverts like Juncker, to the tune of of almost 50 billion?!
Yes we are as we cant do anything about it 🙁
In the spirit of Xmas comity here is a free one for ya. If SVXY prints a bearish engulfing candle today, go do yourself some early Xmas shopping!
December 8 119 puts are looking particularly tasty….IF, we get a bearish engulfing candle…. 😉
update – https://invst.ly/5ywkh
Picked up a few SVXY Dec 8 119 strike puts for 4.75 per…nicely in the green already….
https://invst.ly/5yxdf …………….
Drum roll please?! 🙂
i have contended that we will have to “hit” the top blue line of this chart. It is from Shanky, it is the weekly spx. We were destined to ‘hit’ the top blue trendline before all was done……as you can see, it has contained prices since through this rise. We hit that mark today.
http://stockcharts.com/public/1129702/chartbook/379628021;
Beautiful Wedge!
verne,
daneric’s count of the wilshire dovetails well…….
https://3.bp.blogspot.com/-wiJy_LrZJOY/Wh3SO4djlxI/AAAAAAAAd-s/8Jp3h77Gv_kGZKkLfBfR2HVk25Xj5LroACLcBGAs/s1600/Wilshire%2B60.png
https://3.bp.blogspot.com/-QOA2RYZwGQM/Wh3TFegEBWI/AAAAAAAAd-0/jkIFFZu1vYkxBAA8NygQlS4OksTN4Q1HgCLcBGAs/s1600/Wilshire%2BDaily.png
We are indeed getting close methinks.
I have to confess. The absence of fear in this market is scaring me! lol! 🙂
I am seeing a LOT of good analysts who are calling for only an imminent intermediate degree third wave top. Frankly, the counts don’t look that unreasonable but there are too many other things that are shouting…TERMINAL!!!
Ed
I’d rather not elaborate on my comments .
I’ll apologize though for letting my difference of opinion
Get in the way .
My dates still stand Dec 1-3. Dec 13-14 th and Jan 2
And I’ll add another Jan 15-18 th .
24,211 basis the cash Dow is not a target yet it’s becoming my line in the sand .
That is a close only price.
I do not want to see the Dow close above it .
The higher levels above 2632,on the cash spx run up as far as 2860.
I have doubts the spx gets that high .
This market is reminding me of nasdaq 100 in Jan- Feb 2000
Just before the top. All we need is an ipo like PALM to end it.
Bitcoin 10,000 and bitcoin futures coming soon .
Sticking with timing and will wait before going short .
In the mean time , the rally is treating me well.
Joe
Joe,
Differences of opinion are expected. You deserve to be “complimented” because you never ever force your opinion on others. You simply layout what you see for all to digest. For that I am most appreciative!
I asked you to elaborate only because I have not read very much on the imbalances that will occur when “folks” (I like Verne’s word) try to unwind their positions.
Sure folks mention the imbalances but most never really talk about the explosiveness that exist. You eluded to it…and since I respect you views and opinions I had hoped you would elaborate. Nothing more than that.
In case you missed it there was a commentary “all” about the “short vol trade” over on zerohedge.com about 6 or 8 weeks ago. Google…Christopher Cole of Artemis Capital…”The Shadows of Black Monday…Volatility Isn’t Broken…The Market Is.”
After reading that and having traded the markets for over 40 years…I came away with a new respect for the “Vol trade”.
Joe has definitely been the most accurate so far as the market’s short to medium term direction is concerned. Corrections are becoming shallower and briefer as we wedge our way to a top. The one we briefly saw yesterday will not even show up on a daily chart…
https://twitter.com/realDonaldTrump/status/935841679977910272
will this prove to be important in terms of time and price?
Peter T was talking about the possibility of being even more bearish. There is. John Paulson did not directly trade the market when he bet against the housing bubble. He actually had the banks structure the trade for him so he did not have to depend on a brokerage firm to make the trade. I am actually looking into the possibility of a specially structured long vol trade that bypasses a brokerage house. I suspect I may just not have enough capital to make it worth their while…we will see…
https://www.youtube.com/watch?v=oC837oh98_Y
https://twitter.com/realDonaldTrump/status/936260193536573440
https://twitter.com/realDonaldTrump/status/936351772603568130
The divergence between DJI and Nasdaq is stunning
What I find more stunning is that it took investors so long to follow Bezos and Thiel out the exits. Are they now THAT stupid??!!
Looks like the dam suffers
When the dam fails don’t stay in front of flood
There WILL be lemmings BTFD…..! 🙂
They have been “verned”
Hyuk! VIX flying bull flags….. 🙂
Taking profits on half my VIX long short term positions. I suspect I will once again be somewhat early but scalping the moves is the safest approach. Good for 30%….
Leading expanding diagonal from this morning’s too?
Ed
The problem as I see it sits on the sell side .
If you are long any security option etc… You
May have problems getting filled because there is
No bid.
Take this as an example .
Lets say the market is down big time and downside
Volume is 15 to 20 times buy side volume .
If you are simply short do you really think it will be difficult
To buy to cover ?
On the other hand , say your long the market under that
Same scenario ? You may end up waiting all day.
Your brokerage website can get locked up right at
The peak of the panic on a giving day .
Do you think if you had put options ( on an index ) on the day of the
Panic that the volume on those options would suddenly
Disappear ?
You could also find yourself in a situation when trying to
Buy an option in a fast market when you won’t be able
To buy to enter using limit orders . In that case you will pay
A premium to get filled .
My preference is futures or straight short and only rarely do I use options
If someone chooses the ” this time it’s different ” scenario
They may be correct yet I’d rather not assume that .
There has been many bear markets and each one has had
More similarities than differences.
In April 2000 i sold out of the money put options 1 day before
Options expiry on the qqq for 10 bucks .
I don’t care who bought those or why , I only know what I did.
In the early 1990’s it was call options on silver the morning
Of and a few days after it was discovered that Warren Buffett
Had cornered the silver market . I was long a bull call spread
And made the mistake of exiting the long calls and played
Hell trying to buy back the short calls . I used futures to hedge
That and had no problems getting filled on the buy side .
Bottom line: if you choose options your playing a different
Game than using futures or even being straight long or short
A specific stock.
Using futures your gain or loss is instant and imho much simpler .
Joe
Joe – Something nasty happened to me in 2008. I was long put spreads on BAC and JPM. The stocks had gone right through both my strikes. The puts were 10 wide. I put in a limit order to sell the put spread at 9.50. The market on that put spread was 7 @ 10. And those suckers would not fill me. It was one day to expiry. The only way to execute was to trade each of those puts individually…The other problem I faced with selling short was that I was taken out of those positions in the middle of 3 of 3 because my broker could no longer borrow those shares. Once we are in 3 of 3 down, futures are the most reliable things.
Options on futures are also an often overlooked “option”….
The spread on the SVXY 119 puts this morning was not too bad but they are still trying to rip off traders. I got filled at 7.25 on a 6.85/7.90 spread. I am not sure why the spreads get so ugly when the price starts falling. One would think the increase in volume would result in tighter spreads….
The derivatives desk at Schwab apparently can structure custom trades for accredited investors. Technically they can do it for the designated limit for accredited investor status but they generally do not execute these type of trades for less than seven figures….another way of keeping retail investors out of real money trades!
No surprise there… 🙂
Vik
Good point
I have had those scenarios before and at times
I just held into expiry , the long put , short puts wash themselves .
That’s what I don’t like about spreads, they are easy to enter for
The most part yet at times a pain in the neck to exit, limit your gain
And cost more in commission’s. I trade directionally up or down
I have friends who do well trading sideways by selling options
Yet it’s just not my thing .
Vix futures I’ll have to look into along with my usual methods .
Bitcoin futures on the short side might be a good trade as well .
Either way I’m sticking to my plan of letting this topping process
Play out
There is a limit to the insanity and perversity of even central banks, unlikely as that may seem. This move above the upper B band displays an extremity in both. While the hallmark of this market has been the persistence of extremes, this move by DJI is not sustainable. It WILL descend back below the upper B band. Bought a boat-load of DIA 139 strike puts expiring Dec 8 for 1.30 per contract. They should easily sell for 2.10 the next few days, even if we have one more wave up. There are not too many instances in which you can take market makers out back and administer a sound spanking so you’ve gotta grab ’em when presented with the opportunity! 🙂
Peter, How often do you see a 1,2 – 1-2, 1-2 count to start a wave?
Jody,
I don’t know the percentage, but a lot. They seem more prevalent in markets with lower momentum, and they happen in both impulsive and corrective waves (5 wavers).
And does the count go 3,4 – 3,4 – 5 afterwards?
I am not that familiar with them that is why I ask..
Thanks for the info:)
Not exactly. You have one 3, but you’ll have a series of 4-5’s to match the number of 1-2’s.
Ah, I appreciate it! Thx
jody,
where the “heck” have you been??? …………..i am wearing “deodorant” today, so……………..nice try on conveniently “avoiding” me!!!!
:-))
https://invst.ly/5zmjg
https://invst.ly/5zmw2
Luri,
I Appreciate your Charts each day!
It’s insane.
DJ is completely out of BB and opens with the gap at ATH.
Somebody was recently smugly arguing on Save Haven that a top was nowhere in sight because of the absence of market ‘Euphoria”. Can you imagine?!
Gaps are caused by market orders at the open. If that is not Euphoria, I have no idea what is! 🙂
Normally when it opens out of boll and don’t touch it during the session it should go to look for 20 dma after
US has added 30-40% since Trump elections just with promises of tax reform.
Once it’s done they should take the profits. Nothing more ahead.
DJIA 24000 now. Keep raising my stops as I have for many months and enjoy the ride. Best year ever.
Lol
This website is for educational purposes relating to Elliott Wave, natural cycles, and the Quantum Revolution (Great Awakening). I welcome questions or comments about any of these subjects. Due to a heavy schedule, I may not have the time to answer questions that relate to my area of expertise.
I reserve the right to remove any comment that is deemed negative, is unhelpful, or off-topic. Such comments may be removed.
Want to comment? You need to be logged in to comment. You can register here.