
Update Thursday, June 30, 1PM EST
Here’s ES with the count to now. We have a corrective wave up. It will no doubt end at a fib number. The latest is about 2103. I had warned on the weekend that this is not a market that’s easy to predict. But it still lends itself to an ending diagonal finishing pattern. The first wave up is the largest of the pattern.
___________________________
Update Thursday, June 30, 7:30 AM EST
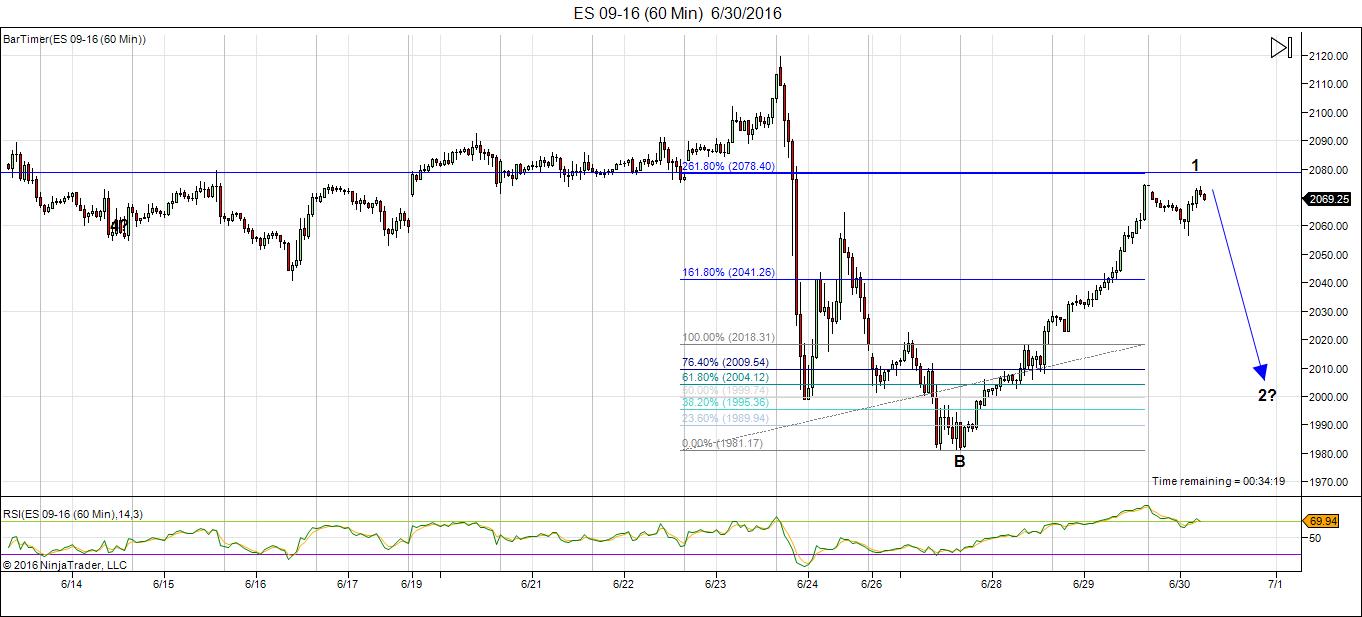
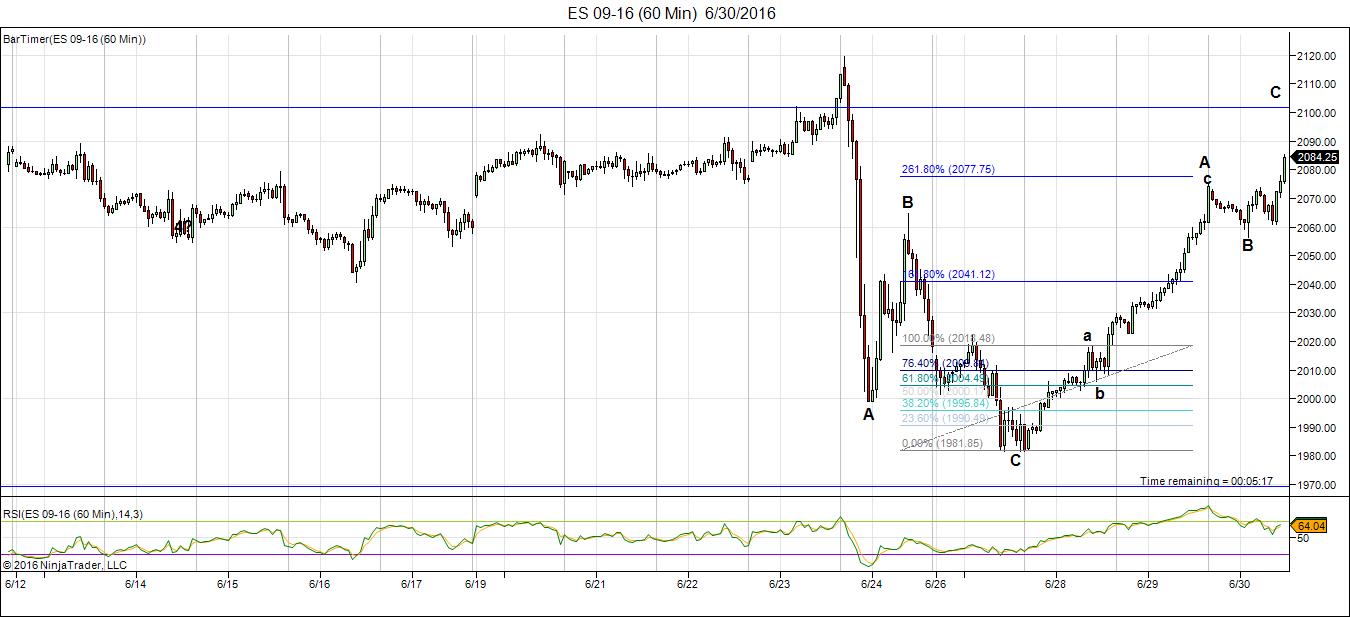
Above is the 60 minute chart for ES (emini futures). ES travelled up past my target of 2066, to another fibonacci ratio at ~2080, while SPX turned at the target of 2073. SPX may rise a little bit further at the open, however, it should turn down shortly thereafter. The 2.618 extension shown here is a rare ratio to extend to, but ending diagonals are difficult to predict, as I’ve said many times before. I think ES should turn around 2080 this morning and head down.
That said, it’s difficult to provide a downside target at the moment. That will be easier once we have an A wave in place. All the waves in an ending diagonal are in 3’s. You can see the projected configuration in the chart below this one. The wave down should last into early next week.
Currencies should also have a turn here this morning.
_______________________________
Update Wednesday, June 29, 11:20 AM EST
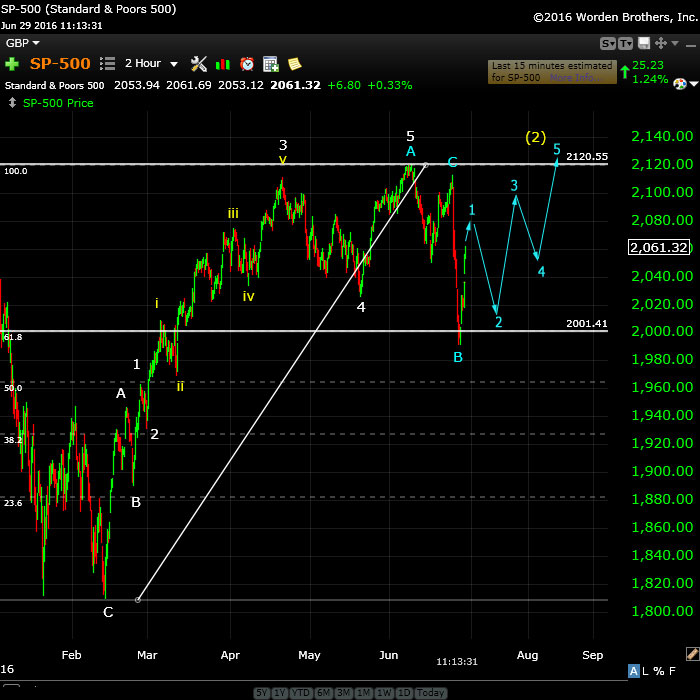
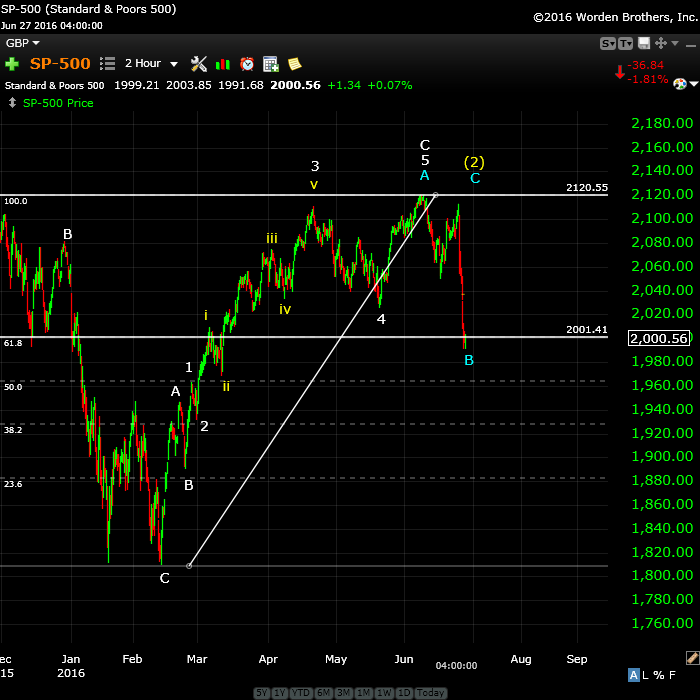
Above is the 2 hour chart of SPX. About the only possibility I see, based on this corrective wave up we have today, which should end at about the 62% level, a measured target, is an ending diagonal. This is what it might look like. This would mean a fairly good-sized drop after a top at about the 2073-4 mark.
All the waves in an ending diagonal are in 3’s, although I haven’t shown these, due to space limitations.
If we drop to a new low, however, we likely have a top in place. I would place this much lower on the probability list (which is a very small list!)
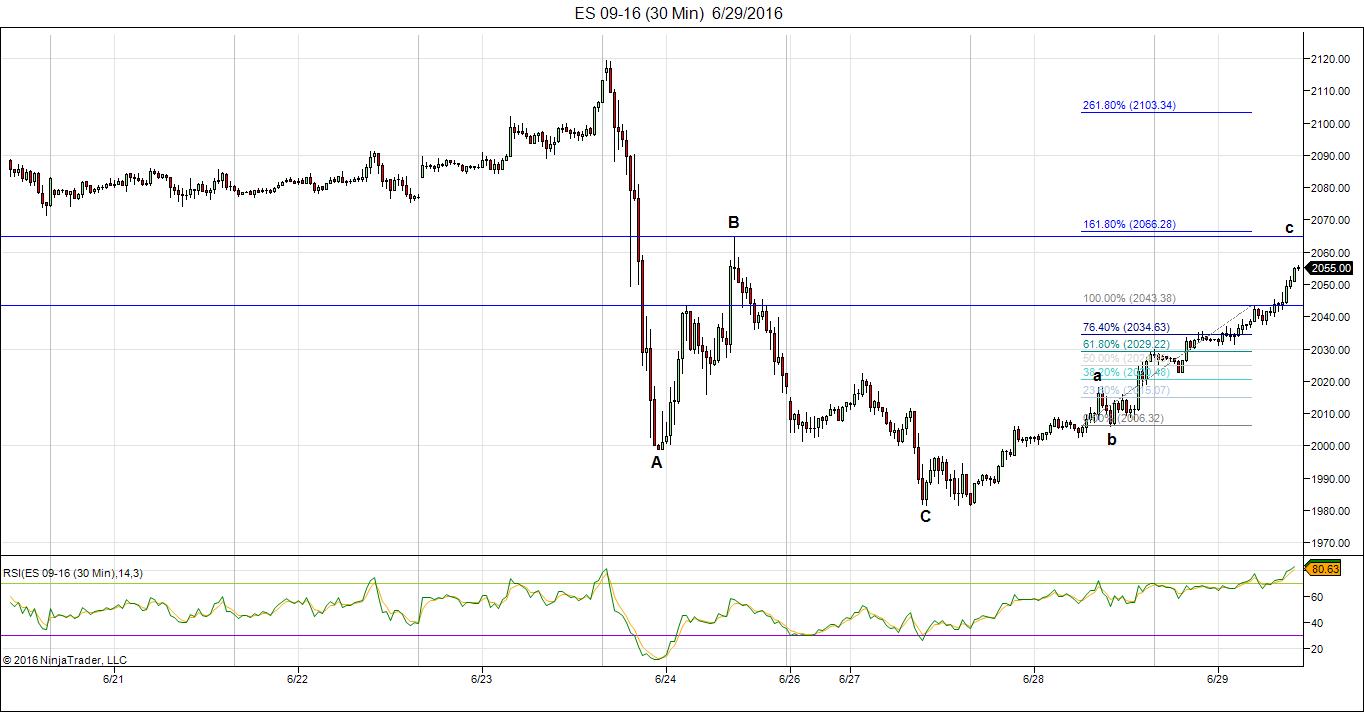
Above is the 30 minute chart of SPX showing the current corrective wave up inching its way towards the measured target of ~2066. If this is the first leg of an ending diagonal, we should see a large drop but not to a new low. At 2066, Wave c will be 1.618 X wave a.
__________________________
Update Wednesday, June 29, 12:10 AM EST
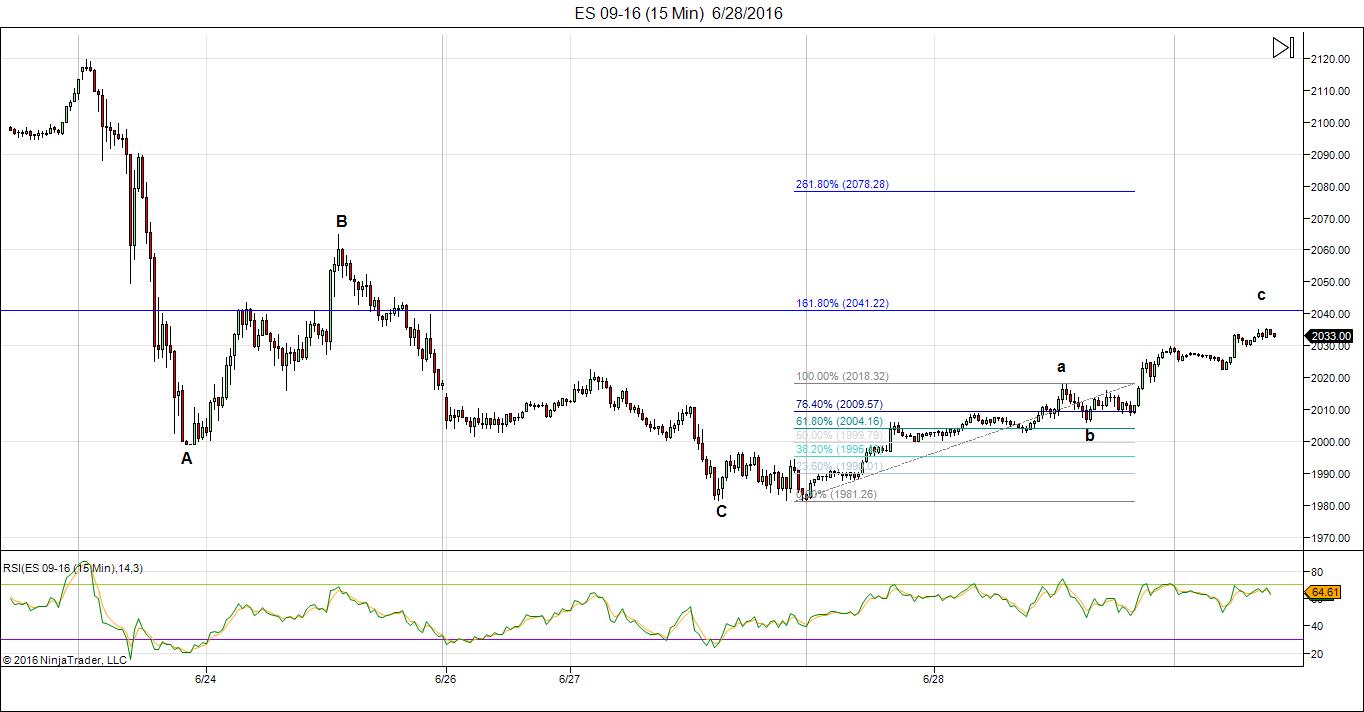
Above is the 15 minute chart of ES (emini futures). I’m showing the wave up over the past couple of days. It’s a corrective wave (5-3-5) and the turn point should be about 2041 based on the measurement on the screen. Waves in 3 retrace. I’m seeing triangles now in EURUSD. GPDUSD, and CADUSD that suggest a wave down.
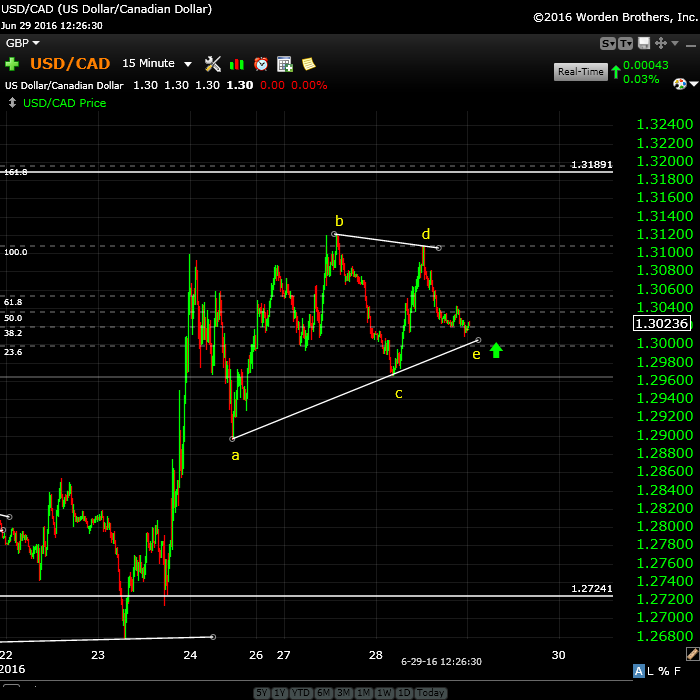
Above is the 15 minute chart for USDCAD showing the triangle that’s almost at an end. USDCAD moves in reverse of the US indices and the euro, so I expect them both to head down as the final wave heads up in USDCAD. The target here is ~1.3189 and then it should reverse and start the final wave down to a down bottom at ~1.2456
__________________________
Update Monday, June 27, After the Close
Above is the two hour chart of the SP500. I’ve relabeled it slightly to account for the B wave down, finishing today. This wave has come down to just below 38% (2001) which is a typical 4th wave (or B wave level). We seem to have bottomed (double bottoms in emini futures) and I’m calling for a final wave up to the top.
We morphed from my triangle pattern this morning to a B wave down. Although unlabeled, you can see that the subwaves of the B wave are in an abc configuration. Three waves retrace. In terms of the numbering of the large wave up from Feb 11, I’ve labeled the subwaves of the third wave. The third wave is composed of 5 waves (there should always be an even number of waves within a third wave) and so this numbering shows that there are. This leaves a final C wave up, which should now head up in five waves.
The alternative is that the C wave only rises 38% and turns over into fifth wave, but the wave pattern in the DOW doesn’t support that scenario. It calls instead for a new high (or at least a double top).
So not much has changed from my weekend video in terms of the direction. Triangles would have headed up in 3 waves. This final wave should be up in 5, unless it starts to form an ending diagonal, which will prolong the agony.
_____________________________
Original Post (June 26): We’re seeing the signs of a market about to turn. But to all those who are calling for an immediate drop, let’s just take a moment to reflect on what’s going on and not get too emotionally involved in a one day event. Here are a few thoughts:
- Markets typically do not turn on a dime. Topping is a process.
- Markets don’t come down in one fell swoop. They zigzag. Even motive waves with big drops have large second waves that attempt to reach back up to the top before turning over. You just have to look a the big picture we’re in now. This second wave almost reached back up to the top.
- Events do not change a market’s direction. They don’t change world mood. The markets move to the mood of the herd. The mood of the herd determines events. I’ve never seen an event change a trend.
- Markets turn on cycle turns. We didn’t have a major one Thursday/Friday, but we have some major ones coming up.
- In the Elliott wave realm, patterns have to play out and you can’t have an ending wave in 3 waves, unless it’s a triangle of some sort. We’re stuck in “no man’s land” at the moment. I’m looking for a top that fits the EW rules
So, for all these reasons, without even looking at the intricacies of the current wave structure, logic tells me we’re not done. But, at the same time, I think we’re only days away from a resolution. A little more patience is required.
Currencies have still not topped yet, although they’re very close:
As I’ve mentioned here again and again, the currencies and US market are becoming more and more tightly aligned. They’re all moving together as debt is being deleveraged. If you’re good at seeing patterns and mentally manipulating them, you can easily see them aligning and this helps you (me) forecast the market moves.
It certainly won’t always be this way forever, but they’ve been moving closer and closer into alignment for the past couple of years. Now the moves are almost identical, from a technical analysis perspective. All the US currencies are in the final wave. We’ll all reach the party together. The US dollar is still the reserve currency and it’s still in charge!
Bottom line: The cash indices are all down in three waves at the moment and this tells me we’re going back up one more time. In the process of coming down to where we ended up Friday, we destroyed the ending diagonal pattern, so we’re essentially starting over. Most indices did not hit a new low, so this puts them in a possible triangle situation (not an ending diagonal). If they bottom at the previous 4th wave low, it opens the door to an ending wave in 5 waves. As far as I’m concerned, the trend is still up.
I don’t know yet what the ending pattern will be, but I still don’t expect us to get to a new all time high. We are closer and closer to a turning point and when I see a pattern that I can share with you, I’ll tell you all about it here.
The rules for a trend change in Elliott wave are very clear. We need to see five waves down at small degree and then 3 waves up to at least 62% with an turn down at that point (that’s the entry point).
__________________________
Andy Pancholi’s Market Report Video
Here’s a link to Andy’s new market report video. In it, he takes you through the June report and shows you how to use it. http://cyclesanalysis.evsuite.com/mtr-20-june-2016/
Andy’s Cycles: In case you missed it, two weeks ago, Andy Pancholi provided a short little video looking ahead into July, which you can watch here: Andy Pancholi Special Report.
To purchase Andy’s high-end cycles report, click here.
Wave Three Down
Here’s a link to a projection for wave three down in the SP500.
New York: I spent last week in New York researching Dr. Raymond Wheeler’s legacy, specifically the Big Book. I placed a photo of it in the post for my Global Cooling video. I think it’s quite spectacular and I found some climate graphs that show climate back centuries and how climate changes mirrored changes in society. I don’t think these graphs have ever been seen before. I’ll be doing a video on them in the near future.
The mood of the herd is changing
Brexit is a clear indication of mood change. It’s one of the first steps in a major revolution against the elite, big banks, and capitalism (the way we know it now). Deflation is taking hold, more so in Europe than other continents at the moment, but it will spread world-wide. Even our music is changing, with more melancholy hits (Adele is a great example of this).
In that regard, I just posted a video on change.org to collect “signatures” to help raise awareness about Canada’s debt level and the interest we pay to private banks in Europe, rather than our own public bank (this goes against our constitution). If you’re a Canadian, I urge you to take a look now and consider adding your name to my petition. You’ll find it here: Take Back Our Money, Canada! This is Canada’s Brexit!
I have a few more videos to come and they’ll be hitting the site over the next week, hopefully. Then it’s on to finishing the book.
There will be some other announcements coming during the next few weeks, so it won’t all be dull and boring.
______________________________
Here’s a video overview of the market for Tuesday, June 27, 2016:
Market Report for June 27, 2016  |
 |
Make sure you zoom the video to full size with frame expander (arrows) in the bottom right hand corner and also set the quality to as high as your web connection allows. This is an HD quality video so the best viewing is at that level. |
_______________________________
The Charts Going into Monday
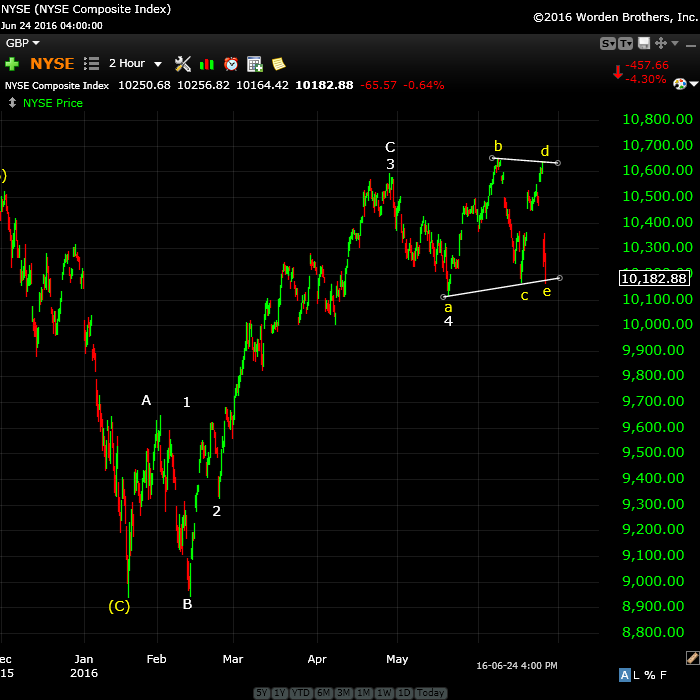
Above is the 2 hour chart of NYSE (the largest cap index in the world) and the one we really need to pay attention to for the US market. I had thought at first glance on Friday morning that the NYSE had done a double top, but on closer examination, it missed by about $10.00 or so. Usually that means we’re going back up to make it official.
The wave structure here is a little different than the SP500 so one of them is likely not correct. I just don’t have enough information to side with one or the other, at the moment. The bigger picture is that we seem to be in a triangle of some sort, which means the overall direction is still up.
The next major move down is a very large 3rd wave. All we need to do now is finish up the final pattern.
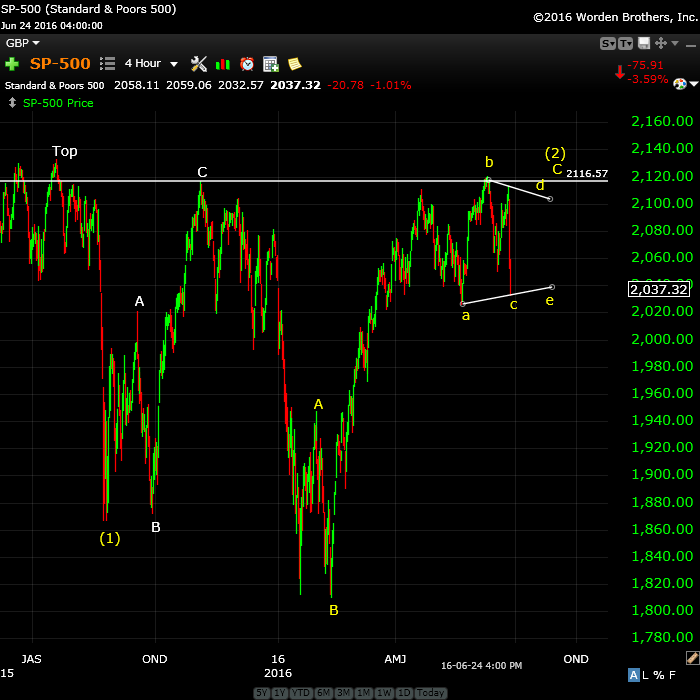
Above is a 4 hour chart of SPX showing the bigger picture. This has a similar look to the NYSE, although I’m showing two more legs of the triangle to go. I’m expecting to see a top to this second wave somewhere above 2116 (looking more like 2134 may be closer to the final high). That hasn’t changed. A zoomed in chart is just below.
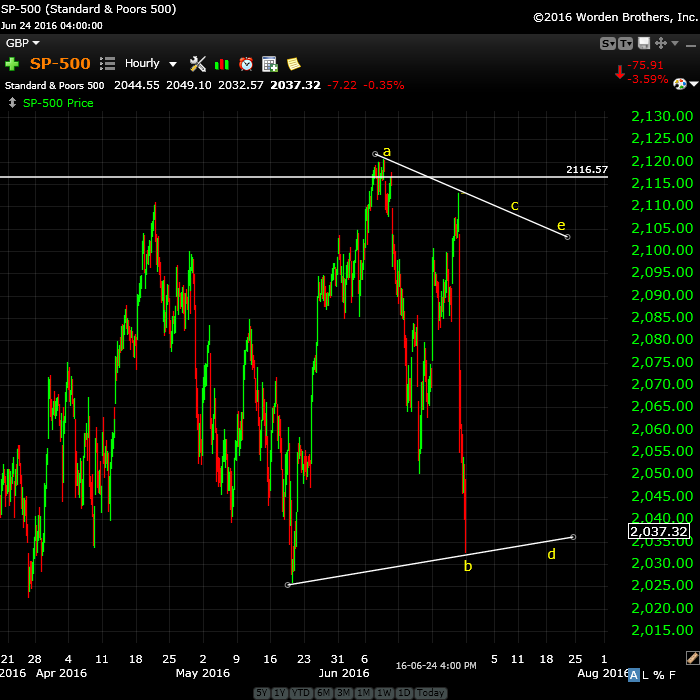
Above is the an hourly chart of the SP500, showing the triangle we still seem to be in. We’ve morphed from the ending diagonal to a traditional triangle. In that case, we need to at least tag the previous high at ~2120. However, in the video, I also show an expanding ending diagonal as an option. We need to see whether we drop a little further here or head straight up (or even head up 38% and then turn over into a 5th wave—but I have this as much less likely).
I don’t expect the SPX to reach up to a new all time high. However, it may get very close.
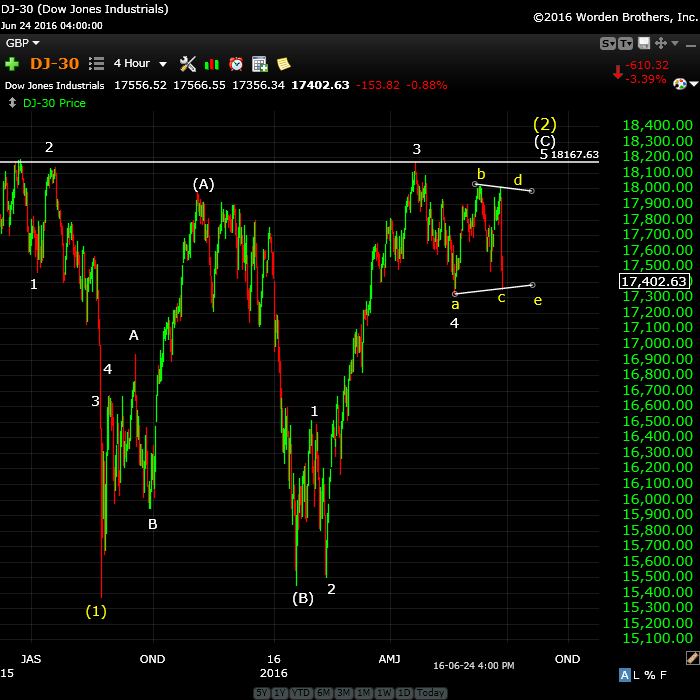
Above is the 4 hour chart of the DOW. It’s also showing a triangle setting up, similar to the SP500. My comments are similar here.
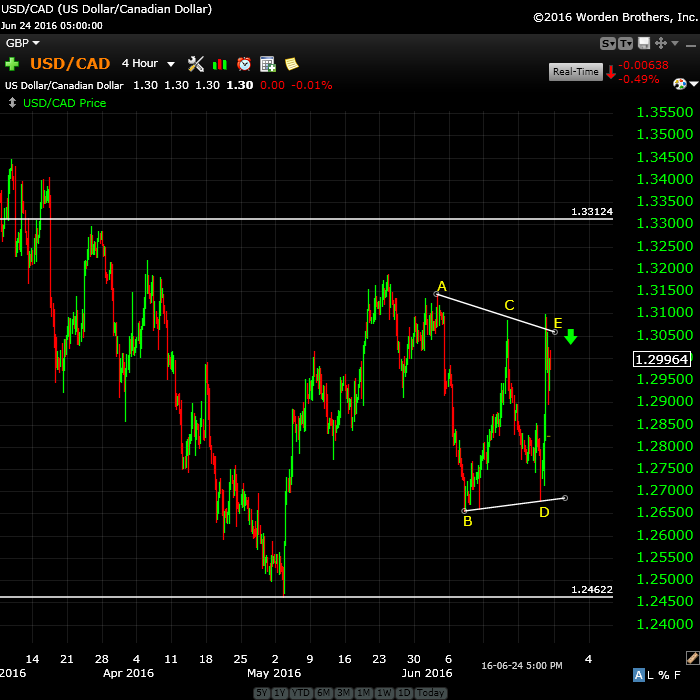
Above is the 4 hour chart of USDCAD.
This has been the most frustrating pattern to try to predict. It’s now traced out a triangle and should finally turn down to complete this final wave to a double bottom—the one I’ve been expecting for the past three weeks or so. The double bottom target is ~1.246.
After that, we’ll turn up in a very large fifth wave, which will eventually take up to a new high for USDCAD.
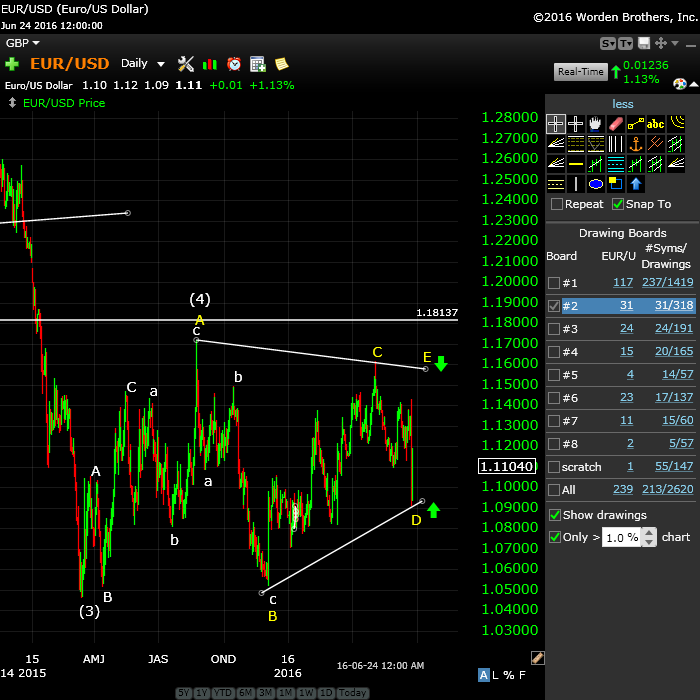
Here’s the daily hour chart of EURUSD showing the “4th wave” of the major corrective pattern we’ve been in since March, 2014. We’re in the final stages of a bearish triangle formation, with one more leg up to go to finish the E wave. Other than widening the triangle (which I’d mentioned might happen), not much has changed here. We wait for the E wave to complete and for a final turn down.
EURUSD should turn down after finishing the E wave in tandem with the US equities.
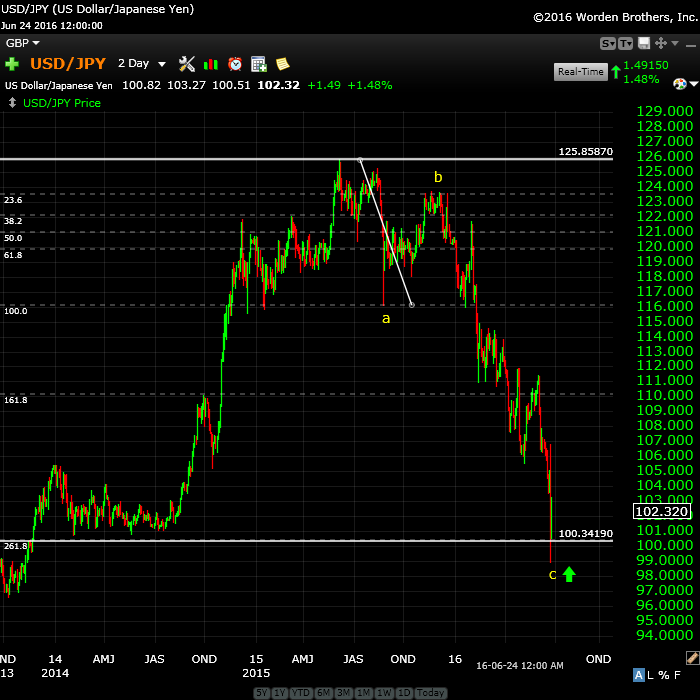
Above is the hourly chart of the USDJPY. We’ve now met my target at 100.5823 and headed a bit lower. We immediately bounced and now I would expect us to head back down to a double bottom. The next major move up will be to the upside.
________________________
First Wave Down – What to Watch For
This weekend we’re dangerously close to a top of a second wave (in the fifth of the fifth, with an ending diagonal pattern).
What we’re looking for to confirm a turn is a motive wave down in 5 waves at small degree. After that, we should get a second wave that will retrace up in 3 waves about 62%. That’s the preferred EW entry point. So don’t feel you have to rush in. There’ll be a much better opportunity at the second wave level than at the top and the risk is substantially reduced.
__________________________
History: The 1929 crash
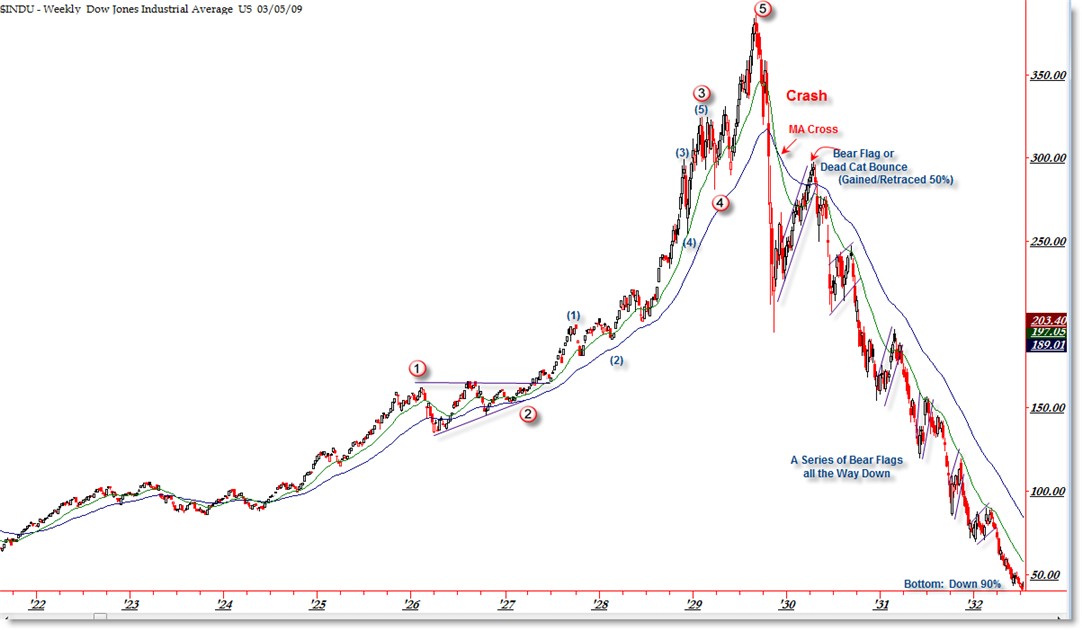
I think it’s important to look at 1929 and the wave structure (above and below), which was the same as 2007—to a point. I will show the 2007 crash below in the “What If” section.
The wave structure of the 1929 crash was in 3 waves overall. There were 5 waves down from the top (the A wave) and then a very large B wave retrace. The final C wave down was a stair-step affair and lasted over 2 years.
Let’s look a little close at the timing of the 1929 crash because the similarities to today are uncanny.
The market peaked on September 3, 1929 and then it took 2 months for the crash to actually happen (to reach the bottom of wave 5 of the A wave). The larger crash which we always hear about began on October 23, 1929. Then there was that large B wave, which lasted 5 and a half months and finally (which I explain a little further in the cycles section below), the C wave which went on for more than 2 years. This might be the scenario we’re looking at going forward.


Peter, I wish you well with your new venture and many thanks for the time and effort you have input, without charge, in the past. Very much appreciated.
Purvez
Thanks for all your support, Purvez. It has been nice having a very knowledgable “waver” amongst the group. 🙂
Peter,
No one knows what the market is going to do tomorrow , and we can only try .
What you are doing is great work , and please do not let any wrong comments stopping what you are doing …
I fully support your idea with the paid service , as I did so months ago when you first mentioned it , and may I ask you to please start it as soon as possible .
When you first started your blog , it was fewer numbers of us reading & participating , and there was a harmony & respect , and no one attacked the other.
As you get more participants joining , then problems will start , and I think the best way to over come this problem is a paid service , and then you can ban any one who misbehave immediately .
Thank you for your hard work … and although we might disagree from time to time on a price target or wave count .. but we all agree it should be with full respect to each other.
I love 2134 :-))))))
AZ
Ah, Mr. Fork,
You and your 2134. I think we agree on that, actually. Thanks. To a positive, supportive, learning, lucrative environment!
Hey Peter,
I m with you from the beginning and my gut feeling already told me the same will happen like on solar cycles more people joining wich eventualy leads to (ego related) comments .
So people please respect this blog and appreciate all the hard work Peter and others have done to make this blog unique.
I m looking forward what you can offer?
Thanks.
John.
Yeah, you’ve been here a long time and seen it evolve. Thanks, John.
Hi, I am new to EW and have been a silent lurker of this site for a few months. I have read through the posts and comments starting back in March of 2015. What a great resource it has been to follow along and try to learn this!! Thank you Peter for this outstanding site and sharing your extensive knowledge. I will plan on participating in any private services you may offer.
Thanks for the kind words, Ellen.
People back with spx 2300
ES still hasn’t made the 2080 mark, and I would expect it to get there. Meanwhile, SPX has moved higher. The next fibonacci level for it is 2086-7. This is a really ugly market, in case anyone hasn’t noticed (and I haven’t made it clear enough).
Longer term projection still in place, but this wave sets the agenda for the rest of the pattern and it will stop at a fib number here somewhere soon.
Peter, Thanks for all you do to try to help all of us newbs . A passage from the bible came to mind about the workman being worthy of his wages. 1 Timothy 5: 18 . please get your service set up asap. I have felt compelled to contribute financially in some way. I TOTALLY understand your annoyance with the some of the comments posted lately, and having to constantly try to defend the the elliot principle. As someone fairly new to this site [ since May ] I have learned much from your efforts. Thanx, Chris Adams
Thank you, Chris.
Peter what is the correlation here between tlt ans spx. For no readon tlt jeeps going up. Does bond traders know more
I don’t know that there is a correlation. Someone else can jump in here if they know better.
I do know that TLT is in the fifth of the fifth wave, so it won’t go up all that much further.
The next SP500 milestone is 2110. It just keeps going and going. It is still a corrective wave, so the ending diagonal is still top-of-mind. For ES 2103.
Well this is starting to look a LOT more ominous to the down side. It would appear that the 23/24th June WAS the top if the count that I provide below has any merit.
https://postimg.org/image/h4ywikig7/
Purvez,
Well, it’s not a legal count. There are a few issues with it. You can’t have a motive wave inside a corrective wave (wave down). The first wave up has too many waves and no legal second wave. Your second wave isn’t legal as it doesn’t retrace enough. So the wave up is corrective, not motive (you’ve labelled it that way, although I think you know it’s not motive).
And the wave up to the 24th wave was not motive which is has to be in order to be a top.
Peter, everything you say is right. However given the incessant rise here and the size of this wave makes me want to consider ‘other’ possibilities. I have spent enough time to know that every so often, there are rogue waves that defy explanation.
In some respects I really shouldn’t be surprised by this wave because if my earlier count of a ending diagonal down wave down was correct then EW states that the retrace is swift.
I’ve never seen a rogue wave that defies explanation, so you’ve got me on that one.
Next time I come across one I’ll let you know. It may well be the one that we are discussing.
thanks Peter for all you do…reposting the below just in case anyone ‘forgot’…?
July 1/5 turn date
https://worldcyclesinstitute.com/summer-sideways/#comment-8209
week ending July 8, 2016: S&P 500 “change trend”
https://worldcyclesinstitute.com/summer-sideways/#comment-8206
Peter
So where to from here….ES hit 2083 and S&P cash at 2092 – both above your last Fib targets. Does this mean we will go up to the next Fib levels which are ???
This bounce is like the Energizer bunny,,,,,,,it just keeps going and going.
Sold my calls to early at the close yesterday. ugh
Thanks for your analysis in this most difficult market.
I already posted those … here they are again.
The next SP500 milestone is 2110. It just keeps going and going. It is still a corrective wave, so the ending diagonal is still top-of-mind. For ES 2103.
if you draw a trend line utilizing the June 8 SPX high (2120.55) and the June 23 SPX high (2113.32) it hits today/tomorrow at approximately 2110…?
🙂
Posted a new chart of ES.
78.6% on ES is about 2089 … so we should be close now ( price now 2084 )
We stopped @ 2088.5 … let us see if that will hold
Looks unfinished to me in ES and that we’re setting up for a small ending diagonal.
Well, I think you’re right. NQ did a small ending diagonal but ES looks like a double top now.
Triple tops on ES and SPX. I like that.
It doesn’t look good ?
Currencies are at inflection points, so other than the final spike, I think we’re going to be ok. Tonight will tell, obviously. My other targets aren’t that far off. That’s the thing that bothers me – where we stopped.
HI Peter
I had to cut off comments on my blog a few years ago when I was viciously attacked by a couple of crazies. ONE of them also sent me disgusting emails for months afterward. Im not as precise or as knoweldgeable in EW as you appaear to be bt I do have a rudamentary knowledge from studying Frost & Prechter circa 1981- I’m now age 72.
EW is not the reason I was contacting you. I have been using SCIENTIFIC Resources now since 2011- but had to eliminate those that didnt stand the test of time, and along with way alienated many of my VPN members who have come & gone. I still have about 50 members, some of whom have purchased my service in one year contracts where my program only requires a 90 day membership. About 10 new people do sign up monthly and I my site shows over 1 million viewers since 2011 at about 10K viewers per month. Please just make a review of what im showing at the blog and if you have further
interest in conversing with me, I would consider that a great honor. thanks in advance, Jay Strauss
Hi Jay,
Yeah, I know … it’s a problem. I have about 18k visitors a month and 140K views/mo and been operating for just over a year, so I’ve been pretty lucky. I build Wordpress sites from scratch, so I know them inside out. I have one person that continues to email but it all goes directly to trash so I don’t even see it.
I’ll take a look at your site tonight.
PALS next week:
Phase: bullish
Distance: bearish
Declination: very bullish
Seasonals: bullish
Summary: this weeks rapid rise was consistent with triple bullish Lunars. As the rise was dramatic and counter to Brexit inspired expectations, expect next week should offer excellent short term shorting opportunity into mid July. Expecting a 5 to 10% sell off in August and September (post Olympics, in setting of Brexit wrangling). Still very bullish next few years thinking market will “melt up” rather than melting down. (Saturn in Sag, 12 year Jupiter cycle, Jupiter in Sag in three years, end of decade rally).
You were spot on Valley just like in the old days (solar) sold my longs to early AEX is like a rocket.
Next week new moon I think we will top around July 5 /7.
Taking profits early is fine. Nice Tulip call.
Nice play once again Valley. I always appreciate your inner visions on the markets.
Thanks, Dave. Happy trading!
Peter
I wanted to wish you an early Happy Canada Day. I hope you take the day off as you more than deserve it. Pancakes and maple syrup for breakfast to start the day ???? Yum.
Thanks for the new targets. Am I correct in saying that even though this wave up looks motive, it is actually corrective, and should retrace all the way back to 1991 on S&P (as a minimum)……? perhaps, this is the next turn from Andrew which I believe is 8 july,
NFP day, so that could be explosive.
Haha … your yum is not my yum. Yeah, I guess tomorrow is a holiday here. Thanks for the reminder. Had totally forgotten.
You’re right about corrective and yes, it will eventually completely retrace, just like the one down will. But I’m chalking this up as an ending diagonal, as the final wave in a sequence either has to be in 5 waves (motive) or an ending diagonal. Ending diagonals are often at the end of motive waves and C waves. We don’t have 5 waves up here, so we only have one option left. As such, it’s going to take some time to get there.
There is also a fib ratio that puts the top of ES at 2087. So we might be done here. Thats an extension of the very first wave, something I will show in the course.
Lots of RSI diversion, too. I haven’t been watching too closely today.
I rather think we’ve still got higher to go to 2010 ES, since NQ also looks like it’s unfinished. But end of the day will possibly see a turn.
great work as always Peter! don’t let any negative nellies stop you from your path. the blog allows you to refine your craft as well as receive input. my view is that once again the markets have brought us right back up to the top of the channel again. it give those with a medium term bear thesis, as i have, to target Aug/Oct put spreads or call spreads at or above 2100. take profits on some or all if we retest 202 area and reload when we hit 2100. wash rinse and repeat. the btfd crowd came in full force once the UK didn’t fall into the ocean as all the elite and media pundits told the world pre brexit. $$ is still seeking out the last musical chair.
Thanks, Scott. I would never have picked the end point for this wave, but it’s done pretty much as expected from a pattern perspective. I have no sense as to how long this will take to play out, but it seems odd that it would top during the summer months. Good for you on your strategy!
My June 26 post mentioned 2 George Lindsay patterns of potential B-B-T patterns (Bottom to Bottom to Top), 169 T-days and 587 T-Days. It was 2 days off. I did not post my next group on BREXIT day but it was a fabulous one: 92 trading day turning point pattern: 5-20-15 (All-time high), 9-30-15 (1 day off), 2-11-16, 6-23-16… Tough to beat those for major turns since the ATH and at least a mild suggestion that 6-23 will still be important top despite our current closeness to it. Here is another potential B-B-T. On the Dow, the two most important bottoms of the past 2 years before Jan-Feb of this year were 10-15-14 and 8-24-15, 215 T-days apart. Add 215 to 8-24-15 and it takes you to June 30, 2016… YUP, Today! We will know in the fullness of time…
Peter, I appreciate your unique style in coming to your conclusions on the markets. I have only a 1/2 position short for tomorrow, despite that July 1st has over a 85% chance of being positive. I will exit very quickly in the morning if I sense no retrace. I hope you will be correct. All the best to you Peter.
June 26 above should, of course, be June 6…
John
I did catch Andy’s 10 yr cycle when he showed the chart
of the euro and the June 24 th date . did anyone catch that
Gann method ?
Joe
Hi Peter
After reading your comments on the name calling issue
I felt bad .
your site has always been a good natured comunity in my eyes
and it’s been a pleasure to be a part of it .
I’ve seen other sites where the chat rooms get pretty bad to
put it lightly yet your site is full of people sharing ideas .
I think your furture format will be a great way for you to focus
on the educational part of teaching Elliott wave .
I imagine it takes you easily 4 hours to put out a weekend post .
in doing so though I would also think your blog is a way to write
down your thoughts and ideas and keep them in organized
and easily referenced .
in that regard I hope you are able to keep your blog alive even if
it’s just a weekend update . I do understand that the time involved
takes you away from other tasks and to that I’d say just post to the blog
your taking the weekend off .
I’ll miss your blog if you let it go and I’m sure others wil
l also
but I understand that you have a full plate .
good luck with where you take it !
one market related thought/ question one the nasdaq 100 cash index
NDX . could it be labeled as a contracting triangle ? and what we have
been seeing this past week is the triangle thrust ?
I wish you well Peter
Joe
Joe I really appreciate your cycle work and all you have been contributing. In your post about the DJI Dow Industrials, you looked at how the upwaves from 8-24-15 and from 2-11-16 have almost reached the .786 retracement but turned before it. Now DJI has already passed the .786 at 17925 in this wave you are watching to go till Aug 1-3. Any thoughts on how that changes the projection?
Currencies are at an inflection point and I can count 5 small waves up in an end wave on futures, so we should come down today, although the cycle turn date extends from today through Tuesday. It may be very much a sideways day.
Worse case, as few more points up.
I’m having computer and monitor problems this morning so mounting a chart for futures is a bit of an issue.
78.6% failed
Next Ratio 88.6% around 2104 ( ES )
My targets still remain of 2103 ES and 2110 SPX.
Peter, in EW methodology, how close do numbers have to be to hit target? SPX hit intraday high today of 2109 (2108.71 to be exact).
Jemba,
It’s more than just the numbers. The pattern has to play out, as well. Expect a double top here—that would be the signal for a turn. The EW preferred entry would be at the top of the second wave at lower degree. The wave down should be a zigzag, which is 5-3-5 in terms of wave structure. So you can be a pioneer at get in at the double top or wait a bit and get in a little lower at the second wave (which in other lingo would be a lower high).
My main monitor has crashed (and it’s a holiday here, of course), so I won’t be commenting much on today’s market. Don’t buy LG screens (imho). 4 out of 6 of mine have crashed for good in the past year. Just shows where our manufacturing integrity has got to.
What a bummer–sorry to hear it.
I am tempted to say “nothing worse” but I know that’s not the case. 🙂
I run six monitors off two computers, but this is the main monitor of a block of four and so I have to replug monitors before I can even launch a program. I have one spare monitor left. Three are in for repairs (realizing I haven’t heard from the repair company for 3 weeks now).
Good .. so let us hope one of these levels will stop it …
Peter , is it possible for wave to reach the high of June 23rd in one go without correction ?
As I often say, “Anything is possible.”
We’ve had a correction (a B wave), so we’re in a final C and in the fifth wave of that, at an extended fib ratio from the first wave, so it’s unlikely that we’ll get above my targets. Plus all the currencies are at inflection points (and the dollar is the guy in control).
The June 23 high in SPX is not very far away (I can’t see futures well at the moment, because of my computer problem, which I’ll be able to fix by tomorrow, or perhaps later today).
It strikes me that the wave up in SPX could be a (double pronged) second wave and if it reaches that other high, there’s an opportunity for a top, but I’d have to do an analysis of the other indices before I went any further along those lines.
Thank You
I hate it when I can’t see anything!! 🙂
(or not enough to be of much value …)
Peter, looks like your final wave up on the SP500 to 2120 is more or less completed with SP500hitting 2106 today which you predicted before a big move down. I think this might coincide with Andy’s turn date of around July 4th.
jemba,
I don’t think we’re quite done. Looks like 3 down and the final wave up doesn’t look complete (SPX). I would expect we’ll hit 2110. Let’s please keep Andy’s turn dates to ourselves. That’s his proprietary information. I don’t know that he’s made it public.
His turn dates are public knowledge. July 4th and July 14th – July 15th He has a video out on the internet ( free) July 14 th 15 Very important.
Then I stand corrected. I haven’t watched all his videos.
It they’re out there, 15 should be the bottom of ending diagonal 2 then, imho. I don’t think anything’s changed.
Hey Dave,
Is this a new free video not one already posted here on this site?
Can you send the link?
Thanks
John.
It might be this one I received when I was travelling. http://cyclesanalysis.evsuite.com/the-most-critical-time-cycles-ahead-optimized/?inf_contact_key=af23e45d7f1657c4f42fc457f1adcb8b9ba66d975c80d96bbc6363ccf7492f33
I haven’t watched it so I don’t know is this is the one Dave is referring to, but it’s the most recent I have.
http://cyclesanalysis.evsuite.com/mtr-brexit-video-optimized/
The one Peter posted is different than the one I posted. Two separate videos.
Sept 5th Huge cycle to unfold in the markets. Sounds like, that is the cycle day he is more concerned with than the others. I personally have that time frame as significant low before a sharp rally. Good luck every one. I am gone fishing.
Thanks Dave,
Good luck with fishing .
Peter – You are wanting to see 2110 ES not 2110 SPX cash. Am I understanding you correctly?
Not sure, cause I can’t see a lot at the moment. Whatever I put in the post.
I just checked. It should be 2110 SPX and 2103 ES.
We’re down in the indices and futures in overlapping waves (a 3), so we still need to top. I’d guess that’s in store for Tuesday morning.
This is for the Canadian viewers. Billion Dollar Fund Manager Comes Out of Retirement To Bet Against Canadian Real Estate.
https://betterdwelling.com/city/toronto/marc-cohodes-short-canadian-real-estate/
Thanks Peter,
Nice video did not see that one.
I m curious what will happen around mid of July?
Well, if you believe anything I say haha, it will be the bottom of the second wave of the ending diagonal. I expect the overall US market to stay up until September. That’s what the timing and the structure is telling me.
Peter, I am also thinking a likely pattern is for mild July sell off and rally into August. Peak during Olympics 8/4 to 8/21, and then during Olympics selling to begin and continue pretty much into late September or early to mid October.
Good! I just don’t think anything will happen in August because historically, it never does. Nobody’s around. We need some volume for a top, imho. This next wave down should turn mid month, so that leaves 3 more waves. The third wave is typically the longest and most complicated, but doesn’t have to be. Sometimes ending diagonals do a double top (just sometimes). So I can’t get any closer than that. Otherwise, will just have to let it play out.
Just starting to put together a post. Don’t know if it will be out tonight, but by tomorrow morning, latest.
Thanks Peter and Valley,
I think something similair will happen like 2006 ( Andy) and we will make a turn July 8 till July 14 and after that we will go up again.
If so we can go sideways till Friday.
Looking forward to watch your next video.
Peter,
I didn’t have a chance to comment on your frustrations from earlier this week. I really appreciate what you do. You should be compensated for your time. Happy to pay an annual fee to keep your research coming. I also appreciate the input from this following, accept for the idiots, of course.
🙂
New post live: https://worldcyclesinstitute.com/see-you-in-september/
This website is for educational purposes relating to Elliott Wave, natural cycles, and the Quantum Revolution (Great Awakening). I welcome questions or comments about any of these subjects. Due to a heavy schedule, I may not have the time to answer questions that relate to my area of expertise.
I reserve the right to remove any comment that is deemed negative, is unhelpful, or off-topic. Such comments may be removed.
Want to comment? You need to be logged in to comment. You can register here.