
Market Update for Friday, May 12, 2017
Remember that when I’m calling tops and turns in various assets that this is not the best entry. For example, the best entry short in ES will likely be tomorrow at the top of a second wave. The same thing can be said the USDJPY. I will watch and let you know either in comments, an email or the nightly video.
Market Update for May 12, 2017 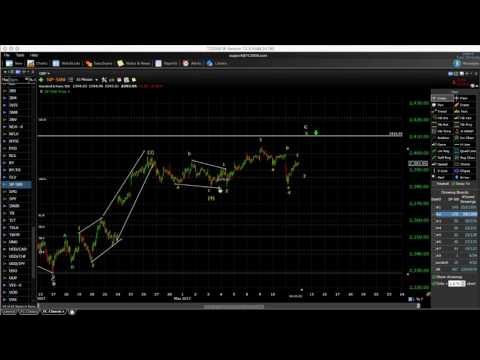 |
 |
Make sure you zoom the video to full size with frame expander (arrows) in the bottom right hand corner and also set the quality to as high as your web connection allows. This is an HD quality video so the best viewing is at that level. |
_______________________________
Market Update for Thursday, May 11, 2017
Remember that when I’m calling tops and turns in various assets that this is not the best entry. For example, the best entry short in ES will likely be tomorrow at the top of a second wave. The same thing can be said the USDJPY. I will watch and let you know either in comments, an email or the nightly video.
Market Update for May 11 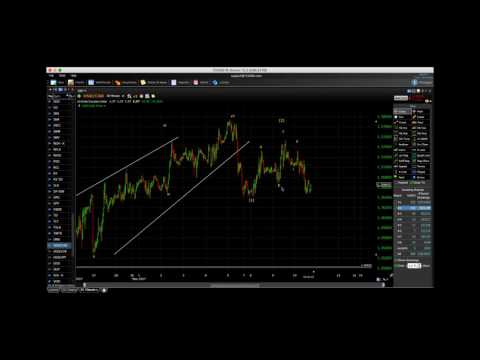 |
|
Make sure you zoom the video to full size with frame expander (arrows) in the bottom right hand corner and also set the quality to as high as your web connection allows. This is an HD quality video so the best viewing is at that level. |
_______________________________
Market Update for Wednesday, May 10, 2017
Remember that when I’m calling tops and turns in various assets that this is not the best entry. For example, the best entry short in ES will likely be tomorrow at the top of a second wave. The same thing can be said the USDJPY. I will watch and let you know either in comments, an email or the nightly video.
Market Update for May 10, 2017  |
|
Make sure you zoom the video to full size with frame expander (arrows) in the bottom right hand corner and also set the quality to as high as your web connection allows. This is an HD quality video so the best viewing is at that level. |
_______________________________
Market Update for Tuesday, May 9, 2017
Market Update for May 9, 2017  |
|
Make sure you zoom the video to full size with frame expander (arrows) in the bottom right hand corner and also set the quality to as high as your web connection allows. This is an HD quality video so the best viewing is at that level. |
_______________________________
 The Byrds were a major rock group that dominated the mid 60s (and here I go, dating myself once again!)
The song, “Turn! Turn! Turn!” was perhaps their most popular and certainly one of my favourites (that I remember playing on guitar). It was “written” by Pete Seeger (he wrote the title and one line) but 90% of it was lifted from Ecclesiastes.
The lyrics certainly fit the times, and resonate with anyone who knows about and believes in cycles. It came to mind as I was doing my analysis this weekend.
Here are the lyrics:
To every thing there is a season, and a time to every purpose under the heaven:
A time to be born, and a time to die; a time to plant, a time to reap that which is planted;
A time to kill, and a time to heal; a time to break down, and a time to build up;
A time to weep, and a time to laugh; a time to mourn, and a time to dance;
A time to cast away stones, and a time to gather stones together;
A time to embrace, and a time to refrain from embracing;
A time to get, and a time to lose; a time to keep, and a time to cast away;
A time to rend, and a time to sew; a time to keep silence, and a time to speak;
A time to love, and a time to hate; a time of war, and a time of peace.
So why did it come to mind this weekend?
I’ve been seeing gradual turns by all the USD currencies into their final ending waves. USDCAD is in the process this weekend. So is USDJPY. AUDUSD is the straggler (I think we’re in a triangle with another wave down to go before a turn up), as GDPUSD and EURUSD turned quite a while ago.
And ES/SPX. The US indices are much more of a challenge and have been for quite some time. It’s now 6:3o pm here and I realize that I’ve spent all day on my analysis, almost entirely because of the US indices. They’ll be the last ones to finally turn into a fifth wave, which I think speaks to the weakness we’re going to see for the fifth wave in the US market.
I get the sense that the US indices are going to be pulled along by the US dollar, based on the divergence already showing up across them. There is also non-confirmation in the DOW vs. the DOW Transports. It’s a very bearish sign.
Because of what I’m seeing (weakness in the DOW and Russell indices), I’m still leaning towards the expectation for an ending diagonal for the final fifth wave. First however, we have to complete a fourth wave. By the looks of things today, we’re not quite done with the third wave. We have non-confirmation happening between ES and SPX and I’ll be surprised if these two end up with different counts.
In short, everything is in the turn phase, except that they’re out-of-phase. It’s making life difficult for me at the moment, but being careful, we should still be able to capitalize on the opportunities as they present themselves. Sunday will again be key. I think we have a little more up to go in ES/SPX, but I could be surprised. An upset in the French election could change things, but at the moment, it all comes down to about five points in ES.
Key will be where we open on Sunday.
Opportunities this Week
There are opportunities this week:
- ES/SPX (a little more upside, then down into a fourth wave)
- USDCAD (possibly topped, or requires a test of the top, watch for an entry)
- USDJPY (expecting a double top and then down)
______________________________
Here’s the latest daily chart of ES (emini futures)
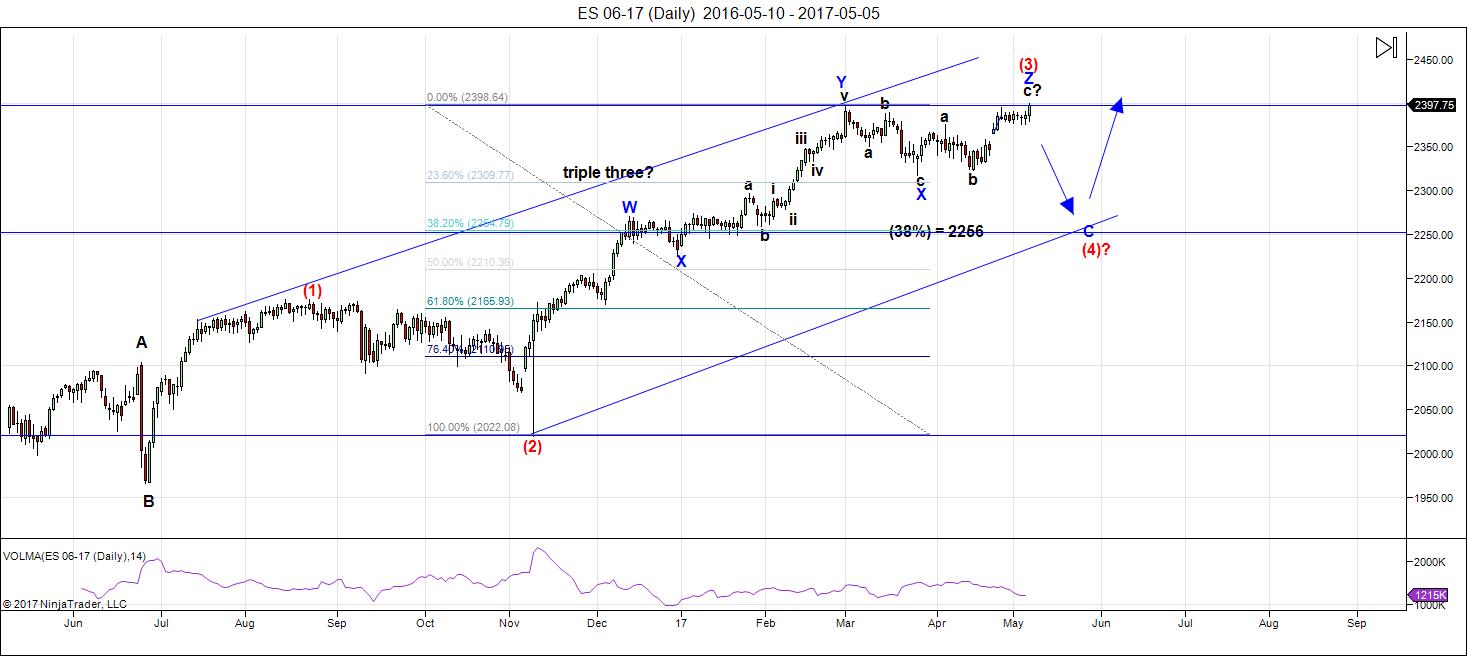
Above is the daily chart of ES (click to enlarge, as with any of my charts). On Friday, ES went to a slight new high. It was not confirmed by the SP500, nor by any of the other USD indices. So cash indices are still in a “fourth wave” (as of Friday). ES, however has gone to a new high in a zigzag and this can only be a continuation of the third wave. I think we still have a little ways to go before a turn down. I’m projecting the top of ES at 2410-15.
The Difficulty: I’ve spent literally hours today pouring over these charts and measuring waves. The difficulty (as I’ve stated before) is that this set of waves up is corrective and that means there are virtually no rules. I’m not making excuses, I’m just relating the fact that predicting this market is a challenge of making educated guesses. This is not a normal structure for an ending 5th wave. There are really no first, second, third, fourth, or fifth waves of this large third wave—they’re all zigzags (a lot tougher to decipher), but there can only be three at most.
I’ve relabelled the charts to show a third zigzag of a combination wave in progress (this meant I had to change the count of the first zigzag to include what I initially thought was the second zigzag—my educated guess). So we have a third wave of three zigzags and I put us in the final one now.
** The Turn Date: We had a turn date of May 3-5 this week. Now, if we continue up here, it negates this turn date, which is a major one for the month. There isn’t another turn date for SPX until May 18 (and it’s a minor one). So keep in mind that there is still the possibility of a turn down on Sunday. However, I’m leaning to a bit more upside, for the reasons I’ve stated.
On to the prediction: The flat I projected is now negated in ES, but not in the other indices (yet). Right now we have a non-confirmation. This concerns me as it would be odd to have ES and SPX with different counts.
Since ES went to a new high on Friday at the end of the day, I suspect the cash indices will do the same (not necessarily all of them). However, the bullishness will likely be short-lived. Although I’m projecting a slight rise, overall the market looks extremely bearish.
Let’s concentrate for a moment on this final zigzag: If I measure the a wave, the C wave is 1.618 times the a wave at about 2415, A=C at about 2410. In a similar vein, the top for NQ should be about 5663 (we’ll see how close we get).
Let’s look at why the medium term looks so bearish:
- We still have not had a large enough fourth wave correction in price.
- In the chart above, you can see that volume has dropped off quite considerably. There are divergences in the RSI readings, as well.
- This final wave up in ES and SPX is in 3 waves (another zigzag). This is a corrective wave.
- NQ is finishing the fifth wave of the third wave. It requires a good-sized fourth wave once it reaches the top. ES and SPX will certainly correct when NQ correct. I project a top for NQ of about 5663.
Summary: We’re in the final pattern of a third wave in ES.
The top end projection for this final zigzag is 2415. We still have to complete a larger fourth wave. If we head down from here, we’ll go right into finishing the fourth wave, but ES will be out-of sync with SPX (and I have a hard time reconciling this fact). I believe the most probable path is a little higher with a reversal close at hand.
After completing the larger fourth wave, we’ll have one more wave to go, which could be an ending diagonal as a fifth wave. The long awaited bear market is getting closer.
_______________________
Here’s the latest HOURLY chart of ES (emini futures):
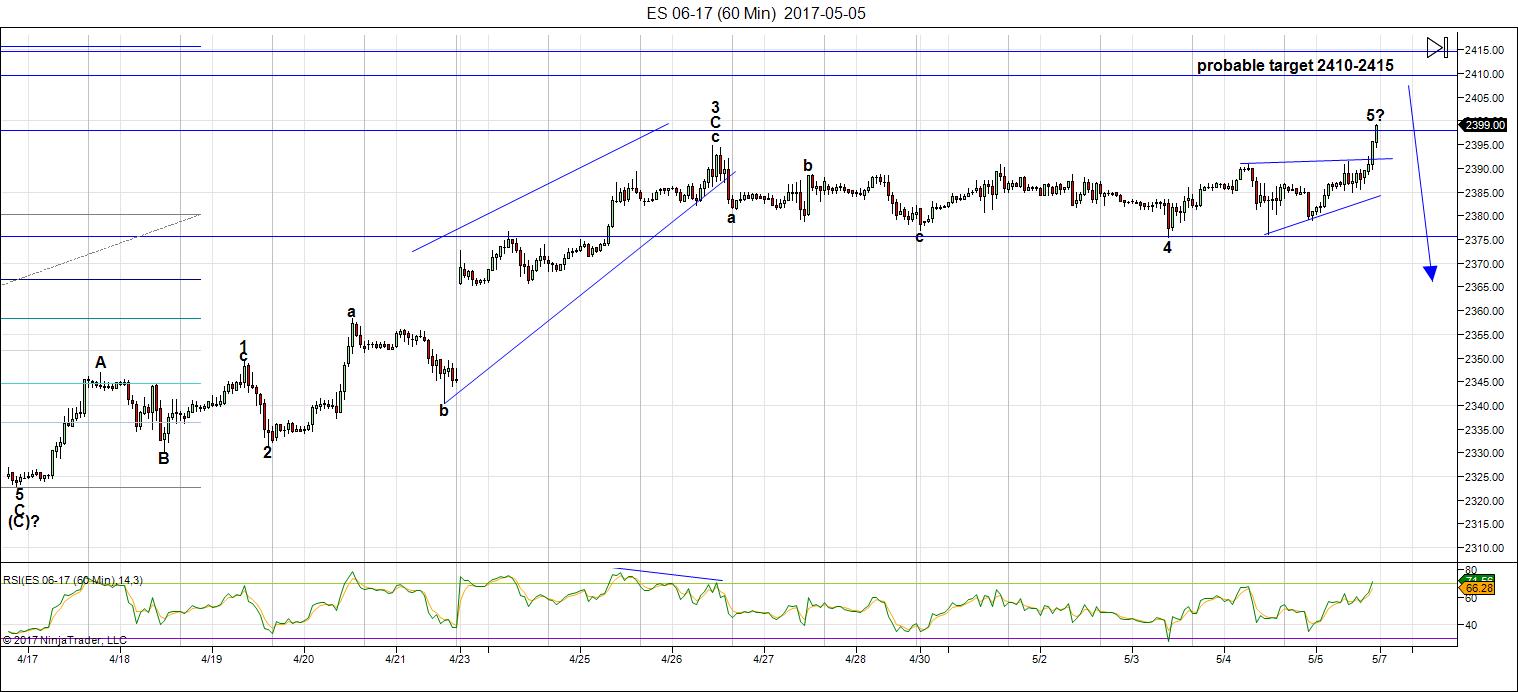
Above is the 60 minute chart of ES (click to enlarge). Please watch the video to get the full story on what’s happening short term.
You can see top right what looks like an ending diagonal, but after closer examination, it’s not. If not, it puts us in the third wave of the final fifth wave with a little more upside to go. It would also be a 1-2, 1-2 combination, which makes it more difficult to measure. However, measurements from the much larger A wave of this zigzag project a top of 2410-15. That’s the most probably outcome, imho.
The very large, sideways “fourth wave” of the larger “5th wave” zigzag is very bearish-looking, but I don’t believe the top is in yet.
So, look for a slight continuation up on Sunday through Monday (which likely means Macron wins the French election).
_____________________________
Some housekeeping:
Andy Pancholi Turn Dates (May, 2017)
- SP500: W3-5*, Th18, Tu30*
- EURUSD: F5, W17, Tu23
* denotes major
New Free Blog Post: Elliott Waves: Pure Gold
The CHART SHOW signup is live for Thursday, May 11. You can sign up now in the usual spot: webinars
________________________
Here’s a video overview of the market for Monday, May 8, 2017
Market Report for May 8, 2017  |
|
Make sure you zoom the video to full size with frame expander (arrows) in the bottom right hand corner and also set the quality to as high as your web connection allows. This is an HD quality video so the best viewing is at that level. |
_______________________________
Charts Going into Monday
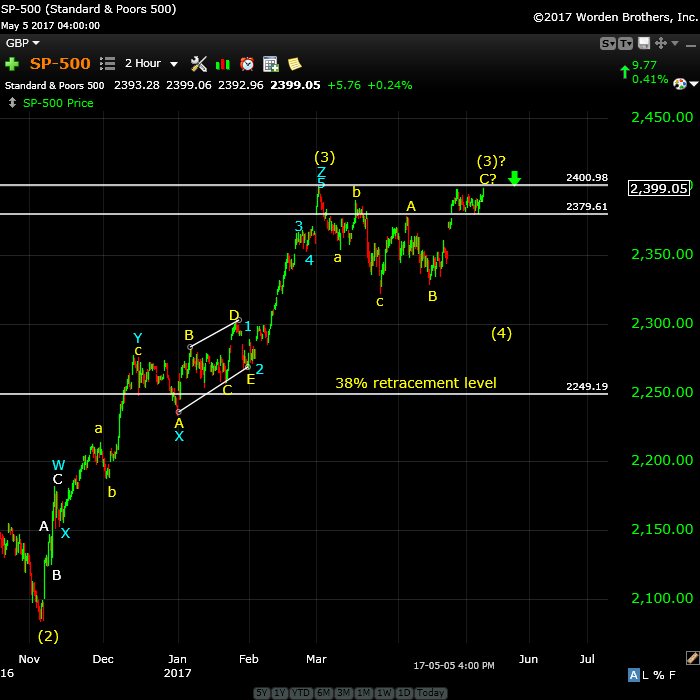
Above is the 2 hour chart of SP500. As with ES, we’re at the top of the third wave, what now (as of Friday) looks like a final zigzag. However, on Friday we did not go to a new high, which puts us out-of-sync with ES. I would expect this to be resolved, but there’s always the chance this it won’t be.
So, on Sunday, I expect more a little more upside. In the case of SPX, the top projection is 2414 (where the C wave=the A wave) or 2421 (where the C wave = 1.618 X the A wave).
The rest is on the video, or virtually the same as my prognosis for ES (above).
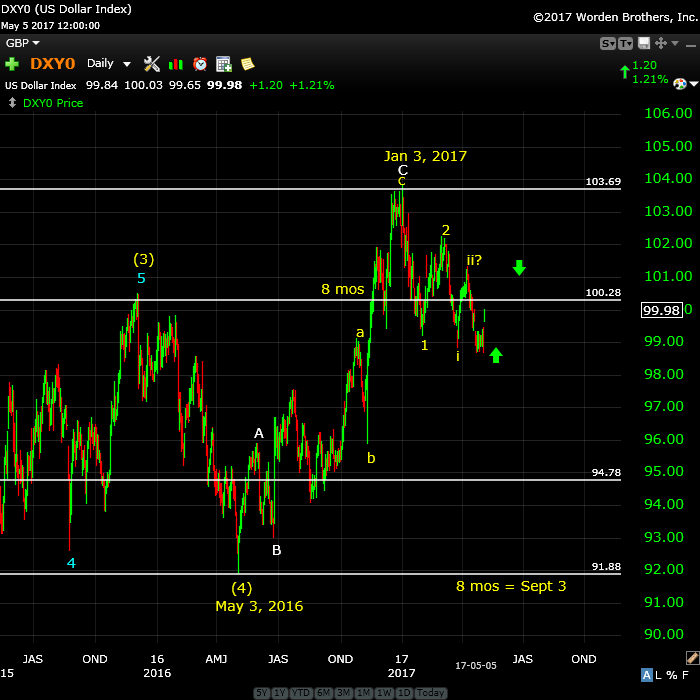
Above is the daily chart of the US Dollar. No change here in terms of my long term prediction—we’re heading down to the 91.88 low.
On a near term basis, I’m still expecting a retrace up of perhaps 62% from the most recent high (ii). We’ve begun the process, but so far, EURUSD has not followed along. However, EURUSD is at the top of 5 waves, so I expect a retrace very soon.
Longer term, once we continue back down, 1.618 X the first wave, (the target for the third wave) is somewhere close to 94.83. The movement of the dollar determines to movement of just about everything else these days. The longer term target for this wave down is 91.88.
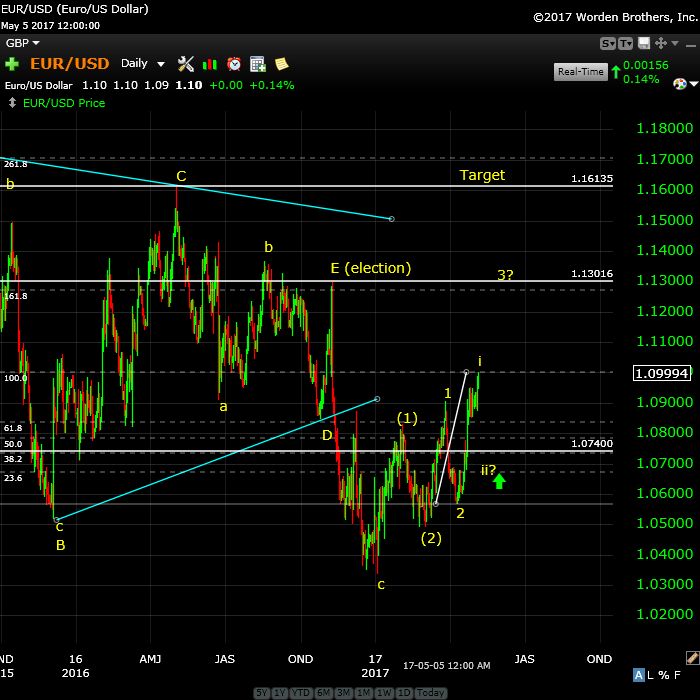
Above is the daily chart of EURUSD. The bigger picture is that we’re headed up towards a target of 1.16 (and change) before we get a really major turn down (a fifth wave).
On a short term basis,we’ve completed (or almost) 5 waves up so we should see another 2nd wave correction very soon. From the top of wave i, I expect a smaller retrace to around the 1.074 area (the horizontal line) before a turn up to continue the third wave.
More in the video, of course.
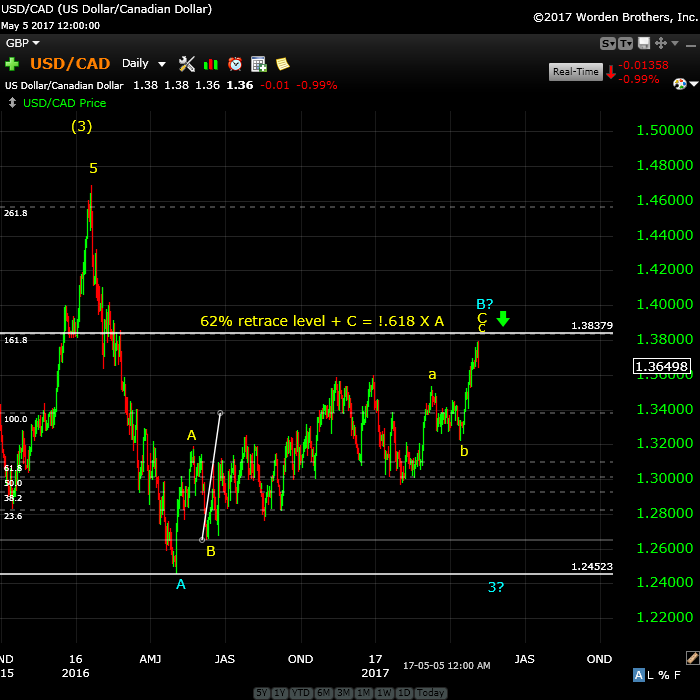
Above is the daily chart of USDCAD. We appear to have topped. However, there are short term options, which I cover off in the video. We’ve completed 5 waves down, but this looks like 5 waves of a third wave. To complete a proper fourth wave, we should retrace 38% and then head down to about 1.353. Then I’d be looking for a 62% retracement for a major entry short.
This high should mark the turn into to a multi-month wave down to 1.19. I would expect the turn to coincided with that of AUDUSD, as they usually move together. It may also coincide with the end of wave four in the US market.
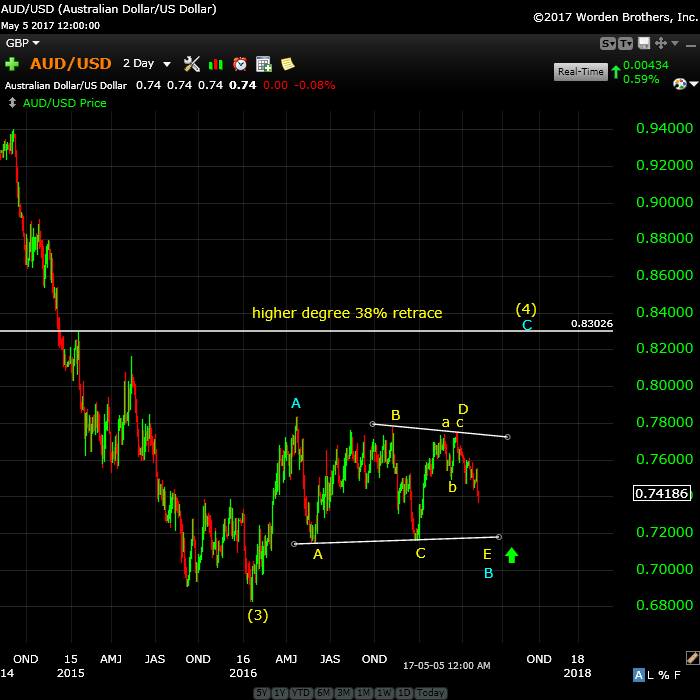
Above is the 2 day chart of the AUDUSD. We reached our target of last week. Now the challenge is picking an entry for the final wave up to .83.
Backing out the chart to a 2 day chart, we look like we’re completing a triangle. What prompted this is that all the waves appear to be in 3’s. This being the case, I expect a b wave up before a final c wave down to complete the triangle E wave. That would be the most likely place to enter for the final ride to the top.
This would make AUDUSD the last of the USD currency pairs to turn into the final wave.
I’ve an eventual top target of ~.83 for this pair, which is just shy of the 38% retracement level of the entire larger wave down (from the year 2011), which would make this wave 4.
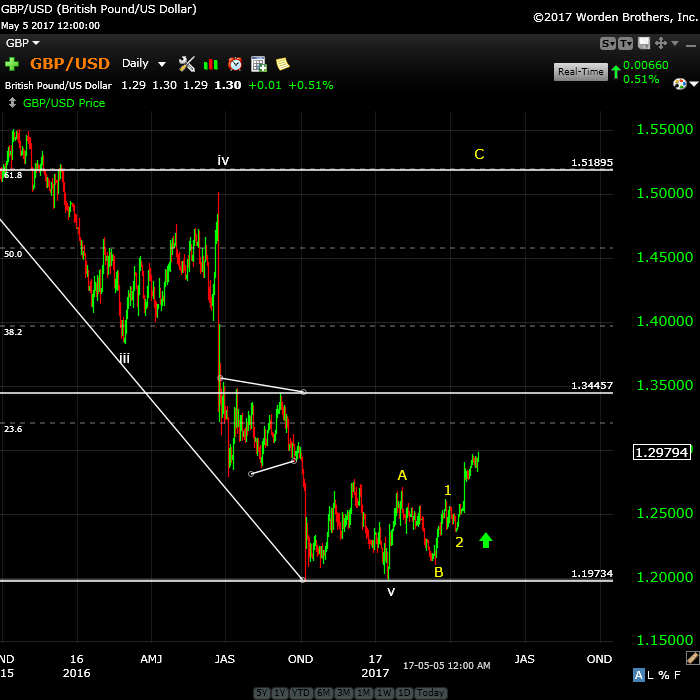
Above is the daily chart of GBPUSD. This week, we moved up to a new high. I expect the move up to continue to at least 1.34457 (a previous smaller 4th wave).
More information on the short term prognosis in the video.
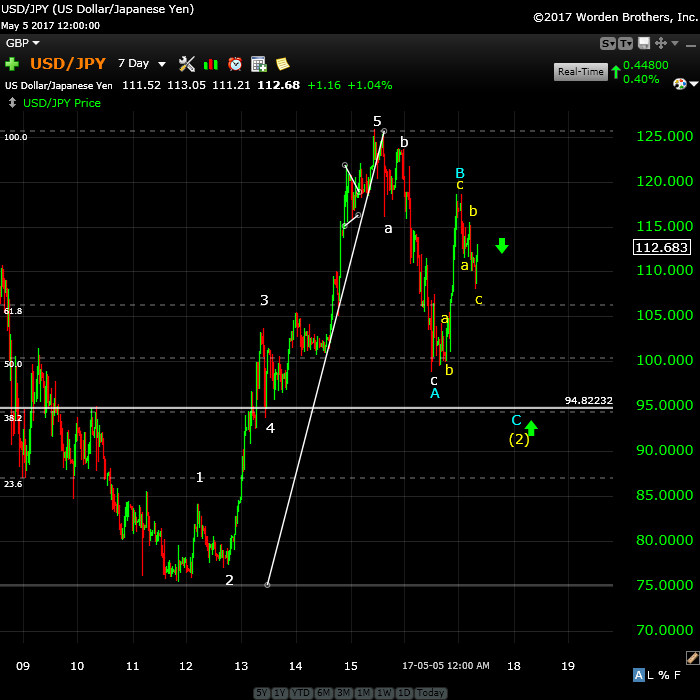
Above is the 7 day chart of USDJPY. Friday, this pair hit the target of ~113 and reversed. However, it came down in 3 waves and looks like it’s going to test the short term top. The best idea would be to wait for 5 waves down, but if you’re a pioneer, 113 with a stop slightly above would be a reasonable low-risk short.
I expect a turn down to about 98.75.
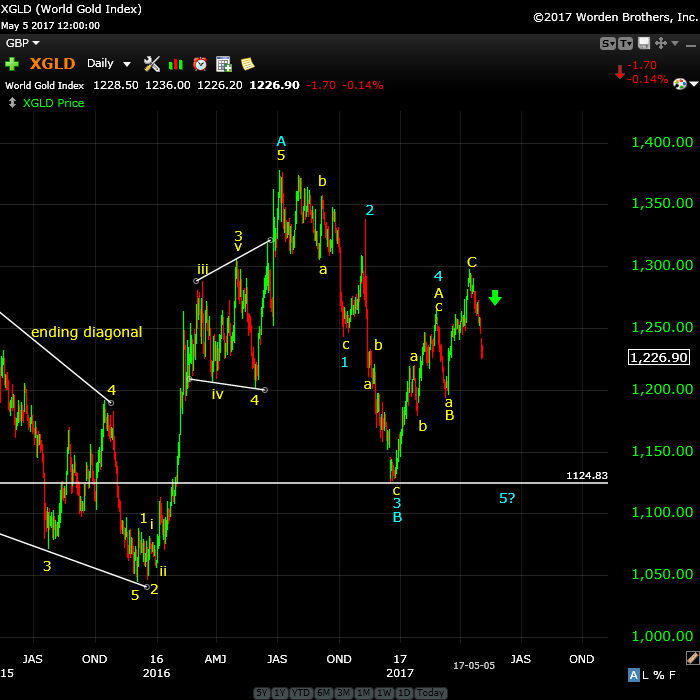
Above is the daily chart of gold. We’re now committed to the downside. However, I see more to come. A waves are really difficult to project out to an end, but a reasonable expectation for this wave would be the previous low at ~1196 before a B wave bounce. Then we should get a final C wave (or a 3, 4, 5) down to a new how at around 1124.
I’ll communicate a more firm target for the downside once we see an A wave (or first wave) down complete.
When we reach our target, we’ll turn back up. The final upside target is around 1585.
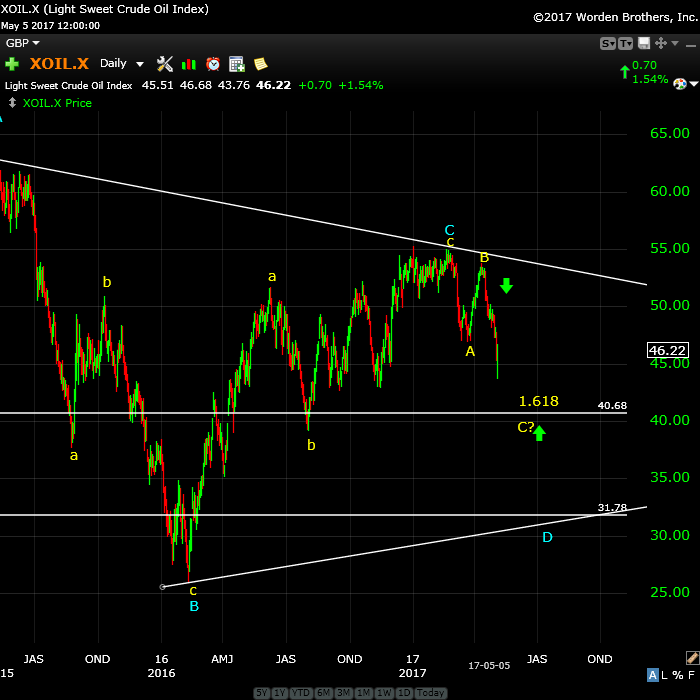
Above is the daily chart of WTI oil. Oil has dropped nicely into the start of the C wave and I expect it to continue down. The target for the present time is ~40.68. Expect a bounce around that area in a B wave.
The longer-term target is around 33.00.
Finally, we should get an E wave up to the upper trendline to complete the larger pattern. That would be followed by a final 5th wave down to a new all time low.
Good trading!
_______________________


Hi Peter
I am just wondering if you see a wave up in the USD/JPY to about 124 before the downturn. I am trying to read these on a longer term.
Still new at this.
Kurt
No, it wouldn’t make any sense based on the count. We had 5 waves up from 2012. It needs to correct that motive wave in an ABC pattern. That’s the big picture. I have at least 3 reasons why we should turn at 113, the largest of which is that we’ve completed 5 waves up in a C wave, which requires a retrace. Add to that the converging fib ratios and a major RSI divergence. I can’t come up with a single reason we should move higher.
Any thoughts on USDCAD retraced 50+% but dropped backdown. Is USD/CAD heading back up to previous top or was it just a high spike?
We’re in Bizarro World right now. No clue.
ES is heading down and so is the euro. That likely means USDCAD is going to a double top.
SPX went to a new high (barely) this morning so the count now matches that of ES. ES looks to have had an opening gap reversal last night but the subwaves down are really difficult to see. However, we’re at a new low (past an abc low fib level), so we should keep on going.
A really bizarre morning …
USDCAD – on second thought, this pair has just hit the 62% retrace level, has 5 waves up in a C wave, and may, as a result turn down here. It’s either that or a test of the top. If it turns down and reaches a new low, then the top should be confirmed.
just let me know when your getting in, for this or any other one.
I’m still short ES from Friday. I just got short USDCAD, but at a light level, as I’m not sure what it’s doing.
thanks, i went into es friday as well
USDJPY needs to test 113 and change, EURUSD needs a really good bounce (62%) in order to get short. Nothing else is moving.
Watch for a double top in USDJPY at 113.04. We’re getting close.
I got short USDJPY (small exposure) at 113.
I’m short too at 113.05
Hmmm. We hit my original target of 113.124 exactly. We’ll see if it holds.
Are you short oil Peter?
No, I haven’t been trading oil.
RE: USDCAD (good for our plan to short)
http://www.zerohedge.com/news/2017-05-08/speculators-have-never-been-more-bearish-loonie
USDJPY is up above my target so I’ve exited. I would wait for 5 waves down and 3 waves up for an entry. My entry was a pioneer entry.
This suggests there might be something wrong with my count.
Yeh it’s rocketed so seems to be doing something else
I’m sitting here trying to figure out a count on it, but there are too many options. It could be that this is the A wave of a move up to 118.62. It’s not done yet, but looks like it’s in the fifth wave (of what would be an A wave).
Or, what’s more likely is that it’s going to 114.596, which is the 62% retracement of the larger wave down. At that point, the target 98 is just about exactly 1.618 X the A wave down from the top. However, we’re going to need a smaller B wave because this wave up looks motive (although I can’t get any measurements to work).
Aha … it’s a zigzag. It should top around 114 if that’s correct.
114.5 is a more accurate measurement for a top.
Gone short again. Small stakes.
I want to see 5 waves down before getting too excited.
Looks like an ending diagonal at the top of USDJPY, which should be done.
So much for USDJPY. 🙂
The Market Update for Tuesday is live at the top of the post.
I put us very close to a top in NQ and ES and just about everything else.
Awesome! Was holding out for 2425 on Wave 3 from 2325 entry….but will take the 75 points! Where do you see a good short entry on SPX/ES?
If this is indeed a top, ES will need to come down to 2376 and then bounce to a second wave. We’re not coming down quickly and the waves don’t look right, so we may be looking at a test of the top before anything much happens. But I think a turn is close. Maybe we won’t really get it until the end of the day.
What is the entry pt to go short usdcad?
Right where we are, if it turns down here. Stop just above 1.3746. I don’t have 5 waves down yet, so it’s a bit early and speculative.
No pioneer entry for me on USD/CAD. WTI headed down & gold can’t make up it’s mind. I did take SPX/ES though. Saw 3 down and a 3up retrace at 61.8% and shorted.
gold, silver, and oil should have one more small wave down before a big bounce. I’m short ES at about 2399.
AUD hasn’t quite bottomed yet and I suspect CAD won’t really head down until it does. Right now, CAD could go either way, but it doesn’t have an awful lot of upside left.
1.3745 needs to hold in CAD. That’s the top of a potential 2nd wave. Third down from here .. potentially.
Nope. CAD not done. A new high, I’m afraid.
USDCAD now looks like it could turn around. It is corrective on the way up, so it could still happen … but nothing concrete to point to.
ES is toast, by the looks of it.
Need to see ES below 2390 (a previous smaller 4th).
Looks like we had an ending diagonal in CAD as well. Anything to make my job tougher …
Now we just need follow-through everywhere. 🙂
I’m concerned that we haven’t seen enough of a drop to confirm the top is in (ES/SPX). We may end up testing the high. So far, in SPX this could be a fourth wave.
I’d like to see a new low at the very least to help confirm we’ve seen the high.
Now, let’s see if we break 2390 ES, 2394 SPX
I’d have to say the top is in. We’ve broken the previous fourth.
Does that mean the top is in for USDCAD and USDJPY as well?
Yes, tops in both – the video is either live or will be in a couple of minutes.
We don’t actually have a full first wave down in USDJPY, but I’d say it’s topped. Same with USDCAD, although we should be in the third of the first wave.
North man trader also saying we should drop to near 2250-2280 so this aligns well with your targets
The Market Update for Wednesday is live at the top of the post.
Both Silver & Gold seem to be making U-turns. You think AP was off by 3 days for ES & the metals? He had Gold set for last Friday.
Andy had a turn date of 3-5 on the front of the publication, so I’m going by that. So, as I said in tonight’s video, I’d give it to him. On gold, don’t know about the 5th, but I still think gold (again in tonight’s video) has another small leg to go. The wave down doesn’t look finished.
I usually print out the Date summary page. This report it’s page 26. ES was May 3, Gold, May 5. We flip again on the 17th for Gold & Euro, and on the 18th for Equities & Oil. I did notice from the tone of this letter, he doesn’t seem as certain as usual for May.
Hi Peter
Is this a small wave up in Oil before the drop
Kurt,
All I can tell you is that the wave up is in 3 waves, so it will retrace. The entire wave down doesn’t look long enough to me, so I’d be expecting more downside before a more major retrace. Just don’t know anything more than that.
ES has now retraced about 62% of the wave down, so if you’re not in it, this is an excellent place for a short. We don’t want to be much above 2395.
I’m in at 2395 stop at 2400
I’m going to throw out a caution on ES. NQ (Nasdaq futures) look to have dropped a bit in a 3 (from the high). It looks like we may need to test that high.
That would suggest to me that ES may have to do the same (not sure, but it might). SP500 is near the 62% retrace level but has not hit it yet.
We’re somewhat in limbo at the moment and this may be why. If ES moves above 2396, it’s likely going back to test the top. Just a head’s up.
I think we’re waiting for USDJPY, which has gone to a slight new high. My upper end for it for a turn was 114.50. Perhaps that’s where it’s headed. I think ES will turn down from 2396 or so. It’s been holding through all the shenanigans.
It looks to me as if AUDUSD has turned up for good. .737 would be the fourth wave retracement, by the looks of it (where it is now). If it turns here, it should continue up.
Thanks will be getting in
Now AUD has dropped back further and the waves up now are overlapping. It also looks like a A wave, so no guarantees. The opportunity was at .737 if it turned there.
It might be OK but it might also completely retrace to the bottom or further.
Brutal market. The SP500 stayed in a range of $4 today. The wait goes on …
ES/SPX both went to a new high. I count us in the fifth wave up in this sequence. The market is telling us the upside is not done. I’d be looking at the 2400 area or even 2410 (my original target).
It’s also telling me that once it reaches its target (whatever that is), the downside is going to be ugly for bulls.
I exited ES and USDJPY, neither of which are totally topped, although extremely close. I’ll wait it out outside the market.
I’m short USDCAD, which appears to be in the third wave down.
The Market Update for Thursday is ready but youtube is apparently having processing problems, so I’ll have to send a comment when it’s don (or an email).
Pretty sure they AUD tick to the bottom had to do with RBNZ, New Zealand interest rate news. Was watching it at the time. Took the opportunity to go long at the bottom of it and average out my buy at .737 to exit the trade near even.
The bottom is pretty close, I think, to the longer term bottom. I didn’t want you to lose on that trade. Everything’s inching along …
Buy limit order in for .68421. With the shenanigans they play trying to get longs out before running it up, it may get hit, who knows. I’ve gotten lucky before like that.
I think .73 is about as low as it will get.
The Market Update for Thursday is live at the top of the post.
Is Usdcad going all the way back up to 1.379 double top or just to the top of 2nd 1.375?
Just got back in from a meeting. Yeah, my worst fear – mentioned in tonight’s video. The third had come down in three waves so far, so back to the top of it, I think. 1.375 is likely the target.
It was the first wave down from 1.375 that had an overlapping fourth and so I was a little leery of it and that was why I wanted a new low … but we’ll get it eventually. You can either enter at the top once we get there. Another good place is always just below the fourth wave at about 1.37049.
🙂
Never quite made 1.375. Does it have to make 1.375 on 3 wave retrace? USDCAD went below the 1.37049 as recommended for entry.
We’re not necessarily done. It doesn’t have to go anywhere special but it makes sense that it’s going to correct this set of waves down.
Looks like we’re going right back to the top. At least when that’s done, we’ll know the direction if down.
That drop down looked like a 61.8% retracement / counter-trend move on the way up. My measured first top comes at 1.37676, where it is now. Watching to see if we get a turn or if it wants higher. Might be a pioneer at this level with a very small position, just to try and learn how to do this.
Great. Now it needs to come lower than 1.37001, otherwise it’s just a scalp.
It doesn’t make any sense for it not to do a double top. I can’t see anything that’s topped. All close but we’re all wandering around trying to get there.
Hmm.. If it can stop on the way back up at 1.37495, we may have it, otherwise back to the top. The spike up was a hair above a 76% retracement to a double top, so I’m on the fence but leaning toward it going all the way back, especially if WTI turns down from here.
From an EW perspective, it has to top. The wave down from the top is a “3.” It could have been part of a 1-2, 1-2 down but that opportunity is gone. The only option is for a top to wipe the slate clean.
This final wave up should be in 5 waves.
This is one ugly market right now until things top/bottom. We’re all over the place, so be careful. Much better to wait until ES/SPX top properly. ES is down in 3 waves this morning, so I’m still expecting more upside.
More in the chart show a little later.
USDCAD going back to a double top by the looks of it.
ES: 2381 should be the bottom of this C wave down. It’s the 1.618 extension of the A wave down … or something else is happening. We would have to get below 2375 to declare a top is in place. The waves down are in 3’s.
Next red line on ES: 2377 is the C wave at 1.618 X the A wave. Then it’s the previous 4th at 2375.
Hi Peter
When is it time to get out of the Es for a short term profit and then get back in short
Kurt
Have you been reading my comments on ES this morning? I’m not clear on what you’re asking.
You have 2381 and 2377 and 2375 with different waves
If that is a down target what is the retrace target on the next wave down
The first two are potential bottoms, based on the length of the C wave. The 2375 is the previous 4th wave (which if it goes below this level, we’ve topped).
Does this make sense, Kurt? Are we on the same page?
Yes, if it retraces from this low what is your best guess at retrace point
2387 as an example before another leg down
The target is 2410.
Okay thanks
Something up with the chart show signup?
Instead of getting the usual waiting screen after registration, it’s replaying last weeks with today’s date.
Yeah, I was just noticing something odd. I’m checking it out.
I think everything’s OK. Everyone appears to be in the correct room. I think I just used last week’s show sign-up and changed the date, which obviously I should not do in future. 🙂
Although I see I got a notice for a show on March 30 … so I think the change-over to this new platform has a few minor bugs. I’ll work on cleaning up my old stuff this weekend. That may stop the oddness.
Hopefully today will go without a hitch. There are a lot of people signed up (twice the usual). I’ve done lot of work, so this show should be good.
Looking for a top, but we don’t have another turn date until next Thursday and at the rate we’re going, we might just wander around until then.
Here’s the link to the live room just in case: https://app.webinarjam.net/live/9001/081028f609/-1/
The Chart Show video is live at: https://worldcyclesinstitute.com/may-11-2017/
A big warm salute to all my contrarian Trader’s Gold friends!
http://www.zerohedge.com/news/2017-05-11/5-universal-laws-human-investment-stupidity
Right back at you Peter! Thanks for providing a ‘home ‘ for all of us contrarians. I learned a long time ago that if the majority of people said that I shouldn’t/wouldn’t/couldn’t do something that it was a confirmation that I was on the right path! Thanks for all of your excellent guidance through this difficult market.
Thanks. It’s the people here who keep me sane (not necessarily the free blog area … lol).
Head’s up if you missed yesterday’s zerohedge article on the Canadian Banks downgrade. I’ve moved the bulk of my funds to ATB, which is a public bank, based in Alberta.
http://www.zerohedge.com/news/2017-05-10/moodys-slashes-ratings-6-canadian-banks-fears-asset-quality-deterioration-soaring-ho
The Market Update for Friday is live at the top of the post.
Thank you Peter! On a big picture, looking less and less likely that the bear market in equities begins in 2017. With wave 3 taking forever and if wave 4 drops as much as we expect, may take a while to get to top of 5.
Does ES have to hit its target looks like it came up a bit short of 2383.5/.75?
Darin,
I show the retrace within one point of the target. It’s best not try to be that picky. I find that futures are less accurate than cash, particularly in these extremely low volume markets. I always keep a chart up of NQ and SPX to see what they’re doing.
SPX hit the target right on the nail (or perhaps a tick short—can’t tell). I just measured from the A wave: the C wave hit it perfectly (always so that measurement—it’s more accurate than the 62% measurement).
I’m not a daytrader (this is a swing site), so a point or so is not something I’d consider important. 🙂
I also see the waves up are in 3 waves (3 min chart) so you may still see a drop down to that again.
I’m expecting a very slowly moving market, as we don’t have that far to go and we seem to have a lot of time on our hands …
Starting to look from slow to moderately ugly. Was expecting the retrace, but not excited, since we couldn’t bounce and take out the downtrend line. I’m on the sidelines with ES / SPX for now. Will go back in on a retrace if we head up properly and break the line. Probably going to happen on the weekend, after SPX options expire.
Question — It’s sitting close to 61.8% right now. If it comes back to yesterday’s low, does that invalidate the long call?
Below the previous wave 4 would signal that a top is likely in (2375 in the case of ES).
Gotta love how they can manipulate an index of 500 stocks to the penny. Right smack at the closing bell, futures break to the upside.
Mike,
We still have to contend with 3 waves up, so expect a double bottom in ES before we really head up.
Yes, but it can double bottom and come back up before Monday. I was looking to take a position in SPX (which is only during market hours). Saw they were holding it all day to let premiums rot, so I waited until the close. SPY 240 calls were .54 at the open and .41 at the close (with Spy at the same level) so I grabbed a handful. It trades 15 minutes later than the close, and right at the close, they were back above .50. Only took 1/2 position so I can add to it on Monday, depending on where we open. Will look to get back into ES, but not worried. Had some stellar USD/CAD trades in both directions this week.
Good for you. Unfortunately, I was too busy to take advantage of all the ups and downs in CAD. CAD is up in 3 now, so it will need to double bottom.
I may get into ES and CAD on Sunday. Was mentally elsewhere today :-).
Nothing has changed in direction. I will get my analysis done tonight and likely post tomorrow morning. No surprises … (by the looks of it right now).
Came to the same conclusion a different way — From the bottom of the channel, it has to pass the middle to get to the top. If it doesn’t, it’s coming back down. Same thing in reverse.
I’ve been trading like this for a while, now I know to look for 3 or 5 waves instead of guessing what it may do in the middle.
🙂
The new weekend blog post is live at: https://worldcyclesinstitute.com/topsy-turvy/
Watch the video— it should be an interesting week!