
Here are some charts that are signaling an impending market turn (posted as at Monday, March 2, 2015 (CST).
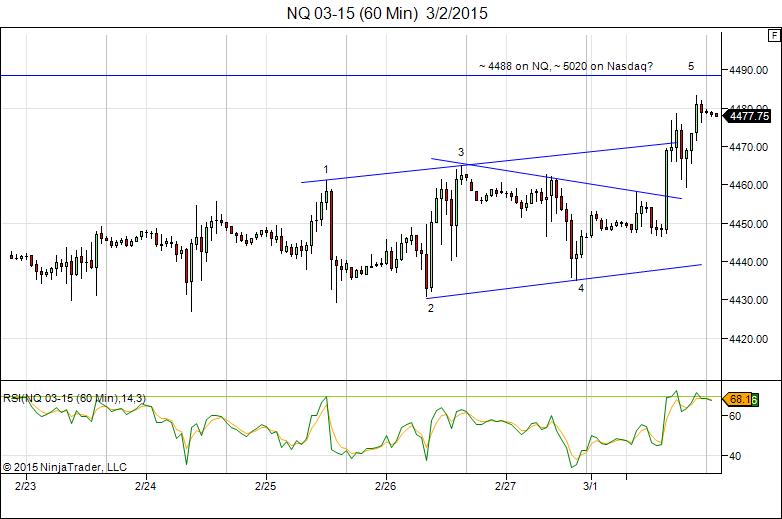
Above is a 60 minute chart of the NQ (Nasdaq futures). The pattern is an ending diagonal and we’re in the fifth wave). I’m looking for a top at around 4488.00. We first have to come down in a small 4th wave before completing the final leg up. I’m already seeing weakness tonight so I expect tomorrow to be a negative down day in the US indices.
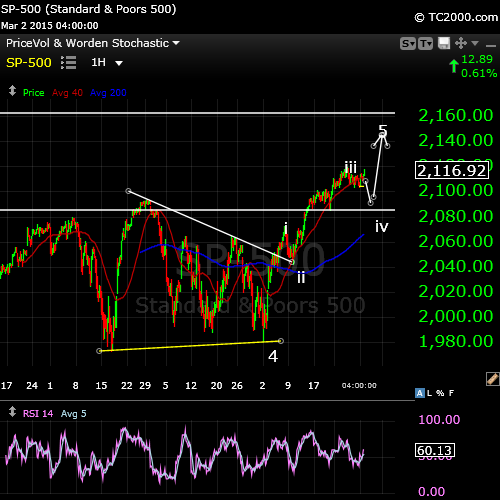
Here’s the SP500 showing the final 5th wave. We likely have a fourth wave down to complete tomorrow before a final wave up. The third wave cannot be the shortest wave (an Elliott hard rule) so the highest the fifth wave can go is about $2160. It will very likely top before that.
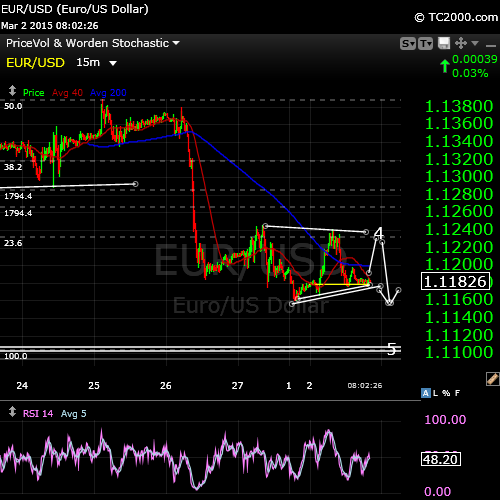
Finally, here’s the euro tonight. It’s an upside down image of the dollar. It’s completed a larger 4th wave triangle above it, but now it’s embarking on a smaller one. It’s starting wave e up tonight, which should drive the major US indices down tomorrow. And then the next day, I’d expect the euro to head down in the 5th and the US indices to head up in the 5th.
The equities and currencies are all moving in parallel to a great degree, based upon the deleveraging of debt. Lovely! But, potentially very lucrative.
And when this little move is done, so should a 300 year trend up.
Good luck!


