
 We’re Weeks from the Top
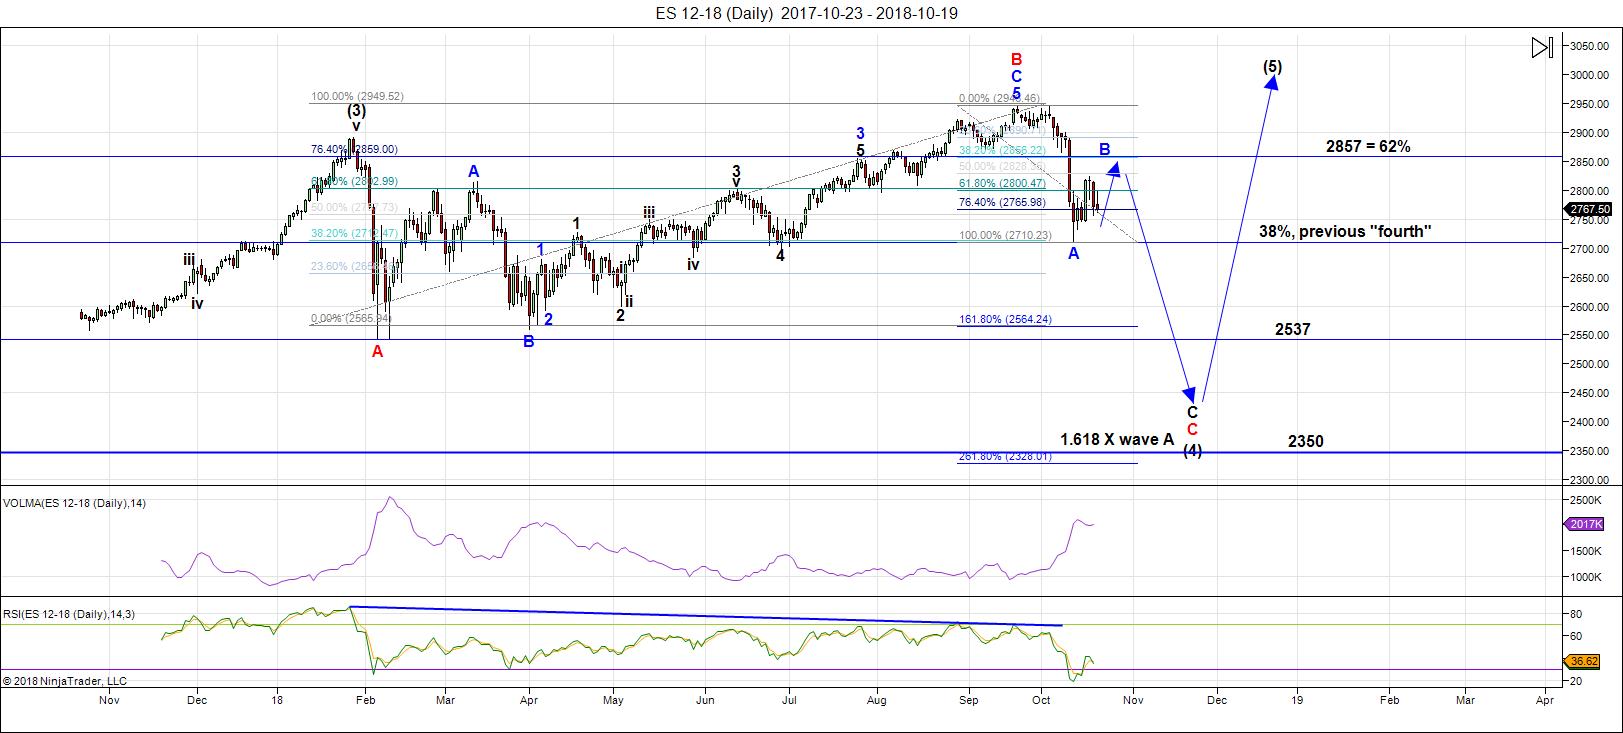
The balance of the C wave that we’re expecting some time this week will finish off the large fourth wave in ES/SPX that has slowly been tracing out its subwaves since January 29, 2018.
This fourth wave is so large, it eclipses any of the earlier waves in terms of size, clearly reinforcing the fact that the larger wave structure in the SP500 up from 2009 is clearly a corrective wave, a B wave.
As such, it is far weaker than its counterpart, the Nasdaq exchange. The NDX (and NQ futures) has traced out impulsive waves to the upside since 2009. However, both NDX and NQ are in fourth waves at this time and once they finish those waves to the downside, we only have one more wave up to go to a new high.
In the SP500, I do not expect that fifth wave to get very far above the current high. I’m expecting an end to the 500 year rally either before Christmas, or not long after. The crash always happens in the third wave, so expect that event a couple of months after the top.
We will have lots of volatility until then, starting later on during the current week.
I will be announcing my long-awaited webinar, Navigating the Crash, this week. I have an scheduled interview with Dale Pinkert (@forexstophunter) on December 6, 2018.
There are also three recent interviews on the main page of this site that I did with David Dubyne that are climate-based, but also talk about what’s going to happen in the future. I think they’re worth a listen.
I’m shifting my focus towards blog posts that will help people prepare for the financial meltdown: It’s time.
Andy Pancholi Turn Dates
For awhile, not much was happening with Andy’s dates. But we have to realize that the market has been going more or less sideways for almost 7 months and so while the turn dates might have been working, it would be difficult to notice any real effect from them.
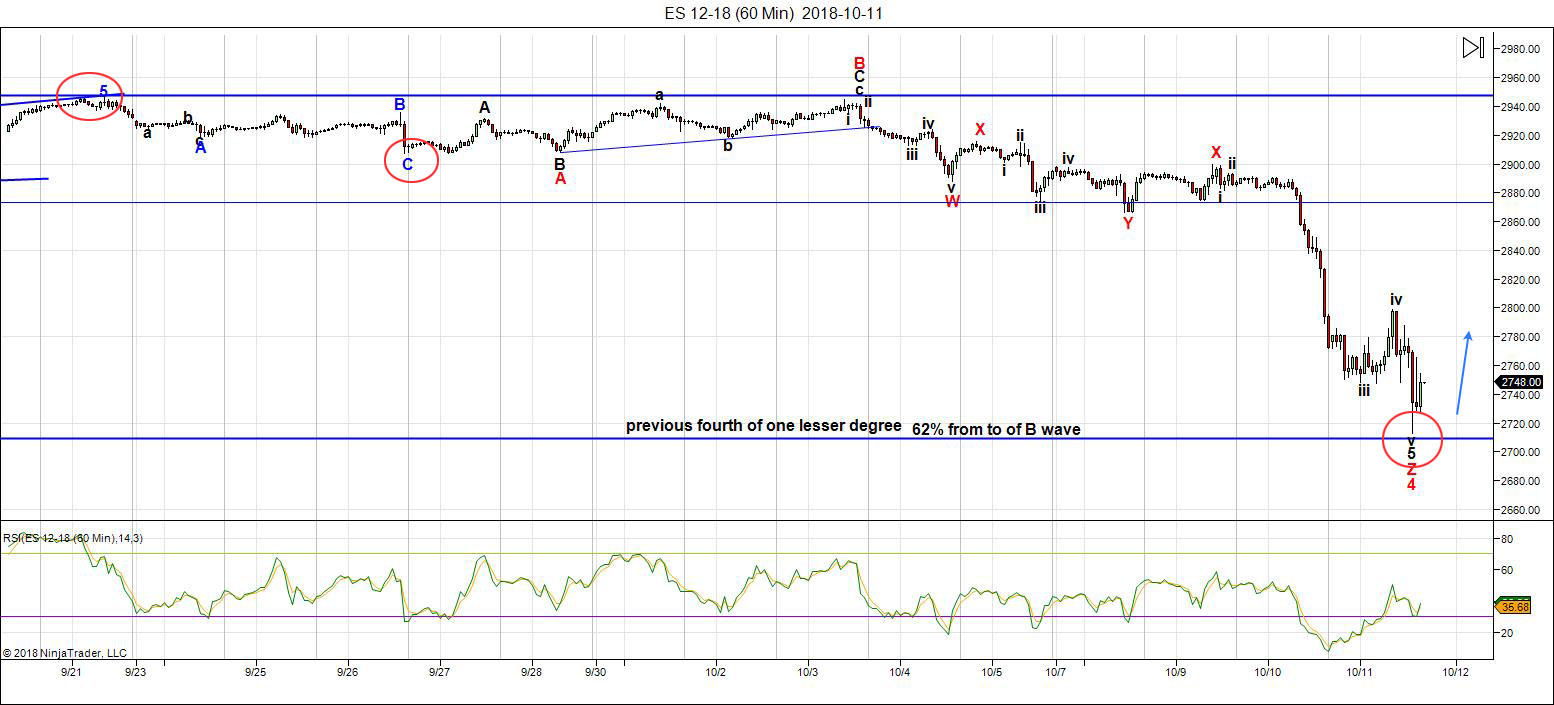
Above is the 60 minute chart of ES with red circles denoting the last three turn dates (before the latest one on Oct. 18).
Andy has nailed the last three dates for the SP500. Sept 21, we turned down. Sept. 26 was a turn back up after the ABC wave down, then October 11, was a turn back up to the upside. Finally, on the most recent turn date (Oct. 18), we saw another bottom, with a turn to the upside. That’s four in a row!
I provide Andy’s upcoming turn dates for each month as part of the Chart Show that I run every Wednesday at 5PM EST. It’s obviously highly advantageous to know what these dates are, if you’re a trader.
In this monthly Market Timing Report, Andy provides dates for the month ahead for
- The US Equities market
- Gold
- Oil
- The US Dollar
- EURUSD
To purchase a subscription to Andy’s monthly service, go here.
Elliott Wave Basics
There are two types of Elliott wave patterns:
- Motive (or impulsive waves) which are “trend” waves.
- Corrective waves, which are “counter trend” waves.
Motive waves contain five distinct waves that move the market forward in a trend. Counter trend waves are in 3 waves and simply correct the trend.
All these patterns move at what we call multiple degrees of trend (in other words, the market is fractal, meaning there are smaller series of waves that move in the same patterns within the larger patterns). The keys to analyzing Elliott waves is being able to recognize the patterns and the “degree” of trend (or countertrend) that you’re working within.
Impulsive (motive) waves move in very distinct and reliable patterns of five waves. Subwaves of motive waves measure out to specific lengths (fibonacci ratios) very accurately. Motive waves are the easiest waves to trade. You find them in a trending market.
Waves 1, 3, and 5 of a motive wave pattern each contain 5 impulsive subwaves. Waves 2 and 4 are countertrend waves and move in 3 waves.
Countertrend waves move in 3 waves and always retrace to their start eventually. Counrtertrend (corrective waves) are typically in patterns — for example, a triangle, flat, or zigzag. Waves within those patterns can be difficult to predict, but the patterns themselves are very predictable.
Fibonacci ratios run all through the market. They determine the lengths of waves and provide entry and exit points. These measurements are really accurate in trending markets, but more difficult to identify in corrective markets (we’ve been in a corrective market in all the asset classes I cover since 2009).
To use Elliott wave analysis accurately, you must be able to recognize the difference between a trend wave (motive) and a countertrend wave (corrective). There’s very much more to proper Elliott wave analysis, but this gives you the basics.
____________________________
Registration for Commenting
Want to comment? You need to be logged in to comment. You can register here.
If you register, it protects your information. It also allows you to comment without filling in your information each time. Once you’re registered, simply go to the home page and click on the login link top right in order to log yourself in. Usually, you’ll be logged in for several days before needing to be logged in again.
______________________________
Problem receiving blog comment emails? Try whitelisting the address. More info.
______________________________
Have not had a losing week RW 2
Have not had a losing week …I have been with Peter almost a year. The only thing that matters is have I made money with his service. I think I have finally turned the corner using Peter’s EW. I have not had a losing week in the last 5 months. Thanks Peter, for your amazing amount of hard work. —RW |
Get an upper hand … JC 2
Get an upper hand in trading …Seeing all the different currency pairs and the wave structures and hearing you explain why this has to do that on a nightly bases gives one a upper hand when trading. Elliott Wave applies to all stock and indices and can be applied to any candlestick chart. If someone ask what you want for Christmas – Tell them a membership to Peter’s “Traders Gold!”—JC |
The best of them JL 2
The best of them …Last couple of years, I subscribed to several ‘market traders’. You are by far the best of them and the personal contact is awesome. Daily and daily updates are very well written! Besides your expertise in EW, I also like your cycles analysis. Best investment I ever made! —JL |
Tops in your field DZ 2
Tops in your field …You are tops in your field. Tried to follow Elliot Wave international for years. They were always behind the market. After discovering you, I perceive that you are an expert in reading the waves, which puts you way ahead of the rest of your peers. And you can read the Waves like you are reading tomorrow’s financial section. I pray you stay healthy. —DZ |
Rise above the rest … SM 2
Rise above the rest …I have only ever met a few people who, in their chosen fields (astrology, medicine, music, martial arts, technical analysis), rise above all the rest and you are one of them…you have ‘the gift’…and that’s why I’m a Trader’s Gold member. —SM |
A true expert in Elliott Wave FL 2
A true expert in Elliott Wave …You are a true expert in EW analysis. What you provide is not available anywhere and is priceless. Subscription on your services is the best thing I have ever done. Many thanks for your effort to make me a better investor. I now have more trust in my investment decisions. I hope you will continue the excellent work! —FL |
Couldn’t be happier … KK 2
Couldn’t be happier …The analysis and insight you provide is simply amazing! I’ve been trading the futures and equity markets for well over thirty years and usually average around 5% monthly. Since joining your Traders Gold Service two months ago, that number has better than doubled. I couldn’t be happier.—KK |
the real deal SM 2
The real deal …‘Educational, insightful and thorough market analysis for all levels of traders. It’s Elliott Wave at its best….Peter Temple is the real deal’ —SM |
The Market This Week
Here's the latest daily chart of ES (emini futures)
Above is the daily chart of ES (click to enlarge, as with any of my charts).
Last weekend, I noted that the wave down from 2948 was in three waves, which means it's corrective. I count it as a triple zigzag. That was not what one would expect if we have an expanded flat on our hands (an expanded flat should be a five-waver to the downside, even the first wave).
On the NQ side (NASDAQ futures), the similar move produced 5 waves. In this case, we'd expect a 62% retrace; my preference here is that we have a regular flat unfolding, which should trace out a C wave in 5 waves.
So, we had a non-confirmation. I ended up leaning 60/40 towards a partial retrace of the entire wave down, rather than a full retrace. Because this week's wave up is clearly corrective, the partial retrace pattern is now more probable by a wide margin.
Look for a turn down again this week into the balance of the C wave.
A review of the bigger picture: The three wave move down brings into question the flat projection;, however, there isn't another corrective pattern that fits the overall wave structure. So, until the market tells me differently, I would label this pattern an expanded flat. However, technically, it could also be a running flat.
That means that the ES/SPX has multiple possibilities as to a target on the downside. Accuracy (in determining the most probable target) is going to depend upon both counting and measuring the waves to the downside. It's impossible to pick a downside target at this point in the process.
Volume: has picked up considerably on waves to the downside, which is to be expected.
Summary: A non-confirmation between the wave structures of ES and NQ brings into question the expanded flat projection for ES; however, lacking a more probably outcome, that's the most probable outcome. Expect further weakness after a slightly higher retrace. We should see a resolution this week.
My preference is the larger structure (from January 29) represents an expanded flat. Once the c wave (down) is complete, expect a final fifth wave to a new high. That fifth wave up to a new high will be the end of the 500 year bull market.
___________________________
Trader's Gold Subscribers get a comprehensive view of the market, including hourly (and even smaller timeframes, when appropriate) on a daily basis. They also receive updates through the comments area. I provide only the daily timeframe for the free blog, as a "snapshot" of where the market currently trades and the next move on a weekly basis.
______________________________________
Sign up for: The Chart Show
Next Date: Wednesday, October 31 at 5:00 pm EST (US market time)

The Chart Show is a one hour webinar in which Peter Temple provides the Elliott Wave analysis in real time for the US market, gold, silver, oil, major USD currency pairs, and more. You won't find a more accurate or comprehensive market prediction anywhere for this price.
Get caught up on the market from an Elliott Wave perspective. You’ll also get Andy Pancholi cycle turn dates for the SP500 for the balance of the current month. There’ll be a Q&A session during and at the end of the webinar and the possibility (depending on time) of taking requests.
All registrants will receive the video playback of the webinar, so even if you miss it, you’ll be sent the full video replay within about an hour of its conclusion.


Hi Peter
In the last chart, shouldn’t Black 4 should be black (4) and usually, its placed at the end of red C, not red A ? Thanks! pdl.
Yes, correct. Missed it. I’ll move it at some point later today.
Thank you SIR PETER for another notorious and fabulous update..looking like 38% retrace may be all we getting..SPX futures down another 20..imma gonna go short at open tomorrow. New c wave low looks imminent..Should be a nice ride to 2400! The top is in..finally!
Thank you Peter T for your time and effort on the free blog.
Jeff T
tks, Jeff.
Peter T,
Thanks for the informative post, So now we are waiting for it to go higher over 2800 and then reverse. It case reverse anywhere from 2800/2832/2857 correct?
pretty much, yes.
Thanks Peter T,
Any time frame how long to reach your C wave down to 2400/2532. rough guess 4 weeks.
A lot shorter than that, I think.
Coiling action in the indices points to a big move just ahead. The banksters are not going to make it easy though. I would not be at all surprised by a counter- trend upward thrust from the coil ahead of the next decline.
1929 + 89 (Fibonacci years) = 2018
https://twitter.com/JeffCooperLive/status/1054112062941519872
after Jeff Cooper Tweeted “An Array of Crash Square-Outs” I sent him a DM that included a chart with some other date ‘relationships’…stay tuned!
on another note, do you recall the posts the past few years relative to NYAD being different this time…NOT!
VERY interesting.
If we get a fifth wave down now to complete an initial impulse, that November anniversary date sets up nicely for a manic second wave ramp, and then……KA-BOOM! 😛
Yes Mr Verne..looks like we are on the way to SIR PETERS 2400 target..should get a new low today! Glad I went short yesterday.
New Low..Adding to my short position to ride the train down to 2400! Thanks SIR PETER. You called it again!!!
Peter T,
Does it change your views, Or do you still think we go higher to 2800/2856 before going back to 2532.
Thanks for your input.
We already had a 38% retrace..looks like thats all we got before next move down..once demoncrats win mid terms that should spark the collapse IMO.
Yes, But Peter T was expecting a retrace over 2800/2856, If we have to retrace that high we might take all of nov/dec and then decline comes in jan/feb. May be ??
Spx already hit 2816 on 17..that was all that was needed in a retrace before next leg down.
Next stop should be 2,443 on SPX.
May be… But thats not what Peter T meant this weekend when he said retrace to 2800+. Not sure if he has changed his view.
This is either a fifth or third wave to the downside. The price action in VIX suggests the former. Either way, I think we should look for at least one more day of declining prices before we hit an interim bottom.
i have we are in 3 of (3) but lets see what unfolds
Very possibly. If you are right, VIX will make a new high today.
So far so good. We are now looking at some recovery. But the real Low is on Thursday. If I follow my indicators. From Thursday morning I go long until Friday ends. Just see http://www.prognoseus500.nl/
We could make a double LOW Wednesday early morning and early Thursday morning. But the second low wil be lower so we go further down in the next week on Tuesday/Wednesday. I think.
Be carefull
There are quite a few bear flags flying across several indices. The pole lengths suggest we have a ways to go to the downside.
Yes Mr Verne..my target is 2443 on SPX. We only got a 38% retrace in B wave..then 1.618 in C wave which this looks like to an old fox like me.
I think you are are right. The banksters are failing miserably to step in an force an artificial bottom the way they used to routinely in the past. It will be hugely bearish if that long shadow candle we are seeing today is once more negated by the bears. Remember this is the exact same kind of thing we used to see on the interminable run higher over the last few years, as bearish signals were repeatedly negated. Could we see the same thing in reverse on the move down?
I am looking forward to a confirmation of downside targets in the Chart Show tomorrow. I really like that fib tool thingy! 🙂
Anyone have thoughts on the scenario that we just completed the b wave of an expanded flat on SPX and the ES futures as part of this B wave of the larger C wave? 1.6 of wave A on SPX (2710-2816) is 171.5 which from today’s low of 2691.4 gets us to 2862.94 within five points of Peter’s retrace target for all of B?
I am not sure how probably that expanded flat is, but with the way the move down from that 2816 occurred looks pretty corrective.
from what i see a little higher correction is still in the cards..
Incredible technical damage inflicted on the market. Any bounce at this juncture I would consider to be corrective of a developing impulse down, which based on all the bearish signal still extant in the market, has a ways yet to go. The long candlestick tail today is testimony to the valiant effort being put forth by the banksters. Nevertheless, they are tilting at proverbial windmills. I expect the carnage to continue. Time to SELL THE RIP!
im seeing a few divergences in the cash dow that are leaving a bit mixed .
the 16 higher weighted stocks in the dow now have 5 waves down and the chart looks pretty much the same as the cash dow .
the 15 lesser weighted stocks in the dow though , as a group , are still above the oct 11 low ( think of andy’s turn dates mentioned from peter in this post )
these lesser weighted stocks peaked on sept 21 and made a lower high on oct 2
these stocks as a group do not have anything close to 5 waves down and are still above the feb 27 high’s .
to add to this , the 10 day adv decline line is now into an oversold reading which is above the lows it made on oct 10th .
on a shorter term 60 minute chart the 5 bar and 10 bar $issu is showing a short term oversold reading .
Today being oct 24th e have a full moon .
oct 26th we have venus conjunct the sun
nov 6th becomes a morning star ( another piece of the venus bull cycle )
Venus Rx in Scorpio: October 5th – 31st. Yes, that’s Halloween.
Venus Rx in Libra: October 31 – November 16th
Venus Direct in Libra: November 16th ( venus turning direct )
Venus Direct in Scorpio: December 3rd.
Nov 23rd is a martin Armstrong turn date . ( need to look it up but almost positive )
That’s the positive .
The negative , On Nov 7th the mars Uranus sub cycle peaks and turns back down again . Historically this portion of the cycle can be extremely bearish and this cycle bottoms jan 20th 2019 .
statistically from nov 7th to jan 16th is bullish a high % of the time .
Bottom line : There are bearish cycles as well as bullish cycles that will be kicking in which leaves the market most likely all over the place .
to add to this : Mercury retrograde begins on November 17!
( November 17 to December 6 )
add 10 days to Nov 17th and you get Nov 27th To Dec 16th.
Mercury retrograde is not always bearish mind you it can go either way .
my point is we are entering a Venus bull cycle and we are still in a mars Uranus bear cycle, the advance decline line is becoming oversold , the 10 day trin not oversold.
Expect more confusion yet the end result is higher prices next year with fewer and fewer stocks participating !
Many stocks have most likely already put in there highs for the next several years yet the index’s can and most likely will hold up and make new high’s .
watch the commodities markets as the colder weather comes and position money accordingly .
Those bankers are failing Verne ??? Just kidden around.
YM continuous contract , .618 retrace at 24569 ( feb lows top all time high )
.786 retrace at 24617 ( June lows to all time high )
25027 was the 50 % retrace ( feb lows to all time high )
Id prefer to go long near the levels noted yet I doubt they will be more than a very short term trade.
I also agree with Peter G in regards to the 10 day trin .
the 5 day trin sum is another indicator . you add up the 5 closing numbers .
each day you just drop the 5th day back and add the current day .
a reading of 4.00 is overbought and is rare to see but it happens a fair amount of time . readings between 6-7 are considered oversold and at times you will see readings as high as 9 which when seen you just buy blindly ( not completely blind mind you )
the past 5 closing numbers on the daily trin : .93 1.34 .80 1.37 .73 for a total of 5.17 which not oversold nor overbought . since these are based on actual closing numbers I have found that it is best to let the market close before entering a trade and then make the trade the following day .
I see no reason to take any long positions at this juncture even though I would not be surprised to see the market begin to improve .
The 5 waves down if it is indeed a clean 5 wave structure implies Tuesdays lows must hold short term and as of this morning im not ready to claim that based on what im looking at .
im giving this market this week to clean itself up abit and actually prefer a flat to down market before looking to buy a handful of stocks.
good luck all
I sometimes get the impression that I am looking at a market completely different from what others are seeing. One analyst I saw is now calling for a multi week bounce in some kind of b wave, and that VIX price divergence, no less, supports that viewpoint. This individual, who is a CMT, clearly cannot tell the difference between price and price action, capitulation and suppression when it comes to VIX. The gap uo that remained open was one clue, the flagging price action was another. But what do I know?
As to market ambiguity, I must again be missing something.
We have years long trend-lines decisively broken.
Several indices falling away from 200 day MAs
Well over a month of consecutive new lows (around 80!) in NYSE
What looks to be a confirmed H&S pattern in DJIA. etc, etc.
I guess I could be missing something.
You have to allow for a possibility of a wave “B” bounce and for a potential ending diagonal. Given an important turn date that we are at, it would be reasonable to expect a strong bounce. How we end up labeling that bounce will become clearer with time. Staying short at these prices isn’t easy for me. I would be a lot more comfortable selling a bounce or selling a break lower. Right here, right now (ES @ 2715) I expect a bounce. In case markets decide to keep going lower, then I will have to re-assess.
What I see are relentless attempts to establish an interim bottom with long candle shadows being ruthlessly steam-rolled. It is not as if they are not trying. I agree that one must always allow for any possibility, but you’ve gotta trade what you see, not what you expect!
Current trend is down….
Since 2016 bottom, this market has displayed those long candles at the lows (including big ones in Jan and Feb earlier this year). Maybe the character of this market is changing, but I am covering my shorts here and will decide later if we have truly entered a new paradigm. Shorting has been difficult last few months and I am happy that I am coming out ahead through the whole exercise. Time to take my chips and walk away for a bit.
Verne
all good points made and ill add
The question im asking is this :
is the cash dow now forming its neckline of a larger head and shoulders top ??
the 10 day Trin is sitting at 1.25 at the moment yet the market is not closed
so its not the official number but its doing what it should be doing.
Peter G mentioned the 1.30 level and I have posted I watch a reading at 1.40 .
the 5 day trin sum will be closer to a reading of 6.00 if the market closes at these levels .
the 10 day advance decline line is not making new lows as of yet .
oh and just because I see today that there were several packages sent to democratic leaders which I really think is fake news to sway the elections .
bottom line : the market is not yet giving offial oversold readings yet it is getting closer by the day .
its beginning to look like a panic is setting in .
a continued sell off into the close is preferred .
im waiting for the close before commenting further .
Added to short positions yesterday and today..looking good! Expecting a bounce..then down to 2443.
NYA- 11741 11732 range is do able .
also its about to make new lows .
done for the day
letting the market close and thinking of the long side tomorrow
but NO signal as of yet to do so.
YM Levels im watching 24617 – 24569 as noted early this morning still stand .
NYA though 11741-11732 where wave C equals wave A .
Next week might be the better time but short term we might be done by tomorrow .
ill see what the market actually does before deciding
5 day trin sum :
todays close then counting back :
closing numbers :
1.90 .93 1.34 1.37 .73 = 6.27 total . this is a normal oversold reading.
a 5 day sum into the 7 to 9 range is not out of the cards yet as of todays close
this is an oversold reading .
10 day trin closed today at : 1.13 which is anywhere near the 1.40 level I look for
the 5 day trin closed today at : 1.27 which is closer to the 1.40 level yet still leaves more room to the downside .
the 5 day advance decline line closed today at negative 1022 which is an oversold reading . at the feb lows this indicator was negative 1369 , the 10 day advance decline line closed today at negative 455. at the feb lows this indicator sat at negative 940 .
what all this implies is more time is needed to give any meaningful bottom.
the 5 day $ issu is at an extreme oversold reading yet the 10 day is not .
an ideal bottom should show the 10 day readings on all these indicators into oversold readings which as of today im not seeing . the 5 day readings though are showing these readings .
Bottom line: I cant rule out a big bounce yet I would prefer more time takes place before positioning for a longer term swing trade to the upside.
Very short term im watching NYA at levels posted above .
The YM futures hit its downside objective today and exceeded it .
Keeping my powder dry through this week and will see what these indicators show over the weekend .
Further note : the stocks that make up the dow are showing an oddity which does not confirm todays sell of which is very odd for me to see.
That said todays market action was a daily outside day reversal to the downside .
cash dow only : 23679 – 23672 is the next lower range and below that I get 22913.73 .
Bottom line : lower levels can be seen by Jan 20th 2019 .
NYA should be watched closer if we see a further sell of over the next couple days .
That is all I have to offer at this juncture . its up to the market to show me more data before going forward .
Next up is the 14 day RSI
a close below 27 is rare ( anything below 30 )
if everything can come together at once it makes forecasting a bottom
The best signal will come with dual capitulation spikes in VIX and VXX. The long wicks we have seen so far suggests that a lot of folks are jumping the gun and getting steam-rolled for their efforts. Capitulation spikes are hard to miss if you know what to look for and will be confirmed with positive divergence in index momentum indicators. We are clearly not quite there yet but maybe the next day or two. I am still about 20% short.
$util has satisfied its wave 2 as of today .
If this wave count is accurate then i expect US Treasury bonds to get pummeled !
Higher interest rates appear to be inevitable as i see it .
Verne
glad to hear your thoughts on the vix
its not a tool i use all that often yet i do look at it .
i Have one other indicator i use a lot yet have not typed
in the data to see.
for me it is a combination of indicators ,
The spx / vix for instance
anyways im finished for the day and will add in more data
over the weekend .
just an example for you to see what i mean.
be sure to look at all the data available .
https://www.tradingview.com/symbols/spread/SP%3ASPX%2FCBOE%3AVIX/
Joe, I don’t know where you get your data for up-down stocks and up-down volume but I use the WSJ as my official numbers source. At today’s close, the simple 10 day TRIN (Arms Index) was at a relatively neutral to slightly oversold 1.15. That does not yet qualify for oversold in my book. For those of you who follow ratio-adjusted McClellan Oscillator and Summation Index readings along with the 10d TRIN and have historical records, look at October 12-14, 1987 and see if you notice a similarity with the past few days!!!
Ouch – the similarity is uncanny. Similar levels here would mean 2583 by tomorrow and 2440 by friday’s close. And then Black Monday ! Maybe those 1 week puts are still very cheap !! Yikes.
Peter G you continue to represent a voice of reason…
https://worldcyclesinstitute.com/us-indices-running-on-fumes/comment-page-1/#comment-33652
Today will be crucial in deciding which of the two outcomes we are looking at. In case this is corrective, we should get that decline and reversal soon. If its Peter G’s analogy, then we will close at the lows right below 2600 and then go lower tomorrow. I am buying some short dated puts as I covered all my outright shorts yesterday.
Ben, thank you for that question on the chart show it was mine as well..
thoughts..
I do follow other people and interesting to see the different opinions
Armstrong..interest rates will continue to rise and will not fall because of pension crisis..stocks and dollar will rise due to capital flowing into the USA because the rest of the world will be sucking wind..bonds will implode..due to rise in rates..
I follow another well known elliott wave chartist…says it is possible to still have the wave IV down…but feels that most of the larger companies are already in bear
so more likely that V is done..
he has it that the dollar is going to rise and is in wave III up…
and that TLT is going to 80’s..
With all that i did sell my UUP ytda because I can see what Peter is saying .as a possibility..and figured can buy back in if the dollar does break the trend line..
if so will be in the III up…
Time will tell all..but I agree very frustrating to figure out any direction
Interesting comments Marie. I am with Peter T when it comes to TLT. I have seen many technical and Elliot analysts over the last 20 years get rates completely wrong. 5y5y fwd rate is the one that follows Elliot rules better than the rest of the curve (for spot rates, you keep getting overlapping waves in both directions at smaller time frames due to the nature of bond markets leading to confusing forecast). When people talk about bond markets, most of them do not distinguish between credit quality of bonds we are talking about. Can some muni bonds go belly up – absolutely. Way too many states have their Pension liabilities climbing faster than they can handle and there will come a time when no one will lend to them. However, to extend that to US treasuries is not that simple. As we have seen with other Central Banks, the FED will end up buying almost the whole stock of USTs. Think about US Housing in case mortgage rates were to go to 6%. That would mean a 50-60% jump in monthly payments for households compared to 2016. There is already a slowdown there and it will accelerate if rates were to go higher. Volumes are already lower, and next step will be lower home prices which will drive OER lower, causing a sharp decline in core CPI. The FED will change from hawkish to neutral to dovish in a matter of months. I am hoping that 10y and 30y get to Peter T’s target from yesterday’s chart show. Treasuries are the only asset I will feel comfortable holding once equities top out. A lot of technicians are calling for an end of 40y bull market in rates. I still see that the 5y5y forward is about 25 bps away from tagging that trend line. I think we do touch it around December and from there, turn much much lower in yields.
One would not ordinarily expect rates to rise in a deflationary environment.
I do think Marty Armstrong has a good point. The problem is not only pension funds, but also the astronomic global dollar denominated debt, most of which will be defaulted on. I can see a scenario in which rates spike higher not due to anreFED response to inflationary pressure, but due to FEAR….!
Do you think treasury rates will rise due to fear of default by US treasury ?
exactly…
That is an incredibly fascinating question Vivek and I have no idea how it is going to play out.
We know the FED follows the market on rates and not the other way around. The fear is going to initially come as sovereign and corporate debt implodes, so while the fear may not be directly linked to fear of US default on Treasuries (remember they have the power of the press), the carnage in the wider bond market will affect Treasuries as well as bond holders adjust their expectation of not just perceived, but actual risk as bond defaults explodes.
Great question though. I know what you were thinking.
My own view is that the bond market will greatly distinguish between bonds that will default and the ones that won’t. As that happens, spreads between those bonds will widen dramatically. So rate of 30y US treasury may fall down towards 1.5% while the rate on Illinois 30y General Bond rises to 7%. Something similar happened to bonds of Fannie and Freddie in 2008. In that case, the FED and US Treasury stepped in and the spreads compressed back. During a period like this, there is a strong desire to move capital from risky bonds to safe bonds (as we are seeing right now – the spread between German and Italian bonds). Given the amount of easing required to prop up the economy, almost 80% of Treasury Bonds will get owned by the Fed (just like BoJ and the POST owns Japanese govt bonds). In a deflationary environment, the demand for cash goes up (the front end rates will likely go negative – as is the case in many developed countries right now). Any instrument that decays into a cash like instrument goes up in value. Given the inherent convexity of a bond payout, the percentage increase in face value of a 10y treasury will be of the order of 30%, while 30y goes up by 50%. The equivalent move on TLT would be to about 165-180. All this would be happening while some of the riskier bonds drop from 100 to 40 due to risk of default. A lot will depend on which bonds the federal government decides to bail out. In the last credit crash, the federal government bailed out almost everyone except Lehman Brothers and the small guys. Whether they do it again remains to be seen. We are seeing in Europe how difficult it can get while they try to do so. Given the public mood, bail outs may be tougher next time around. In that case, the overall average bond yields (which would include all types of bonds) will go up, but treasury yields will fall lower. If Armstrong thinks that credit bonds will fall in value, then I am in agreement. The trade for me will be to buy TLT and sell LQD.
Peter G
I use Esignal for most of my data .
I had 1.13 for the 10 day ave on the Trin which is not a big difference from your 1.15 and I said that the reading was not even near the 1.40 level I look for .
it was the 5 day average I had at 1.27.
what I was saying is the 5 day readings were oversold and that the 5 day trin some was showing an oversold reading .
also the 5 day advance decline line . $Add I use a 5 day and 10 day average
again it was the 5 day averages but not the 10 day averages that showed oversold readings .
the 14 day RSI also was showing bullish divergence .
I focus primarily on the cash dow .
I also use the individual stocks with in the dow based on their weightings .
yesterdays drop left me with a mixed message and todays rally is not a surprise .
Lastly :
while I do use some untraditional timing methods which still point to a cycle low on jan 20 2019 , from my perspective we also have other bullish cycles beginning .
todays bounce fits .
Im not saying the bottom is in and were off to new highs im just saying this
market now has a bullish cycle to consider along with a bearish cycle and they will effectively wash each other . More sideways action would not surprise me .
I have tried not to post my thoughts on the spx nor get overly caught up in the wave count at this point .
I am in agreement with Peter T from the broad point of view and do not wish
to take away from his posts .
The 5 day trin SUM
because of yesterdays 1.9 close ( roughly )
it will take a minimum of 5 days including today to come up with a very short term
overbought reading of 4.00 . that runs into early nov which is also a mars Uranus subcycle high . not sure how this is going to work out going forward because of the 14 day RSI readings nor the technical venus bull market cycle which is now in effect .
we will see how the market moves over the next week and the reaction we see following the Nov mid term elections ( not that the elections really matter )
My focus is more on jan 20 2019 then right now
Technically though from what im looking at, its hard for me to see anything all that bearish.
until next week : )
Maybe you will get your 5-day reading of 1.40 TRIN today !!
$util has satisfied its wave 2 and should now be entering wave 3 to the downside .
the downside objective is to 150 ( No Typo ). It closed Thursday at 741 and change .
Joe – just one caveat on Utilities vs rates argument. In 2008, Utilities dropped 50% while 10y rates moved from 5.50% to 2%. I don’t think the next cycle will be any different. A lot of bond like investments can get hammered while treasuries rally to a new all time high. They are the only instruments that I see can give you a positive return in the initial part of the downturn. Muni bonds will likely collapse (as happened in 2008 – just a lot worse this time). I know people mention Gold, but in the initial part of the move, Gold got hammered as dollar rallied in 2008. You can switch out of treasuries into Gold at that point (assuming you can still safely buy physical Gold – and that is a big assumption). I am going with Peter T’s count right now. In that outcome, treasuries will sell off into end of Dec – that will be a great time to buy treasuries.
ES at new low..my target on spx is still 2443..imma about 50% short right now..adding to short position on any rebounds.
Seems like short is the right trade for now. I have covered all my outright shorts and trading this from the short side only using options. Vols are still too low for the kind of moves we are seeing. I am too apprehensive to stay outright short.
I have been following $TRIN after Peter G’s comments. It is still showing that people are not afraid. I guess VIX is saying the same thing. We are down 10% and there is very little fear. Unbelievable. No flight to quality in treasuries (maybe some, but vols there are even more muted). I just bought some more calls on TLT for peanuts. Earlier, I wasn’t fully convinced we can go all the way to a full “C” target on this move. But lack of fear even at these levels is definitely surprising. Verne – whats your take on VIX ? I don’t have enough history of looking at that as an indicator.
The absence of fear is truly stunning!
The banksters appear to have been eminently successful in destroying the financial survival instincts of the herd.
Looks like Andy nailed the turn date again..with a high on Wed @ 2,742..now down..down..down..til next turn date!
Hi Joe,
Are you getting your number January 19, 2019 correlating to oct 19, 1907, which correlates to 2011..? if so I see where your coming at..
and if so…i think I need to stock up on some cash ;)))
I am out of 90% of short trades.
I am still holding a batch of 3X ETFs as I still have not seen any true capitulation selling, and that is when the 3X instruments really shine!
Marie
Im getting Jan 20 2019 based on the mars Uranus crash cycle .
its next sub cycle high is nov 7th yet the cycle low is jan 20th 2019 .
Arch Crawford and ramond merriman did a study on it several years if not decades ago and went back 86 years, I dug through their work back in 2004 and have used it since. The original guy who did the study was James mars Langham I believe and he wrote about it in his book in the year 1939 . The history of this cycle has been studied by people much smarter than me . I follow it because of its history yet I will say this . It is a bearish window more so than a guaranteed works every time method . based on what we are seeing taking place today I feel it is worth paying attention to .
It nailed the Bottom to the day in march 2009 and has had its successes and failures over the past several years . The same holds true with the venus bull market cycle . It nailed the march lows in 2017 and it is turning up now .
that cycle was studied by Barbara Koval in her Book time and money which was written in 1990 I believe , she went back 100 years in that study . I have followed that as well for over a decade. The indicators I use I learned from the late Jerry Favors . He was an excellent technician and a very good market timer . I followed him for several years before he passed away and I would put him at the top of every newsletter I ever paid for . I studied his work as well .
The late George Lindsay was the most consistent market timer in our time.
his work is also worth researching in depth .
As of Fridays close I will say the same thing I said a few days ago .
The individual stocks that make up the dow as I see it are still not confirming this sell off . That doesn’t change the cycles though nor the bearish implications going forward .
I can make a case that wave A down is complete as of today and that next week will be the start of wave B up. the move should take the cash dow back up towards 25800 and the ym dow futures back up towards 25822 in a perfect world .
That said I see the 5 day trin still needs at least 3 more trading days before giving any overbought readings . with the various indicators I use , the 10 day trin has yet to give an oversold reading , the Wave count can be considered as having wave A complete as of Fridays close. the advance decline line as I look at it is showing bullish divergences .
NYA has a downside objective oif 11741 to 11732 where both wave A and wave C are equal . At todays lows this index hit 11847 which was not that far away .
The mars Uranus sub cycle high which is due on Nov 7th points lower from that date into jan 20 2019 .
that said from a statistical point of view , nov 7th to jan 16 is a highly statistical bullish time period .
Bottom line : I don’t like fighting statistics yet I also don’t like fighting my own cycles work .
I expect the market to trade all over the place between now and January 20th
Mid November to late December I expect more volatility than even what todays market action showed .
Get in and get out is all I can say at this point and don’t marry any speculative positions .
I have no idea how the mid term elections will play into this yet because of the cycles as well as the statistics along with mercury going retrograde I would be very careful with any trades I make .
Thank you Peter G and Thank you Peter T for your posts .
Enjoy the weekend everyone .
“The individual stocks that make up the dow as I see it are still not confirming this sell off ”
Joe, again, I have to conclude that I must be looking at a completely different market than you are. Granted I have not looked at the DOW in minute detail, but for months now I have been watching in amazement as the lion’s share of the NASDAQ advance has been driven by fewer and fewer stocks in a narrowing breadth unlike anything I have ever seen previously. The same is true of SPX.
When you look at the grand-daddy of the markets, NYSE, what you see there is an astonishing month or more of around 80 stocks making new lows DAILY!!!
Over 40 is considered a serious situation.
Considering all the other signs this market has been throwing off for months now, including the unprecedented constellation of Hindenburg Omens, and also breach of critical trend-lines reaching back to the 2009 lows, I do not understand how what the market is doing can possibly be a surprise to any one paying attention.
I recently read some smug big bank analyst claiming that the sell-off was being driven by “dumb money”, and that the “smart money” was not in the least concerned.
I certainly do agree that despite the steady rise in VIX, complacency still abounds. We have seen nothing even close to resembling a selling climax. I guess insiders and institutions under his definition would have to be considered dumb. The gentleman writing this piece is supposed to be a derivatives expert so I will leave it up to the reader to decide if he is that clue-less stupid, or just duplicitous.
Here is the link to the Wells Fargo analyst’s article who imho has the exactly OPPOSITE interpretation of the implications of the current VIX price action than what it actually implies.
https://www.bloomberg.com/amp/news/articles/2018-10-26/listless-vix-says-sell-off-reeks-of-dumb-money-to-options-pits
A new weekend blog post is live at: https://worldcyclesinstitute.com/the-us-market-momma-speaks/
This website is for educational purposes relating to Elliott Wave, natural cycles, and the Quantum Revolution (Great Awakening). I welcome questions or comments about any of these subjects. Due to a heavy schedule, I may not have the time to answer questions that relate to my area of expertise.
I reserve the right to remove any comment that is deemed negative, is unhelpful, or off-topic. Such comments may be removed.
Want to comment? You need to be logged in to comment. You can register here.