Update: Approx 11:20 EST, November 13
The larger, previous fourth wave is at about 2017 SP500 so I suspect that’s where we’re headed. Or close by.
_______________________
Update End of Day, November 12
What might be playing out is a leading diagonal, which would mean we’d next want to see a second wave which would retrace at least 62%. https://worldcyclesinstitute.com/leading-diagonal-2/
Not sure yet where we’re going, but this option is back on the table after today’s action. If this is, in fact, the pattern that’s unfolding, it would mean we already topped on November 3.
__________________________
Original Post (November 11):
“Waiting for Godot” is a well-known absurdist play by Samuel Beckett. It’s the story of two characters who wait aimlessly in vain for the arrival of someone named Godot. Hopefully, we’re not waiting in vain, nor aimlessly, of course!
But this has been a long, frustrating wait, nonetheless.
Bottom line: My prognosis hasn’t changed. We are in the last small leg of a C wave in a large countertrend move that will turn to the downside within the next few days.
Cycles and Astro: November has lots of turn dates for equities, the dollar, and other currencies for Nov 10/11 and we have a new moon on Nov 11 plus we’re at the tail end of the minor lunar standstill, which happens every 9.3 years (the last one in 2006).
We also have a bunch of unexpected solar flares and sunspots erupting this week.
Short Term Charts
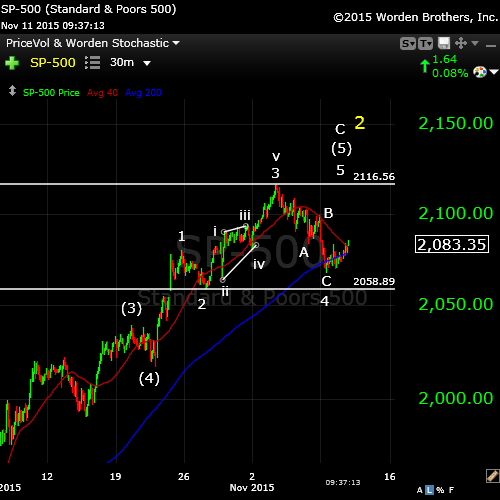
A look at the SP500 from yesterday shows that we’re in a final fifth wave. What is disconcerting about this wave is that is has an odd structure and did not come down as far as we would expect it to. So, the market is doing the usual frustrating thing it usually likes to do! Let’s zoom in …
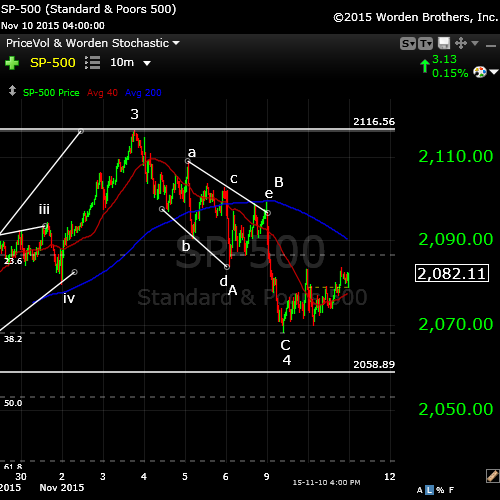
Here’s a 10 minute chart of the SP500 showing the wave down, what I’ve now come to the conclusion is wave 4 and should retrace to the previous top at 2116 or so. I’ve drawn in what appears to be a triangle, but it also ends up in an ABC configuration.
Many of you know I’ve been flirting with the leading diagonal idea which came from the configuration of the futures market. It is not an option in the cash indices and so I’ve discarded the idea. The horizontal line at 2058 shows the level of what could be counted as the previous 4th wave of 1 degree smaller, so we haven’t come down very far at all. Fourth waves typically retrace to the previous 4th wave or 38%. So, this is a minor 4th wave or finishing wave.
Overnight in futures, there were points where it appeared it could roll over, but by this morning, it appears to be well on its way to a top.
____________________________
Currencies and the Dollar
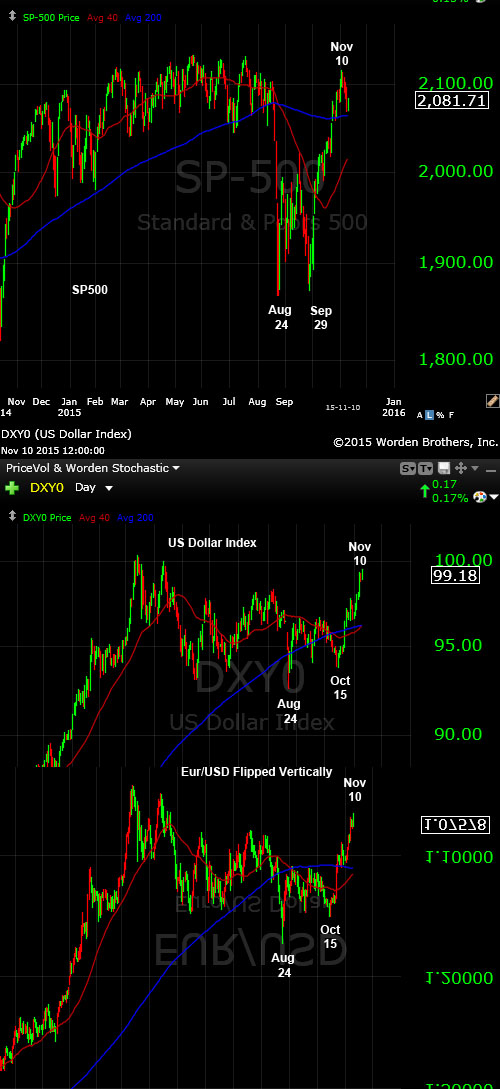
Above is a daily chart of the SP500 (top) and then a daily chart of the US Dollar (middle) and finally, a daily chart of the euro/dollar (bottom), which is flipped vertically to show how it inversely lines up with the other two indices. I have been watching these three indices for months now.
Years ago, Robert Prechter talked about “all the same market” in that when deleveraging of debt became the key factor in the markets internationally, they would all start to move together. I have been watching the Dollar chart (middle) start to line up with the US indices and get more and more aligned over the past few months.
What appears to be happening now is that the dollar is short-term topping and this should cause the US equities to turn down. I think this is why we’re seeing the equities about to turn now.
It’s no secret, if you’re an Elliott wave counter like I am, that the euro and other dollar pairs are about the turn. Their waves and virtually complete. The big picture is that I’m seeing the imminent turn of all the dollar pairs. In fact, we appear to be in the last wave down today.
Keeping this in mind, it seems to me that the US equities market may top as the currencies bottom (or top, in the case of the dollar).
_________________________
Two Alternate Scenarios Going Forward
As motive as this C wave is, it does allow the argument that we have just completed a third wave up. The argument would be that this is a larger degree fifth wave we’re completing to a new all time market high (an ending wave to a market top would need to be in 5 motive waves).
In this case, we would need to complete a 4th wave down next, which in the SP500 would drop 38% of the length of the C wave. In the SP500, this level would be 2024. It would be a wave in 3 waves.
There are a couple of reasons I consider this scenario unlikely:
- Because of the structure of GDOW, I’m of the opinion that the US indices have completed a first wave down. As I’ve stated above, it’s unlikely the DOW and other US indices would do something completely different that the Global DOW, which has clearly finished a first motive wave down and a second wave up in three waves.
- An ending wave of 5 waves includes the first wave up. All these waves must be in 5 waves to qualify. The first wave of our regular flat corrective structure (since August 24) is clearly in 3 waves.
However, I plan to watch the waves down closely to see how they unfold. They should tell the story.
There is one other scenario. We could also complete a C wave down to a new low below Aug. 24 and then start a fifth wave up from there. Because of the structure of the GDOW, I think this scenario also unlikely. If we were to also look a fundamentals, in terms of the strength of this market, I would have to argue that it reinforces the unlikeliness of this scenario. It would take another QE situation to help make that happen. The FED, quite frankly, is out of tools to make that big an impact on a dying market.
History: The 1929 crash
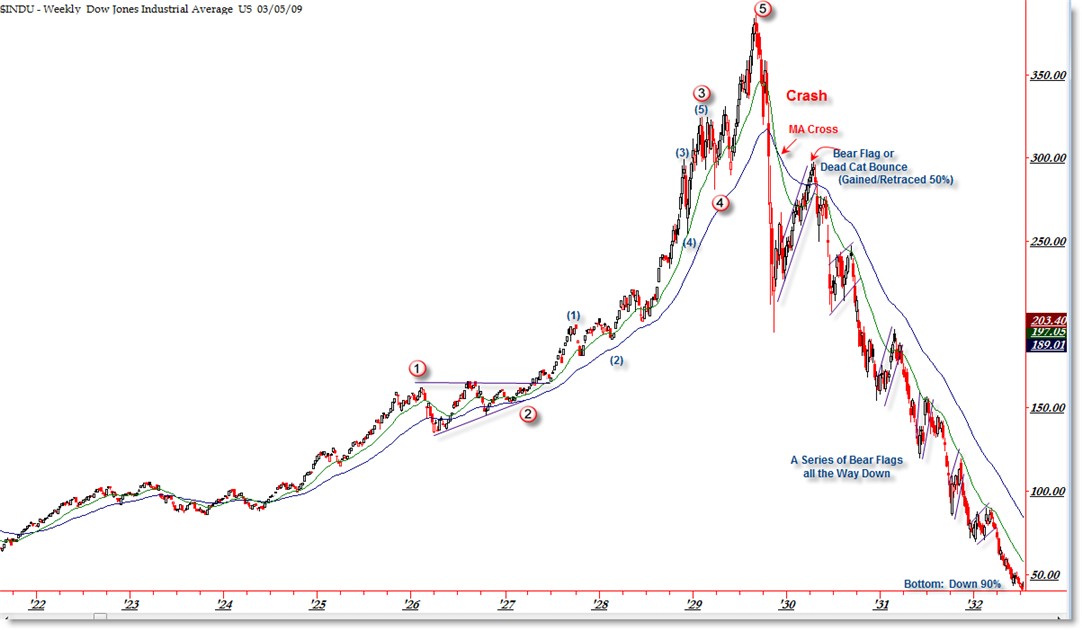
I think it’s important to look at 1929 and the wave structure (above and below), which was the same as 2007—to a point. I will show the 2007 crash below in the “What If” section.
The wave structure of the 1929 crash was in 3 waves overall. There were 5 waves down from the top (the A wave) and then a very large B wave retrace. The final C wave down was a stair-step affair and lasted over 2 years.
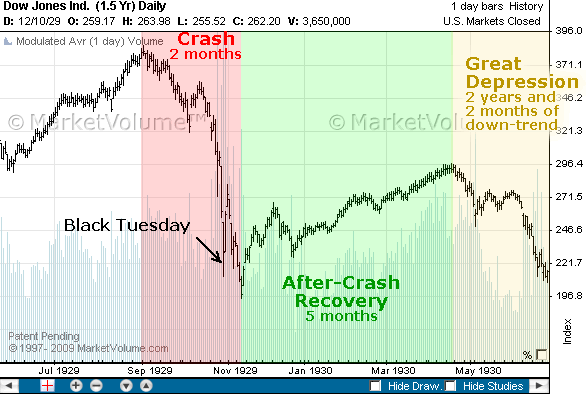
Let’s look a little close at the timing of the 1929 crash because the similarities to today are uncanny.
The market peaked on September 3, 1929 and then it took 2 months for the crash to actually happen (to reach the bottom of wave 5 of the A wave). The larger crash which we always hear about began on October 23, 1929. Then there was that large B wave, which lasted 5 and a half months and finally (which I explain a little further in the cycles section below), the C wave which went on for more than 2 years. This might be the scenario we’re looking at going forward.
Keep that December 12 date in mind for the bottom of the A wave.
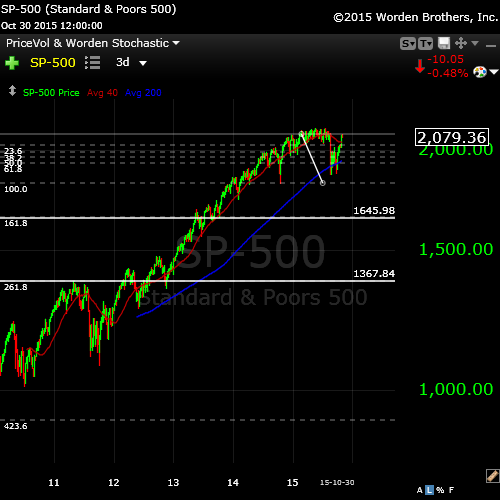
Finally, let’s take a look at a big picture of the SP500 and project the bottom of the third wave down. I’ve drawn a couple of horizontal lines on the SP500 chart to suggest ending prices for the bottom of the A wave.
If the full wave drops 1.618 X the length of the first wave, the bottom would be at 1645.98. *
If the A wave extends to 2.618 X the first wave (historically more likely), the bottom would come in at about 1367.84. *
* I haven’t recalculated the target numbers based on today’s action. They won’t change substantially.
______________________________
“What if”—Without the FED
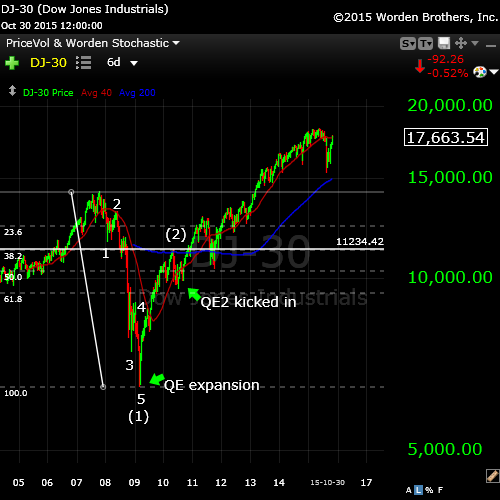
Above is the 2007 chart of the DOW. I’ve marked the motive wave down so that you can see the configuration compared to what should happen today and to what happened in 1929. Note that wave (1) came down in 5 waves and then we retraced to the 62% level. We Elliott-wavers thought we would turn down at that point, but qualitative easing had its effect on the market and up we went.
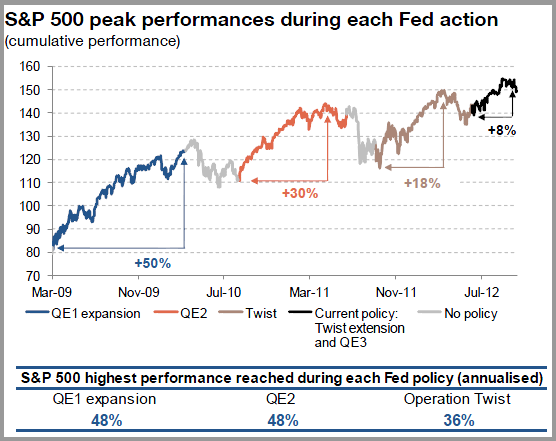
It’s interesting to note the correlation between the QE segments and the movements of the market.
Below is a chart of the various segments of quantitive easing undertaken by the FED, with their dates, so you can see how they applied to the DOW chart above.
____________________________________
Cycles Analysis
This is my cycles analysis from tonight (Nov 3, 2015). You can click on it to expand.

Above is the long wave in SPY. In the analysis tonight, this wave returns the highest percentage of trade wins of the 25 cycles the program finds, trading both the bottoms and tops of the cycles over a period of 12 years. I show this to give an idea of the larger cycle running through SPY (and the SP500) and where we are tonight in relation to it.

This chart uses a compiled display of all the cycles the program finds.
This cycles analysis uses Techsignal X from the Foundation for the Study of Cycles. I’m using data going back to 2002 this analysis of SPY (SPX) and displaying a compilation of all the cycles the software has found over that period.
This analysis suggests a cycle top of October 19, so we are overdue for a turn down.
It shows a bottom to this set of waves down at December 8, 2015. There are Gann and astro projections for a December 11/12, 2015 bottom from different, very credible sources. I would suggest that these dates are the dates to watch.
Looking Ahead Even Further
You can see on the above chart that we bounce after the December expected bottom. The cycles analysis shows a bounce that lasts through mid June of 2016. This would be consistent with 1929. The fourth wave bounce in 1929/30 lasted 22 weeks, which is about 5.5 months. From December 12 to June 12 is, of course, 6 months. This suggests a similar scenario to the 1929 drop.
I’ve gone a little deeper into what the analysis is telling me on a separate page. Here’s a more in-depth explanation of what this chart is suggesting.


Thanks, Peter,
if we break below 1958SPX before testing 2116 does change your count ?
1958? Not sure why you picked that number … my count would change long before we got down that low. This wave down has all overlapping waves, so it’s committed now to a retrace. It is likely to be very slow. A dangerous market.
Sorry, 2058
Dmitri,
It would change the degree of the 4th wave correction, but it would still be a corrective wave – a longer wait to get back to the top. A corrective wave can’t magically transform into a motive wave. It has to retrace and start over as a motive wave.
I have a hard time imagining how this corrective wave is going to do anything other than eventually test the previous high.
It could drop down lower, but this morning, it looks like we’re completing a second wave.
Peter–Just read GoDown and I have a question. What happened to the value of the USD in the 2008 meltdown? It went up some 25%?? Food for thought. Gary
Yeah, good question. Looking at the charts, it came way down starting in 2006 and ending mid 2008 (as gold headed up). If the dollar were to come down now, it would be in a countertrend move (a corrective wave), so eventually, it would have to turn and go higher. I’m expecting it to go higher longer-term.
But currencies have to correct, particularly AUD and CAD and even EUR has not been able to get to a 38% retrace. The other issue is gold and we’re expecting gold to head up, which to me calls for the dollar to go down. But gold would also be in a corrective wave, slated to do down much further in the future. It seems to work (for me) short term.
Peter-
Perhaps SPX will now get unfinished business finally completed ( down to ~2059 ), before heading up to ~2116 ?
Charlie,
Not what I’m seeing, but it could …
Hi Peter,
today is new moon (11) so thinks will be down quicker..lol
André,
Can you let your light shine on timing? I see that Monday is important looking at my Gann system. Might Friday or Monday be the top of wave 1 or 2 of big 3.1/c.1 down?
Cheers,
W
I can tell you the 16th and 23rd and the really important dates according to Andy Pancholi https://worldcyclesinstitute.com/market-timing-report/
From an EW perspective, we now have a first wave up from 2070 or so SPX in five waves and a second wave in place, so we’re set for a third wave up tomorrow.
Hi.
I would like to read the free report but somehow I could not open it after I sent it to my own email.
Vince
Hmmm. It should be a zip file. Let me go check it out …
It certainly worked for me. But I went in and made it a PDF file, so it will now just open and then you can save it as you like. Let me know if that doesn’t work for you. https://worldcyclesinstitute.com/market-timing-report/
Hi ,
Thank you .Read it.
I hope you are right on this last count and I am sure you will have many more members.
Vince
Thanks, Vince. It’s certainly looking good tonight. Futures are headed up in a third wave of the fifth ….
Peet!
So 16 is Monday, also significant in my system! So that might be the top this Friday/Monday right? 😉
Cheers,
W
A very good possibility, I’d say.
The 16/11 Bradley Siderograph crosses the 0 – line which I mentioned on a recent post that it marks strong trend changes and 18/11 is as well an important turning point. So additional confirmation of an important turning point. The next turning point are around 22-24/11. So it really has the incrediants to become a bloody week.
Jaze
DJ2000 gives 11/14, 90 degrees from 10/26. 11/16 we’ll have the sun at 233 degrees; cardinal and major fibo number. 11/17 sun conjunct Mercury. Gravitys give a high on Sunday.
So I expect a major reversal in the weekend. Will this be a new high? I doubt it. But the timing is significant enough for the market to test. So a pull up into the weekend is likely.
This weekend I’ll give some more Gann timing to support this.
Cheers,
André
It was certainly an interesting night last night! Eur/usd set up for a big wave down and had done one wave down now. It’s at the top of wave 2 at the moment, ready to start wave 3 down.
Every time ES started up, it got slammed back down. So we’ll open a little lower – I think right at the previous 4th wave ….
As the eur/usd heads down, ES seems to rise. I also find looking at usd//jpy helpful as it somewhat mirrors the cash indices.
And the gold is breaking down.
How far ?
Yeah … extremes everywhere. I’m watching GLD and it think it should turn around here.
At least we’re now down to what I would call a “complete fourth wave.”
Well, the eur/usd was set up. Wow, everything is super volatile.
If there are actually MORE than four companies like this, those “in the know” are rebalancing portfolios. The stunning reversal in silver and to a smaller extent gold is pretty amazing this morning.
http://www.zerohedge.com/news/2015-11-11/energy-credit-risk-spikes-back-above-1000bps-no-one-putting-new-capital-here
Gary,
And this is why I think the markets are all moving together … credit/debt. They’ve slowly moved into sync over the past couple of years.
So much for the “reversal” in gold and silver. Just another HFT algorithm raid. A reversal is when “people” have an emotional ah ha moment and readjust their portfolios. Reversals don’t unreverse and go back to new lows. Unless of course it is just unemotional computers pulling the trigger.
I am slowly coming to the conclusion that currencies have reversed.
I am more convinced now that the dollar has turned. usd/jpy heading down, eur/usd heading up in motive waves.
Now back to the equities. This final wave down is motive from 2087 SPX. So this brings me back to the leading diagonal idea. But if that’s the case, I still put us near the bottom of the entire wave down and we would require a second wave. I’m now somewhat on the fence as to whether this is a fourth wave or a first with a leading diagonal. Leading diagonals are so rare that I have no information on how the waves would measure out. Need to wait to see what happens next.
Not as convinced about the dollar after a lot closer examination and I’m still leaning towards a fourth wave. But we’ll leave the leading diagonal as an alternate.
Peter,
may be you should come back to your alternative scenario of the corrective forth wave before the large fifth to the new highs fueled by CBs in December
Dmitri,
It is now possible. This fourth is looking large enough now.
Let’s see … if we measure the first wave of this large C wave and consider this fourth wave has bottomed here, and that the fifth is likely to be 1.618 X wave 1, that puts the ultimate top at a new high at about 2150 SPX. Definitely could be.
So I think the two top line possibilities are a top at the previous high, or a new high (or even a top at the market high). Three choices. (I really don’t think the leading diagonal is viable).
NYSE obviously is not going there, Nasdaq and SP500 could, and the DOW is a maybe. I think we’re more likely to roll over before then but I certainly don’t know and have nothing to indicate anything either way.
If ES comes down here 62% and turns, that would be a good entry.
ES looks like 5 up … that’s why I say that.
What a brutal bottoming process. SPX might be forming an ending diagonal … we’ve got to be close. It would have to drop another couple of dollars to complete the ending diagonal.
I see the same thing in ES.
Ah … the euro has now completed a flat. I think ready to head down again.
Incredible reversal in gold.
They have chased the stops below recent low.
Peter – as I understand, es 2050 is top of previous fourth (inverse), thus serves as potential bottom of W1 down; BUT we are still completing 4 down of correction (haven’t gotten to top of 5, yet, to complete correction). So, es 2050 may serve as both – bottom of 4 of correction and also bottom of W1, when it finally heads down, after the correction eventually tops out?
Yes, the fourth wave level is an important one going both ways. It also usually serves as the stopping point for the first wave. You should see that even as we head up in the fifth wave. The first wave up should go to about the previous fourth wave before we get a second wave. It’s amazing how organized the market is.
amb,
That level going up in SPX is about 2087.
I figured about 2089….close enough; now, let’s see it get there! I gotta be patient!
Thx, Peter – amazing what i have learned in such a short time with your mentoring.
Well … even with these tools, this is an incredibly difficult market to figure out, primarily, I think because we have all these opposing forces changing direction. Really dangerous to be in as it reminded me last night.
WOW – previous 4th did not hold it. Both spx 2058 and es 2050 failed.
It’s an ending diagonal. We should see a dramatic turn now. Should be done.
USD/JPY did exactly the same thing.
SPX now @ 2051 . I do not see any good bounce until price reach 2030-2035
Ending diagonals are usually fairly precise (when they don’t do a throw-over), although this isn’t the dramatic turn that I’m used to …
We’re playing follow the leader. You can pull up usd/jpy and get a good idea of what we’re doing.
Peter
I do not need to watch the usd/jpy… I just trade what I see on SPX :-))
We are now 2045 …. 10-15 points more and we should be there !
Regards
AZ
My point is they’re moving together as one.
We may get there. Trendlines point to that area, if this is a leading diagonal. I see a bit more downside before this pattern is complete.
What a market! Now all three main indices look like leading diagonals … much bigger versions that we had before. Textbook. I’ll try to post an addition tonight, but if leading diagonals are real, and this is one, we would have a large second wave from here that didn’t go to the top.
https://worldcyclesinstitute.com/leading-diagonal-2/
I quickly placed today’s DOW chart on the page.
Can you feel it the thousand point drops are coming no retracements no mercy straight down….
https://www.youtube.com/watch?v=tirBu1pa0EU
the midpoint on the cash Dow between 17657 ( .382 of Aug low to Nov high ) and 16960 ( .50 of the Sept 28 low to Nov high ) is 17308 and change . 17308+16960/2=17134 <now key closing level going forward . looking like Nov17-19th low in the range of 17134-16960
Yet I would not like to see a close ( weekly ) below 17134 or it would signal further downside pressure . key indicators to check out for a sign of a tradable low , 5 and 10 day adv Dec line .
the 5 day in its lower range at a minimum .
5 day trin sum above 7 ( add up the 5 daily closes on the $trin) 10 day moving average of the daily $ trin above 1.40 .
another considerstion is the point drop on the Dow from Sept 17 high to the late Sept swing low .corrective moves tend to be similar in both time and price
Joe
Peter
Robert prechter discovered or came up with the leading diagonal pattern in late 2002 or it was 2003 . he used that to explain why the decline in the dow from its top in the year 2000 to its 2002 low was a 5 wave move ( which it wasn’t ) other than that I have never heard him mention that expanding flat leading diagonal .
leading diagonals are rare yet they tend to go back to the previous wave 2 so the retracements are fast and violent . also once complete you do target a 1.618 extension in wave 3 .
leading diagonals must have 5 wave subwaves
Joe
I think you’ll find this information in my posts and comments.
Peter–Seems like this could be a VERY dangerous period for bull and bear alike? We know from previous experience the central bankers are going to step in FULL FORCE with more QE etc if they sense stocks are headed significantly lower (Pavlov’s Dog). On the other hand it has been a long while since that other, often maligned emotion (FEAR) has presented itself in a form to lead to a capitulation episode. My take, something else is going on, something that is going to lead us to a liquidity crisis. The stock market is just a bit player in this Black Comedy, all asset classes, including Gold, will be in play to the downside……EXCEPT CASH!! Perpetual motion finance has never worked, never will, and so far the financial markets, especially bond markets, have let them get away with the stupidity. IMO, not much longer…..this is just one big ball of cotton candy waiting for a drop of water. Gary
You’re right but QE doesn’t affect the wave count. Even when we had some QE in the 2007 crash, it came at the point where there was a second wave. So we can still tell where gold, stocks, etc. are going based on the wave count. I know gold is going up short term (a corrective move) but it will head down again after than in a C wave. It should go eventually to the previous fourth wave (I’ll have specifics on that at some point. I know I’ve posted it somewhere in a blog post).
Right now is really dangerous because it looks to me that all the currencies have just turned up (and the dollar down). In fact, I think the equities have turned but I can’t prove it until we have a second wave.
And you’re right about cash. My video on deflation (on the landing page) talks about what’s important going forward.
The liquidity crisis is coming about due to the credit bubble. I’m in Calgary, Canada’s oil capital (can’t remember if you’re in Toronto), but you can feel the concern in the atmosphere. People are existing on credit cards due to all the lost jobs. It’s going to get ugly. There was an article earlier this week in the Calgary Herald about all the vacant office space and about a whole bunch more of it just coming on the market.
I’ve spent the past 8 years researching all the ramifications of cycles, the credit bubble, markets … and my biggest frustration right now is that virtually nobody (on the street) wants to hear about the problem staring them in the face. “Can’t happen, this time is different,” including the insanity around climate change.
I’m mounting a speaking business to tell the world about cycles and how this is all very predictable and I think we’re just starting to get some concern in the marketplace. Don’t think we’re to fear yet, but it won’t be very long. The problem I’ve been having is that I really don’t have the interested audience until it’s too late … sigh.
I just had a conversation in the past hour about how we think the timing is just about right. I’d like the market to prove the top, though.
We have a “lightweight” premier in Alberta (NDP – which was predictable, believe it or not) and a 43 year old inexperienced Prime Minister. Canada is in deep do-do.
I think the most dangerous part of going forward is going to be “keeping your money,” which includes increased taxes, banking failures, and a whole whack of scams, etc. Many will go back to mattresses like they did in the 30s … stay tuned … the fun is just beginning 🙂
Thanks for the reply Peter. I am Gary in Denver, CO, only my second post to the site, I love your work. I think the surprise here will be that we go from order (EW/Fibonacci) to Chaos (another form of “order”) to restore ORDER. “Things always seek their opposite” PQ Wall. As you already know, crashes serve a very useful purpose, the necessary wake up call to take us (painfully) to the next Spring Season. You are right, this is going to get VERY UGLY!! Gary
Gary,
Ah .. Denver. Great city, although I haven’t skied there yet!
Part of my therapy is finding like-minded people because the world has gone crazy!! It gets a little lonely knowing all this stuff, surrounded by the herd and “party-time.” So thanks for the kind words and it’s great to have people like you in-the-know, hanging close by.
Peet,
For what it is worth… You are sooooooo righttttttt! Time will show, I believe in you and see the same shit coming myself.
And yes it sucks that almost nobody wants to listen. I guess most peeps just want to loose their money or???
Cheers,
Wouter
Wouter,
Worth a lot! 🙂
Peter,
so you take off the table your alternative scenario of the large fourth wave before the large fifth to the new high ?
No, I simply start with what can get disproven first. If we start up in five waves or go higher than 62% in a motive fashion, then the leading diagonal is off the table. That would leave the other scenarios.
Dmitri,
I thought we would the 2017 previous fourth low in SPX (and we still may), but the key indices have double bottoms, so we may be done.
The fifth wave at 1.618 X wave 1 puts us exactly at the previous high of 2116.48 from where we are now, so this has to now be my preference. It’s amazing how orderly the markets are and how accurate the fib ratios turn out to be.
The C wave down came down looking like 5 waves, and even though the leading diagonal looks OK in SPX, it doesn’t in the Nasdaq. Plus I’ve never seen one before (and many others haven’t so I remain somewhat skeptical. We’ll see what happens next. The fourth wave scenario is the most likely.
We’ll look for a 62% retrace first but I think the more likely scenario is a double top at 2116.48.
Peter – Please excuse my naivety in EW, but I am trying to learn. Admittedly, such a dangerous market is not the place to be learning, but things, and lessons, happen quickly.
question on the power of fourth waves. Assuming the expanding diagonal scenario, and assuming we are in the fifth wave down with in that diagonal, then a counter wave up – a three wave (wave 2) would commence when the diagonal is complete. Does the top of the fourth within the diagonal (es 2087) still serve as a completion of wave 2 up, or perhaps the first wave of wave two up? Do previous fourth waves also work as stops in diagonals? The power of the previous fourth (es 2050) did not stop the descent of the potential diagonal, nor potential fourth down of a correction (incomplete fifth up). Apparently, the power of fourth waves is not reliable?
Thx for tolerating my basic questions, within a community of individuals who have much more understanding than I have.
amb,
I applaud your desire to learn, although I won’t have all the answers to your questions.
I’ve never seen a leading diagonal before and there’s a lot of skepticism out there in the EW community that they actually exist, so I’m going out on a limb even suggesting it, but what I’m seeing on the screen fits the suggested pattern.
Leading (or ending) diagonals don’t have conventional fourth waves within them.
The target for the second wave is something like 2082 (once we have a bottom established). A second wave will retrace 62% of the length from the bottom to the top. Apparently second waves after a leading diagonal can exist that level somewhat, but they don’t reach a new top.
The PPI was deflationary again today. Per Dick Stoken’s book, Strategic Investment Timing, we are already in a deflationary spiral. That is BEARISH. It is a rare event like 1929 and 1937. So if the FED raises rates, it would mean they would be doing the exact wrong thing as the economy is imploding. Then they would be slow to change directions for face saving reasons. Seems to fit in with technical bearish prognosis.
The question now becomes how far do we go up? 62% on SPX is 2082 approx. On ES, 2076.
https://www.youtube.com/watch?v=wr3JO0MhFTY
Trying a long position here with XIV 25.98 will exit if prior support gives way. Good luck to all.
SPX hit my target of 2022 (previous 4th wave) so we should turn around here. “should”
Sorry, my target is actually 2017. We’re not quite there yet in SPX but very close.
bought at the es 2017 level. Good luck to all.
See my note to Dmitri after doing some measurements and looking at the indices. Currencies also hit key retrace levels at the end of the day.
this market is now becoming short term to medium term oversold , next week should be a bottom of sorts ,still favor the 17134-16960 range and Nov 17-19th time frame , I’m now back to taking a bullish view yet no trade being taken on the close at this close .
18137 now needs to be tested into possibly Dec 11-12th
some food for thought…..with forks…. (excuse the pun – food – fork…;-)
i hope the chart links work – haven’t tried this before on this Board
long term es Fork
http://930e888ea91284a71b0e-62c980cafddf9881bf167fdfb702406c.r96.cf1.rackcdn.com/data/tvc_71230ef3c8019d532f013c84a5db3de8.png
short term es
http://930e888ea91284a71b0e-62c980cafddf9881bf167fdfb702406c.r96.cf1.rackcdn.com/data/tvc_e57f4d52318ce9c13b88fec5906e369c.png
the gails of November came early ( on the west coast that is )
but makes me wonder , last trip south then I’m home until year end
“The Wreck of the Edmund Fitzgerald” – Gordon Lig…: http://youtu.be/9vST6hVRj2A
André!
How is the extra gann timing research going? Wondering what you see next.
😉
Cheers,
W
I mailed 2 tables to Peter and I hope he puts them up on the site. I need those tables to explain what I see. So this evening I’ll be able to shed some light.
You are a ‘topper’ (Dutch for something like ‘the best’)! 🙂
Cheers,
W
Before I can explain my tabels I can start with explaining Bayer’s rule 32. This is important as we use it as confirmation. The rule is called : “Mercury imitates the sun”, and it works very simple.
Let’s take the 5/20 high. The solar geocentric longitude was 58,6 on that day. Now we add 126,5 degrees to get 185,1. Mercury touched that point 9/1 for the first time. This should have produced a high (imitation of 5/20 high). But as other cycles were still up (comes with my Gann analysis) the market didn’t dive. 10/3 Mercury touched the point again during it’s retrograde move. Shortly after Mercury turned direct and the 185.1 was touched for the third time 10/17. So one could say that a high could be expected between 10/3 and 10/17 and that coincides nicely with Peter’s cycle high 10/13. But again, other cycle were still up.
6/22 was another high, just 4 points shy of the may high. Using the same technique we see Mercury touching 216 degrees 11/6. And this finally produced a significant high (11/3). 6/22 was a Monday so the real turn may have been in the weekend. This shows this technique can be sharp.
After the 6/22 high we had the 7/20 high and the 8/24 low. 7/20 gives 11/23 and 8/24 gives 12/15.
Bayer said that the rule should be applied only on extreme highs and lows. And I dare say the 8/24 low was more significant than the 7/20 top. This makes 12/15 reliable as a date for a low. The 11/23 will work but now just as change in trend.
In my main angle (Gann) you will be able to see 2 major dates : 11/4 and 12/14.
The magic is how these two very different techniques produce almost the same dates. And what the Bayer rule adds is a strong indication of a high or a low.
The 7/7 low gives 11/15. So now we have 11/4, 11/15, 11/23 and 12/14. For now we can be certain 11/4 was the high and 12/14 will be the low.
What happens in between I will address in my Gann analysis.
Cheers,
André
Thanks, André,
The dates of 11/23 and 12/14 are coming up again and again.
I should be able to tell you exactly the path we’re going to take in between, based upon what happened Friday. Friday brought a lot of clarity to the path ahead. I’m just starting to put together a post on that. It will be live later today.
I might add that BR#32 on the 7/27 low gives 11/28; a date that fits nicely between 11/23 and 12/14. Looking forward to your post but my gutfeeling now is that 11/23 is major and should thus create a low. Let’s see what your analysis brings 😉
We have to head back up to finish wave 5 – should tag the previous high, which I suspect will be the 23rd, and then down. The measurements now are exact and quite extraordinary.
New post: https://worldcyclesinstitute.com/all-one-market-the-rebound/
FILAMENT GO BOOM! A large plasma filament has violently erupted on the sun! Updates coming to http://SpaceWeatherNews.com
It should be an interesting week.
This website is for educational purposes relating to Elliott Wave, natural cycles, and the Quantum Revolution (Great Awakening). I welcome questions or comments about any of these subjects. Due to a heavy schedule, I may not have the time to answer questions that relate to my area of expertise.
I reserve the right to remove any comment that is deemed negative, is unhelpful, or off-topic. Such comments may be removed.
Want to comment? You need to be logged in to comment. You can register here.