
The Bigger Picture
Bob Prechter and Pete Kendall wrote an article for Barron’s in 2004, in which they forecast the eventual alignment of all markets based upon liquidity. Here’s some more background on that. This is today’s theme. I’ve been watching the equities and currencies move closer and closer into alignment over the past year or so, to the point that today, you can see them move together intraday. Quite spectacular.
What does this mean to traders? It means you can confirm your trade across multiple assets. Or, quite simply pick anything you want, since they’re all moving in tandem. Just make sure you know what’s aligned and what’s moving contra.
Keeping this in mind, let’s look at the short term forecast.
Bottom line: My prognosis hasn’t changed, but the recent wave down has become clear, and is at an end (or extremely close to one). The wave down since Nov. 4 is wave 4 of the C wave. We now have to rise back up to test the previous high at SP 2116.48. The drop took approximately 7 market days. The rise should take about that long, which brings us to about the Nov. 23 cycle turn projection. The fifth wave should rise in 5 waves.
Cycles and Astro: November has lots of turn dates for equities, the dollar, and other currencies. The key dates for the month of November for equities and currencies are Nov. 4, 16, and 23. These come from the Market Timing Report, among other sources. I suspect Nov 16 (Monday) will be the wave 4 low, while Nov. 23 may be the top of wave 5 (top of wave C, wave 2). Looking head, the important December 14 date could be the low of wave 3 down, which would lead to a end of year rally before the final low in January, 2016.
Short Term Charts
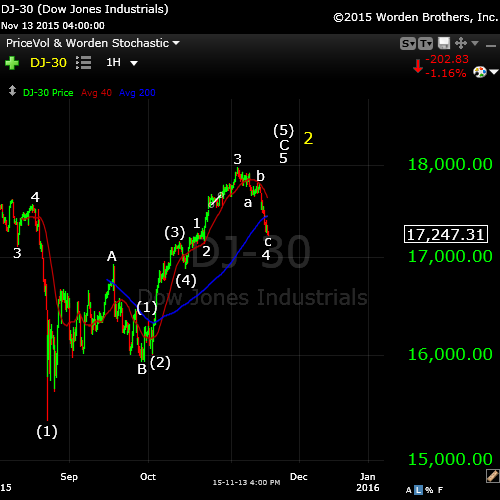
A look at the DOW shows that we’re at (or almost at) the bottom of wave 4. What has been disconcerting about this wave is its odd structure. The first half came down in overlapping waves and the second half in a “motive fashion.” However, it is not a motive wave, and can now be one of two things: either a 4th wave (the preference), or a leading diagonal (much less likely).
The fourth wave will see us heading back up to the high at 2116.48 before turning down in a very large third wave. The leading diagonal would retrace only 62% (I put this as a low probability event, although I’ll be on the lookout for it and will alert you on this blog).
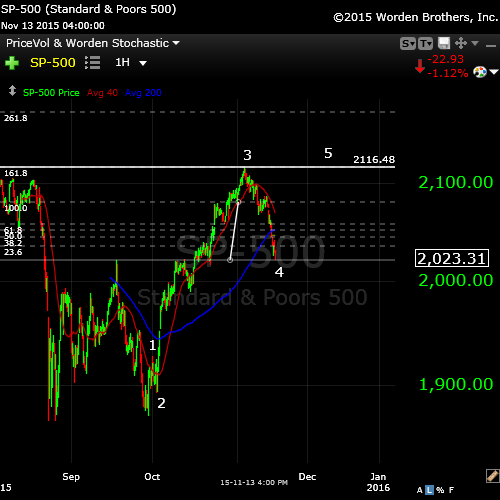
Here’s a one hour chart of the SP500 showing the 4th wave down. The larger pattern from August 24 is a regular flat (an ABC wave configuration, 3-3-5). This means the first two waves will be in waves of 3 and the final C wave will be a wave in 5 waves. Above is the C wave.
The giveaway to the next move for me is the fact that wave 4 has done a very deep retracement. In fact, it has now retraced down to the point that it is EXACTLY 1.618 X the length of the first wave from the top. The fifth wave is usually 1.618 times the length of the first wave. I’ve place the fibonacci retracement tool on the chart and you can see on the left that 161.8 aligns with the top horizontal line, marking the top of the third wave.
The market is telling me we’re going to complete a 5th wave to test the previous top at 2116.48 SPX.
If you were to go and measure all the other major indices, you’ll find they have come down exactly the same percentage in relationship to their perspective first waves.
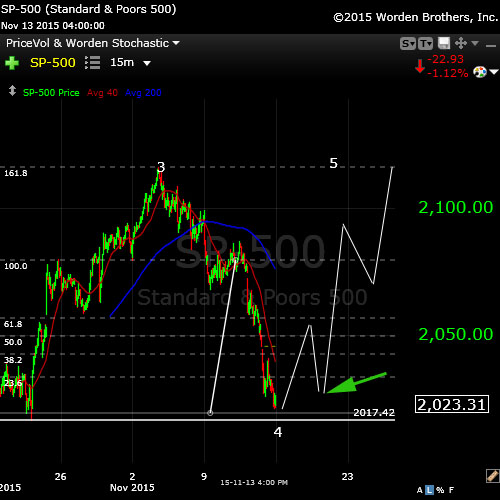
Now for a look at the coming week, with a “zoom in” to the 15 minute chart of the SP500.
You can see we’re looking at the 4th wave, which has almost come down to touch the previous 4th wave (horizontal line). We may see a little more downside on Sunday in the futures. However, I would expect us to start the 5th wave up on Monday.
The fifth wave up should rise in 5 waves to the previous high (exactly 1.618 X the length of the larger first wave of the larger C wave (shown in a previous chart above).
The best place to enter is at the bottom of the second wave (the green arrow on the chart), which usually retraces 62% of the first wave up. In this case, the retrace may drop lower than 62% because we’re talking about a market that is overly bearish and in arguably the last wave of the larger C wave, ready for a very large drop. So use caution.
After the retrace to the top, the market should turn down.
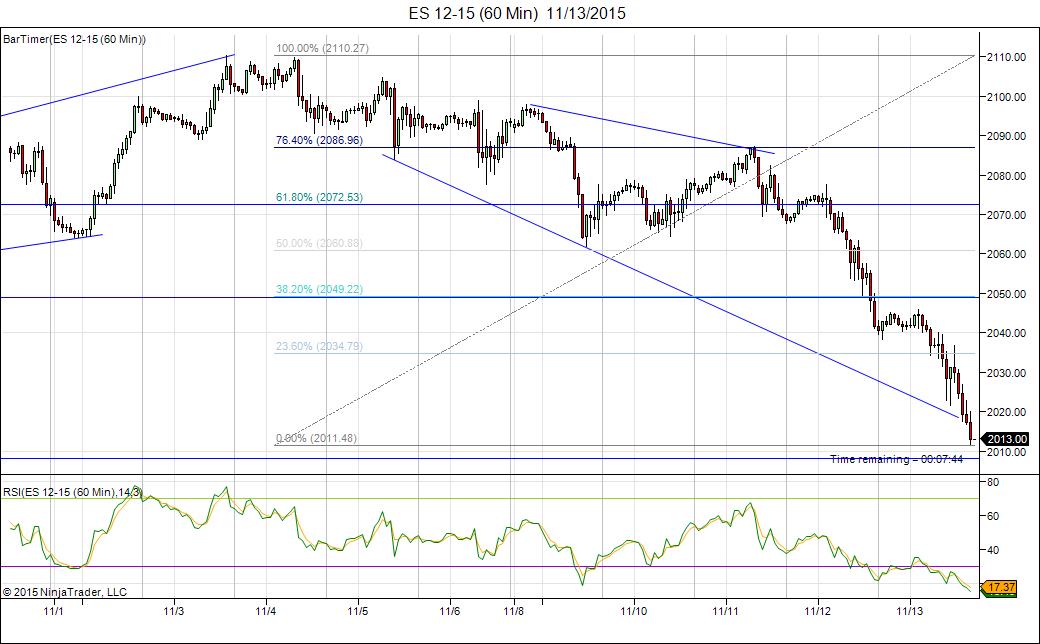
Here is a one hour chart of ES (SPX futures) as at the close on Friday, Nov. 13.
Many of you know I’ve been flirting with the leading diagonal idea which came from the configuration of the futures market. This chart show that the futures market is still sporting that pattern. However, I’m not sold on the idea that a leading diagonal actually exists, and so I’m suggesting the e-mini futures will also retrace to the top before turning over.
____________________________
Currencies and the Dollar: All One Market
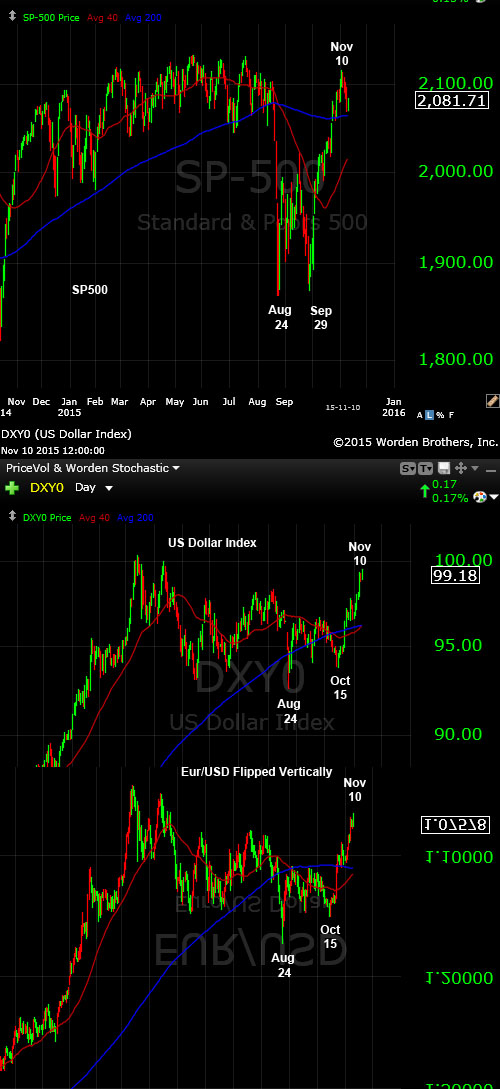
Above is a daily chart of the SP500 (top) and then a daily chart of the US Dollar (middle) and finally, a daily chart of the euro/dollar (bottom), which is flipped vertically to show how it inversely lines up with the other two indices. I have been watching these three indices for months now.
What appears to be happening now is that the dollar is short-term topping and this should cause the US equities to turn down. I think this is why we’re seeing the equities about to turn now.
It’s no secret, if you’re an Elliott wave counter like I am, that the euro and other dollar pairs are about to turn. Their waves are virtually complete. I’m also seeing the imminent turn of all the dollar pairs. In fact, we appear to be in the last wave down this week.
Keeping this in mind, it seems to me that the US equities market may top as the currencies bottom (or top, in the case of the dollar).
Relative movement to equities (the US stock market):
- USD, USD/JPY: in parallel
- USD currency pairs (EUR, CAD, AUD, GBP): contra
USD/JPY appears to have one more leg up to end the larger wave, which the other US dollar currency pairs have one more leg down.
_________________________
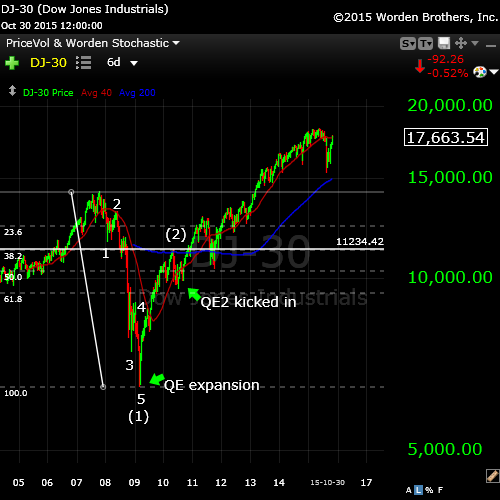
History: The 1929 crash
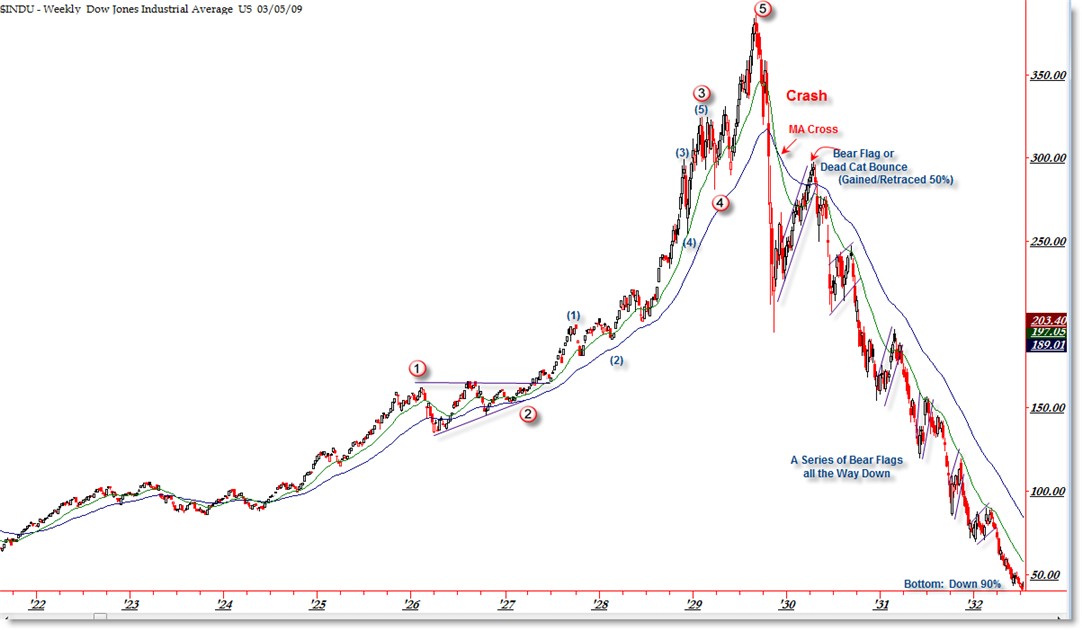
I think it’s important to look at 1929 and the wave structure (above and below), which was the same as 2007—to a point. I will show the 2007 crash below in the “What If” section.
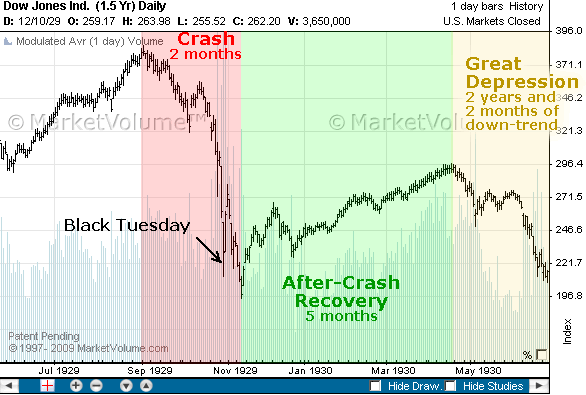
The wave structure of the 1929 crash was in 3 waves overall. There were 5 waves down from the top (the A wave) and then a very large B wave retrace. The final C wave down was a stair-step affair and lasted over 2 years.
Let’s look a little close at the timing of the 1929 crash because the similarities to today are uncanny.
The market peaked on September 3, 1929 and then it took 2 months for the crash to actually happen (to reach the bottom of wave 5 of the A wave). The larger crash which we always hear about began on October 23, 1929. Then there was that large B wave, which lasted 5 and a half months and finally (which I explain a little further in the cycles section below), the C wave which went on for more than 2 years. This might be the scenario we’re looking at going forward.
Keep that December 14 date in mind for the bottom of the A wave.
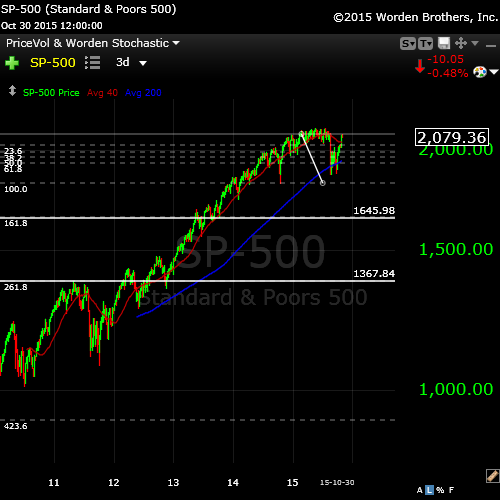
Finally, let’s take a look at a big picture of the SP500 and project the bottom of the third wave down. I’ve drawn a couple of horizontal lines on the SP500 chart to suggest ending prices for the bottom of the A wave.
If the full wave drops 1.618 X the length of the first wave, the bottom would be at 1645.98. *
If the A wave extends to 2.618 X the first wave (historically more likely), the bottom would come in at about 1367.84.
- * These numbers are based on the current top of 2116.48 in the SPX (and same date tops in the other cash indices).
______________________________
“What if”—Without the FED
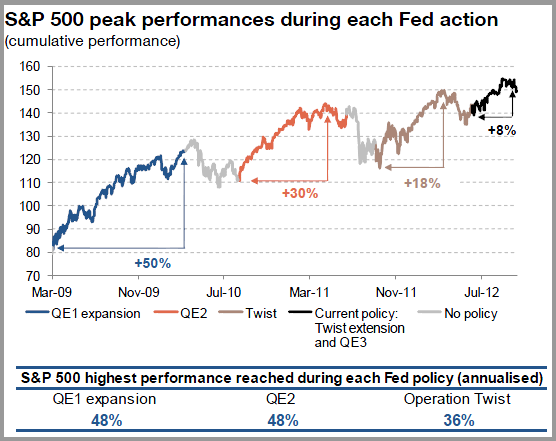
Above is the 2007 chart of the DOW. I’ve marked the motive wave down so that you can see the configuration compared to what should happen today and to what happened in 1929. Note that wave (1) came down in 5 waves and then we retraced to the 62% level. We Elliott-wavers thought we would turn down at that point, but qualitative easing had its effect on the market and up we went.
It’s interesting to note the correlation between the QE segments and the movements of the market.
Below is a chart of the various segments of quantitive easing undertaken by the FED, with their dates, so you can see how they applied to the DOW chart above.
____________________________________
Cycles Analysis (updated November 15, 2015)
This is my cycles analysis from today (Nov 15, 2015). You can click on it to expand.
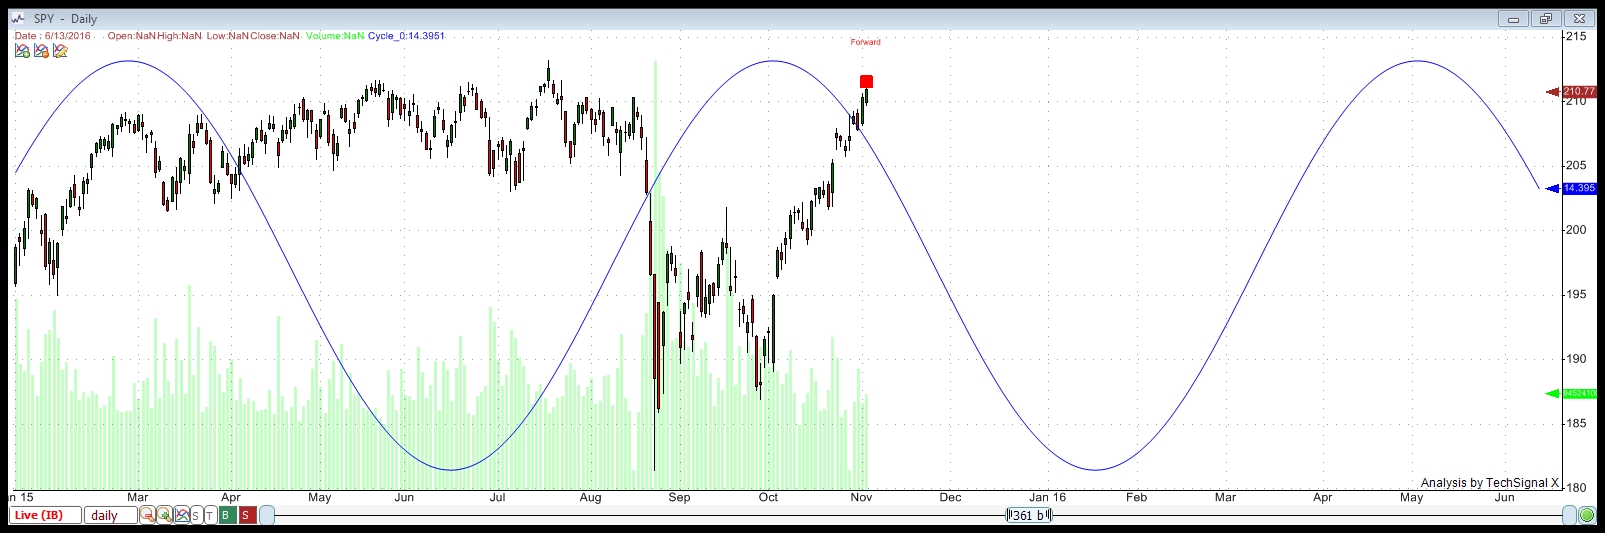
Above is the long wave in SPY. In the analysis tonight, this wave returns the highest percentage of trade wins of the 25 cycles the program finds, trading both the bottoms and tops of the cycles over a period of 12 years. I show this to give an idea of the larger cycle running through SPY (and the SP500) and where we are tonight in relation to it.
This chart uses a compiled display of all the cycles the program finds.
This cycles analysis uses Techsignal X from the Foundation for the Study of Cycles. I’m using data going back to 2002 this analysis of SPY (SPX) and displaying a compilation of all the cycles the software has found over that period.
This analysis suggests a cycle top of October 19, so we are overdue for a turn down.
It shows a bottom to this set of waves down at December 9, 2015. There are Gann and astro projections for a December 14, 2015 bottom from different, very credible sources. I would suggest that these dates are the dates to watch.
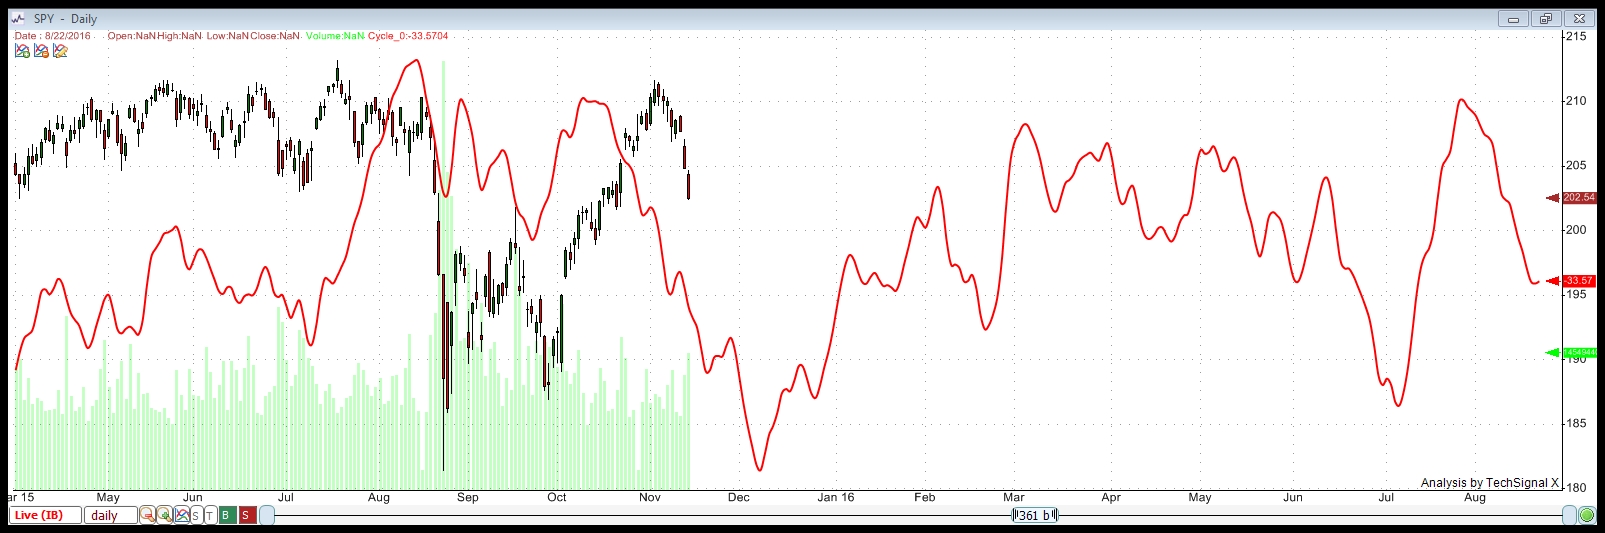
Looking Ahead Even Further
You can see on the above chart that we bounce after the December expected bottom. The cycles analysis shows a bounce that lasts through mid June of 2016. This would be consistent with 1929. The fourth wave bounce in 1929/30 lasted 22 weeks, which is about 5.5 months. From December 12 to June 12 is, of course, 6 months. This suggests a similar scenario to the 1929 drop.
I’ve gone a little deeper into what the analysis is telling me on a separate page. Here’s a more in-depth explanation of what this chart is suggesting.


Wow!!
A stock market or a market of stocks… ?
I appreciate your efforts Peter.
I think we are on a fast track to a retest of the August lows and maybe much lower. Look back at 911 and what the world markets did. This Paris attack may only be the beginning.
I realize you don’t focus on fundamentals. But, how did EW fair on 911 when the market was closed for a week and crashed?
My previous analysis on Bitcoin and silver is on track. This week should be the beginning of the launch…
I doubt the SnP will retest last weeks high for a while… (2016 when the Phase Transition hits)
what a wild ass ride we are in for..
On 911, the market was already in a downtrend (corrective wave) from Jan, 2000 which lasted into late 2002, so 911 didn’t make much of a mark. Events never do. That wave eventually came down to the previous fourth.
The 911 attack happened on the largest spike in second half of the solar maximum and that we always get a recession/market drop right after a solar maximum https://worldcyclesinstitute.com/solar-cycles-how-the-markets-turn/. It’s been that way for over 200 years.
Social mood determines events and the market. 🙂 Those good ole’ electromagnetic waves.
And if I remember correctly, SPX rallied during the majority of the anthrax scares that followed the attacks. Note this LA times article from 2001. http://articles.latimes.com/2001/oct/13/business/fi-56812. This is why the wave principal is so valuable as the stock market has reacted bearish or bullishly to similar scenarios.
Ted,
Thanks for this example! It’s a good one, because on that day or a day or two later, the DOW rallied about 1500 points. I might use this example in future.
Joe Granville always pointed to the market rallied from the taking of the Iran hostages to the day they were released. The market bottomed the day Iraq 1 started. In his 1970’s book on cycles, Hurst said major international events have little of no effect on the market.
Garry,
I agree I think we will go for a retest and lower the bradley showed the rise in Oktober and beginning of November and it shows a drop till full moon Nov 25 after that a little recovery and down again till beginning of new year.
we will see.
Cheers and good luck everyone.
My “VUKCEVIC’s SOLAR ACTIVITY FORMULA” uses the 6/22/2000 heliocentric Jupiter-Saturn conjunction instead of he ‘1941’ in the original formula.
Vukcevic said that extreme values in the formula – near zero or 200 – were the most significant.
11/14 the formula reads 1,57- very low. And 11/12 199,69 – very high.
Yet another totally different indicator confirms the data we already had. The next significant reading will be 2/8/16 at 0.09 and 4/8/16 at 199,95. Then 6/9/16 at 0.78.
It could be wise to mark these dates in your schedule as it is totally different from all other tools we use. If we bounce into june 2016, 6/9 is a likely target.
Cheers,
André
Using this formula in a weekly setup – instead of daily- we can see the first week of april 2015 gave an extreme high. The nest extreme low we find 1/22/18 and another one 6/11/18. This suggests a long term target for a low should be between the last two dates.
hi Peter
very good update today .
back in 2001 Elliott wave was very useful and so was
basic Fibonacci time count going into the Sept 2001 low .
also I’ll note the seasonal bullish bias of Nov 7 to Jan 16 did not work that year since the market had already bounced from the Sept lows . something I have noticed in the past yet have not had the time to check is the first qtr and last qtr moons as turning points . I’ve notice it many times just not sure if it’s been consistent of late , Nov 17-19 would fit for a low is that hold true .
a bounce now then a drop into Nov 17-19 ? could create 5 waves down . yet that’s speculative since I don’t have enough data .
finally got out to sea and heading south ,can’t wait to be home and dig deeper into this market .
thanks for the updates Peter . it’s appreciated more than words can say
Joe
The wave up from 1997 ES looks corrective in 3.
The current wave down looks motive in 5
Correct. Not sure about the wave down, but for the larger wave, I would expect a double bottom, which would reinforce that fact that it’s corrective. The last wave in that case, would likely be in 5 waves.
Also, I notice the relationship of the currencies to equities seems to be changing. So maybe currencies have already bottomed. I would be cautious here. USD/JPY took off to the 62% retrace level, while all the other currencies have done corrective waves. Didn’t expect that.
All the cash indices seem to be hitting the target at the moment, so the rise should be imminent, I think.
Could be the second wave of the third retrace to 2020ES, but that first wave up still bothers me.
Dmitri,
Now I could consider the futures 5 waves up, but they didn’t go to a previous 4th of any kind (which typically means a retrace is coming), and I still see lots of 3’s within the pattern, so maybe we haven’t properly bottomed. That last wave up was in 3 in NQ and YM certainly … so we wait to see what the market has in mind.
Dmitri,
I’m expecting a correction right about here, perhaps the second wave of the third. Down to about 2029ES
Not today
There used to be a time when 1.618 mattered and so did previous 4th waves, and indicators …
The day like this the algos drive into the close
May be tomorrow intra day
I think probably at the close. Unfortunately, I got out, so will have to wait.
We’re likely going to 2056 ES before a correction now.
The market is not driven by natural forces any more.
The algos have no sentiments.
The French CAC has taken 250 points from todays low – 5% in less then 24 hours
I don’t believe that, because they still conform to EW ratios.
I missed the entry last night due to a meeting. Same thing this morning (right after I posted it – hope you got in there). This third wave should go to 1.618X the first before it corrects, or it will go to 2.618. I thought it would correct at a ratio corresponding to the smaller first wave. I am watching from afar at the moment … 🙂
Aha, in my haste between other distractions, I was measuring the wrong first start and end points. The weird first wave this morning threw me off. ES should go to 2064 ES (and maybe higher) before a correction. We’re heading up in motive waves, which reinforces the current count.
Peter,
what is your count now ?
What wave are you expecting to finish at 2064ES ?
Hmmm. I haven’t been paying attention. I think we’ve seen the first wave of wave 3 and I would expect a fairly big retrace here, I think …. perhaps 2 of 3. I haven’t measured anything so that’s just eye-balling it.
ES didn’t actually make 2064. It looks like it’s done a little fourth and fifth wave, and it looks complete, so that’s why I’m thinking a rollover here into a corrective wave. Tomorrow into the middle of wave three. We’re only at about the 50% retrace mark.
I would also watch tomorrow for an early final rollover, but I don’t think we’ll get it until the top.
Dmitri,
Caution tomorrow. We are likely to roll over right here. We’ve come up in 3 waves to 38% and it looks good for a rollover, which would mean this is indeed a leading diagonal we’ve been in.
Peter–I asked Prechter this morning if he still agrees with the All One Market idea? He said yes, BUT, “we did not think stocks would hold up as commodities fell in Wave C, so either we are wrong or there is going to be one hell of a catch up.” I believe it’s the latter. Also I believe this comment from John Hampson of Solarcycles may be important……”Then we have a series of anomalies occurring in the financial markets which may collectively spell liquidity troubles. Corporate bond inventories have gone negative, repo rates are fractured, swap spreads have gone negative. These are fairly unprecedented so no-one seems to quite know what they mean, but given the distortions that have built up under ZIRP and QE we shouldn’t be surprised if another systemic crisis was to start to take hold in some area.
Lastly, gold still looks like it may need a final washout low, due to open positioning and put call ratios. My guess is we see the US dollar break out and take off again here, as a bearish development for the overall markets, and gold gets its final sell off in response, before breaking into its new cyclical bull, as equities move decisively into full bear market.” Gary
Interesting. I actually sent Bob my all the same market chart, but haven’t heard back.
This morning’s market is a little hard to figure out short term, although I’m pretty sure where equities are going. It’s currencies that are troubling.
Thanks for this. 🙂
Gary, when you put in a different name, the software thinks you’re a new person. I then have to manually approve it. That’s why it didn’t show up the first time.
Thanks Peter…will just use Gary
I am Gary G. in DC.
I’ll end my posts Gary G.
Haha … we’ve created a monster! No actually, it’s a “personal best” kinda thing. Whatever you first signed up with is what it remembers. So there can be two Garys but once you establish your “handle,” you need to stay with it. Worst case is you have to wait until I manually approve it … which doesn’t take long if I’m here ..
Wordpress isn’t particularly smart in that regard 🙂
Sold 1/2 position XIV Inverse vix etf at 27.58 from 25.95 friday We have couple gaps to fill, at 2045 and the 2070, Please remember, all years ending in 5 have always been positive years. I am looking for a possible low to the 1930 level in the near future. If we do reach that level, I will be going long into year end. Good luck to all.
Over the last year, S&P 500 has failed 14 times at or near the 2120 level. That will be the level to watch. If we do cross that level and with the fact all years ending in 5 are positive, we may get a very explosive rally into end of the year. I am looking at the POSSIBILITY that the SPX coming down into the 1930 before we take off to the long side. This scenario may fit in, on how Armstrong is seeing the same thing. A sling shot move in the markets where the bears MAY get RAPED again. Good luck to all.
Waiting for UVXY to come down to the 28.00 – 30 level to go buy. Bradley model change for the Nov 18th. Waiting for the gaps to get filled as posted earlier to get back short. Good luck to all.
I agree Dave, Weds night to Thurs Nov 18-19 is also the First Quarter Moon which has strong correlation to the High of a Month. Good spot for a lower high/wave 2.
Around 2075-2080ish
Great info Whitemare, I am going to exit my other half long tomorrow morning. Enter the UVXY tomorrow perhaps, a day earlier to catch the drop in the markets later this week into next week.. All the best.
Looking a the markets tonight, I think you’re mostly right. We might just roll over here in the morning tomorrow. This would be a fourth wave. We would have a second wave later this week. We’ve retraced 38% in 3 waves so far and we’re stopped waiting.
One gap filled, 2052.52 one more to go possibly. Than back to short.
Dave and others,
I do not believe in years ending in 5 are always positive… However, if you can assure me that from the beginning of the stockmarket uptill now all years ending in 5 were positive, you might change my mind. 😉
Cheers,
W
I am willing to be wrong Whazzup. Just go back in the past, with all years ending in 5. Show me one year ending in 5 where we had a loss. I could not find one myself.
Best of luck to you.
http://fat-pitch.blogspot.ca/2015/01/the-bullish-year-5-set-up-is-missing.html
Chart of DOW going back to 1805. http://www.futuresmag.com/2015/01/05/what-happened-every-year-ending-5-reconstruction
New important post this morning. I’m flipping back to the leading diagonal and expect a turn down.
https://worldcyclesinstitute.com/all-one-market-the-reversal/
Dave
I’d say almost all years ending in 5 have been positive .
I have yet to read Peter’s link ( I’ll read it next )
all we have to do though is look back to the year 2005 .
that was a mixed year and basically flat ( yet down )
This website is for educational purposes relating to Elliott Wave, natural cycles, and the Quantum Revolution (Great Awakening). I welcome questions or comments about any of these subjects. Due to a heavy schedule, I may not have the time to answer questions that relate to my area of expertise.
I reserve the right to remove any comment that is deemed negative, is unhelpful, or off-topic. Such comments may be removed.
Want to comment? You need to be logged in to comment. You can register here.