
Update November 18 Before the Bell
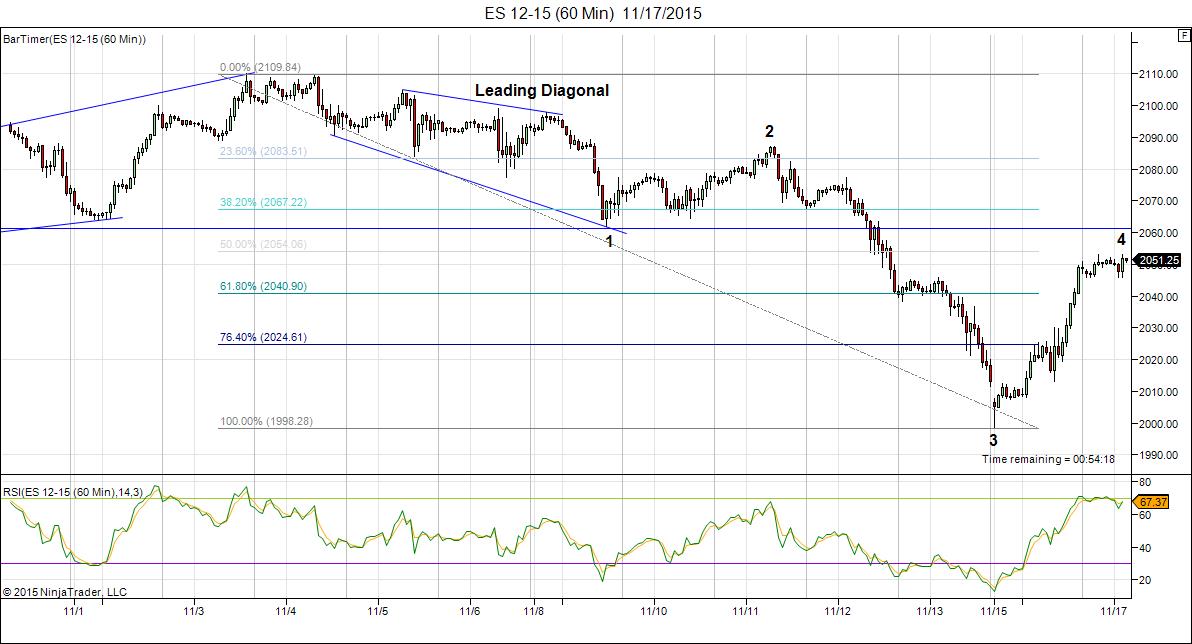
Not much has changed in my count. ES (emini futures) has broken a cardinal EW rule in that the fourth wave has wandered into the area of the first wave by about 1.5 points.
Overnight EUR/USD reversed in a big way and USD/JPY has not (not sure if it’s done yet), but the futures hardly moved until early this morning. They’re weak and may or may not be able to make it above the previous 4th wave level from yesterday. We still could see a reversal here.
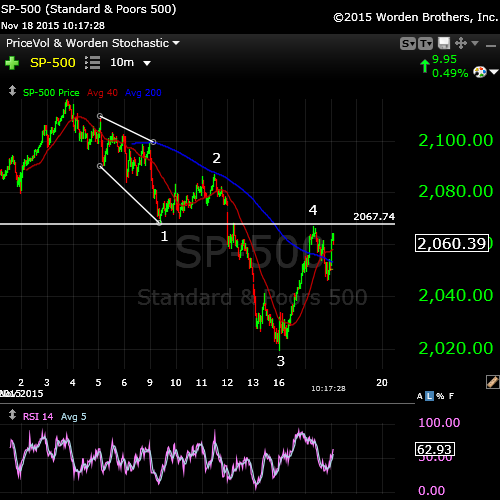
This morning’s chart showing an imminent possible turnover that top of wave 4. It’s either that or they somehow find the strength to keep moving up. We’ll see what happens.
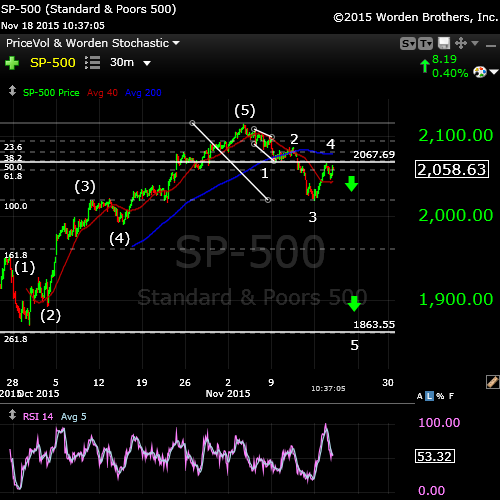
Above is a 3o minute chart of the SP500 showing the potential drop setting up. This would take us to the bottom of the C wave. We would see a very large second wave rally after that, which should take us back up to the 2020 area before a larger drop in wave 3.
Just for Fun
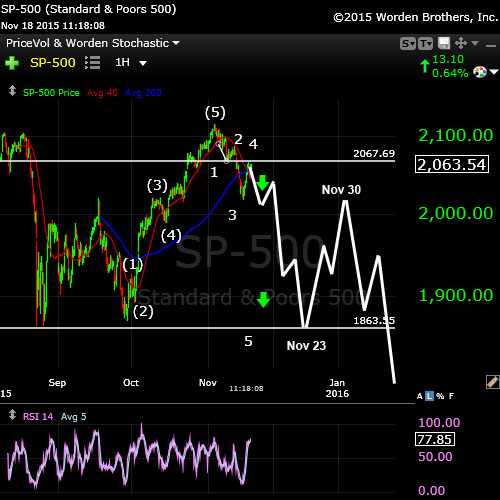
Above is a one hour chart of the SP500 in which I’ve drawn in the possible path and times, based on key dates we have as possible turn dates (not sure about Nov. 30. I also have a Nov. 28 turn date). Of course, at this point, the dates are pure speculation. In terms of the path, if we head down in a 5th wave of the first today, this is a probable outcome.
________________________
An Important Update from Yesterday’s Post!
There were important changes in last night’s market that caused me to rethink yesterday’s forecast of testing the previous high. I have now reverted to the alternative—the leading diagonal. I can’t remember ever going back and forth so much, but the problem is, the leading diagonal pattern is so rare that most Elliott Wavers have never seen one!
The futures last night traced out a full 5 waves up in a 3 wave pattern (a small degree fourth wave) and so this suggests futures and the cash indices will turn down in a fifth wave to complete a first wave down.
As at the time of this writing, futures are still moving up. ES cannot go above 2061.75 or it will travel into the area of the first wave and make this forecast dicey. In the cash indices, we have not quite reached the 38% retrace, so they should reach this level on the open. It’s a bit of a balancing act between futures and cash.
The other important event was the reversal of USD/JPY (diagram below). It also formed a leading diagonal pattern, in fact, even more in tune with the textbook diagram. The JPY currency pairs reversed as well as the USD currency pairs.
There were other warning signs—the Nasdaq didn’t trace out a motive wave up on Monday. The futures also had questionable first waves up (in 3 waves). The clues just mounted up until tonight, the currency reversals sealed the deal.
Bottom line: The alternative has flipped up to the top again. I’m back to the leading diagonal theory. The wave action overnight and Monday have cleared the way for the leading diagonal pattern being a real pattern! I have now seen one! They do apparently exist. I expect a turnover this morning in wave 5 of the first wave down. Monday produced wave 4.
Cycles and Astro: November has lots of turn dates for equities, the dollar, and other currencies. The key dates for the month of November for equities and currencies are Nov. 4, 16, and 23. These come from the Market Timing Report, among other sources. I suspect Nov 16 (Monday) will be second wave high. Looking head, the important December 14 date could be the low of wave 3 down, which would lead to a end of year rally before the final low in January, 2016.
Keeping this in mind, let’s look at the short term forecast.
Short Term Charts

A look at the SP500 shows that we’re at the top of a small degree wave 4. What has been disconcerting about this first wave down from 2116.48 is its odd structure. The first half came down in overlapping waves and the second half in a “motive fashion.” As I’ve said before, the only way this wave down could be motive is if it were a leading diagonal. We’ll zoom in for the confirmation.
The forecast now is for a turn down in the morning and a short drop in wave 5 to the previous 4th wave, at about 1986 SPX. Following that will be a turn up into a second wave, which should retrace 62% from the top (2116.48).
The larger pattern from August 24 is a regular flat (an ABC wave configuration, 3-3-5). The first two waves of this larger pattern were in waves of 3 and the final C wave (not labelled) has traced out 5 waves (shown in the chart above). Wave C is also the larger 2nd wave (labelled as a yellow 2) and will result in a very large drop. More on that to come in future posts.
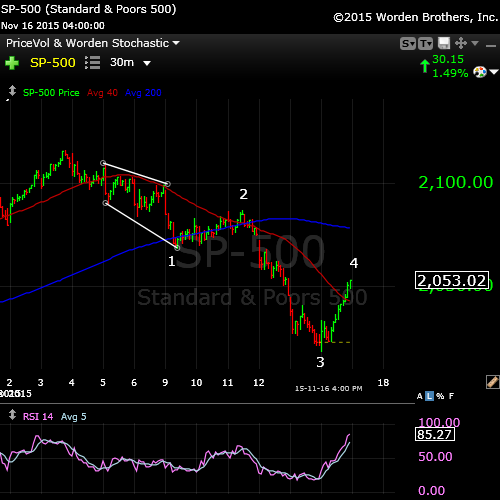
Here’s a 30 minute chart of the SP500 showing the 4th wave that formed yesterday (Monday). You can see the leading diagonal (a triangle, a 3-3-3-3-3 pattern) which completes subwave 1 of the larger pattern. Wave 3 came down as a motive wave and wave five will do the same thing (a wave in five waves).
You’ll see it a bit better in the futures chart directly below:
The Futures
Here is a one hour chart of ES (SPX futures) at approximately 4am EST this morning (Nov 17).
Many of you know I’ve been flirting with the leading diagonal idea which came from the configuration of the futures market. This chart show that the futures market has traced out a textbook version of it. Once we have the fifth wave down, I’ll get a full snap shot for my records! ES should drop about 90 points from the turnover. I put that in the neighborhood of 1967.
The Bigger Picture
Bob Prechter and Pete Kendall wrote an article for Barron’s in 2004, in which they forecast the eventual alignment of all markets based upon liquidity. Here’s some more background on that. This is today’s theme. I’ve been watching the equities and currencies move closer and closer into alignment over the past year or so, to the point that today, you can see them move together intraday. Quite spectacular.
What does this mean to traders? It means you can confirm your trade across multiple assets. Or, quite simply pick anything you want, since they’re all moving in tandem. Just make sure you know what’s aligned and what’s moving contra.
The USD/JPT Turnover
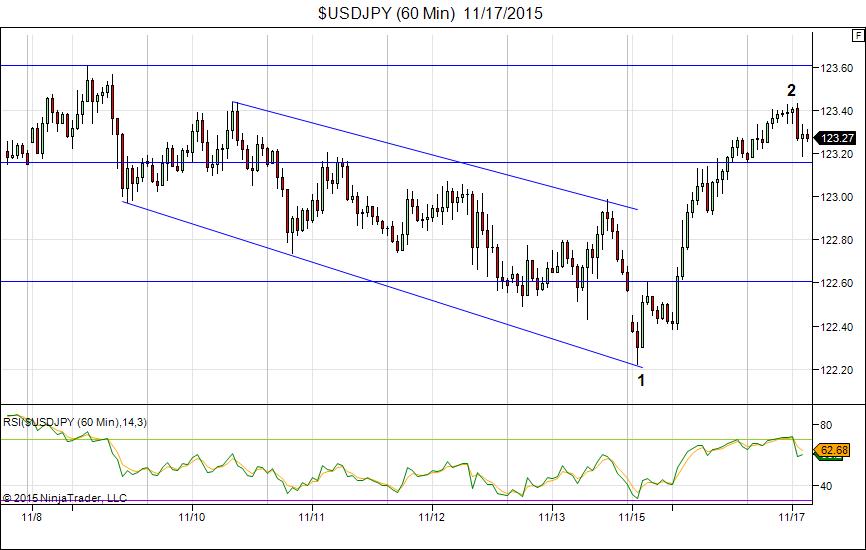
The biggest clue last night was the turnover of USD/JPY. Here’s a one hour chart showing the similar leading diagonal pattern that I’ve been watching very closely over the past few days. Yesterday and last night, a second wave formed, very much in line with expectations of a leading diagonal—a very large 2nd wave (the futures and indices did not trace out this pattern to such as extreme). I would now expect USD/JPY to turn down into a third wave.
USD pairs should continue to turn up, which JPY pairs turn down. If this doesn’t happen, we need to carefully watch out for a change to the forecast in equities. The markets appears to all be moving as one.
____________________________
Currencies and the Dollar: All One Market
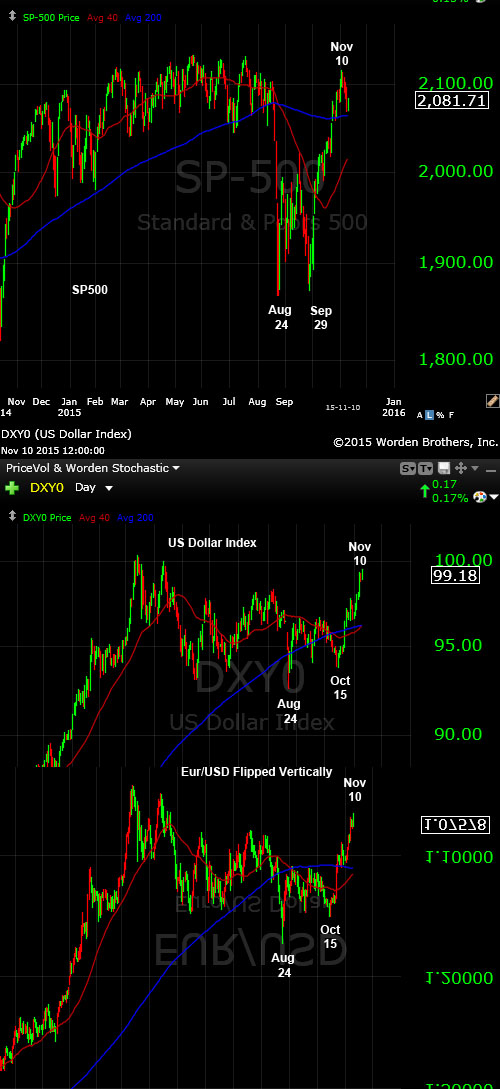
Above is a daily chart of the SP500 (top) and then a daily chart of the US Dollar (middle) and finally, a daily chart of the euro/dollar (bottom), which is flipped vertically to show how it inversely lines up with the other two indices. I have been watching these three indices for months now.
What appears to be happening now is that the dollar is short-term topping and this should cause the US equities to turn down. I think this is why we’re seeing the equities about to turn now.
It’s no secret, if you’re an Elliott wave counter like I am, that the euro and other dollar pairs are about to turn. Their waves are virtually complete. I’m also seeing the imminent turn of all the dollar pairs. In fact, we appear to be in the last wave down this week.
Keeping this in mind, it seems to me that the US equities market may top as the currencies bottom (or top, in the case of the dollar).
Relative movement to equities (the US stock market):
- USD, USD/JPY: in parallel
- USD currency pairs (EUR, CAD, AUD, GBP): contra
USD/JPY appears to have one more leg up to end the larger wave, which the other US dollar currency pairs have one more leg down.
_________________________
History: The 1929 crash
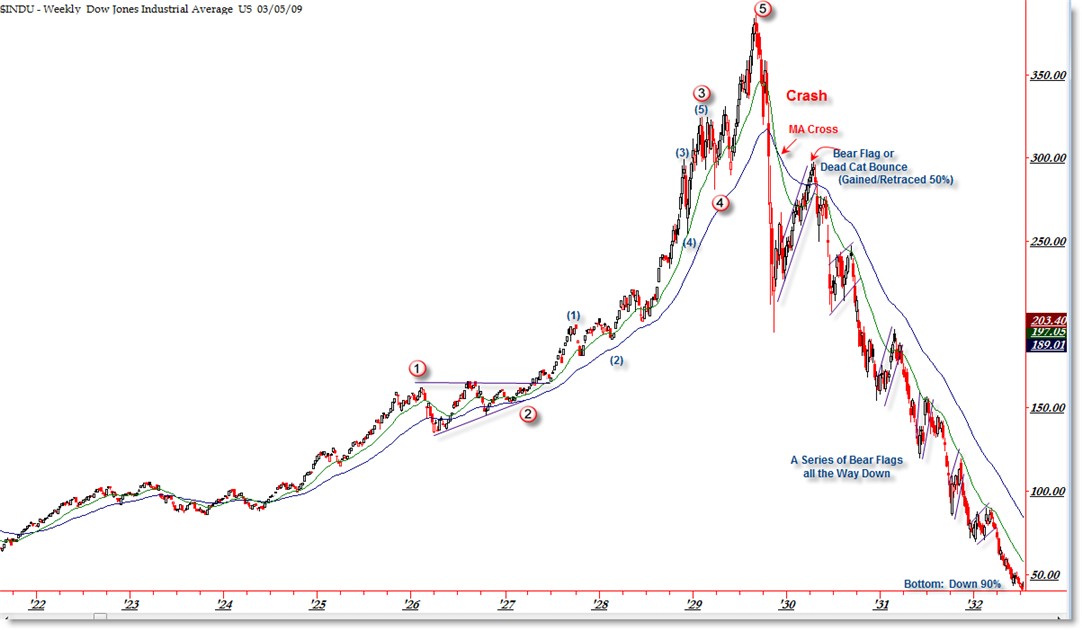
I think it’s important to look at 1929 and the wave structure (above and below), which was the same as 2007—to a point. I will show the 2007 crash below in the “What If” section.
The wave structure of the 1929 crash was in 3 waves overall. There were 5 waves down from the top (the A wave) and then a very large B wave retrace. The final C wave down was a stair-step affair and lasted over 2 years.
Let’s look a little close at the timing of the 1929 crash because the similarities to today are uncanny.
The market peaked on September 3, 1929 and then it took 2 months for the crash to actually happen (to reach the bottom of wave 5 of the A wave). The larger crash which we always hear about began on October 23, 1929. Then there was that large B wave, which lasted 5 and a half months and finally (which I explain a little further in the cycles section below), the C wave which went on for more than 2 years. This might be the scenario we’re looking at going forward.
Keep that December 14 date in mind for the bottom of the A wave.
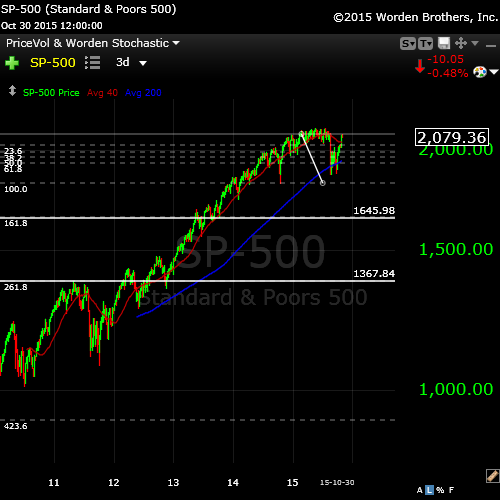
Finally, let’s take a look at a big picture of the SP500 and project the bottom of the third wave down. I’ve drawn a couple of horizontal lines on the SP500 chart to suggest ending prices for the bottom of the A wave.
If the full wave drops 1.618 X the length of the first wave, the bottom would be at 1645.98. *
If the A wave extends to 2.618 X the first wave (historically more likely), the bottom would come in at about 1367.84.
- * These numbers are based on the current top of 2116.48 in the SPX (and same date tops in the other cash indices).
______________________________
“What if”—Without the FED
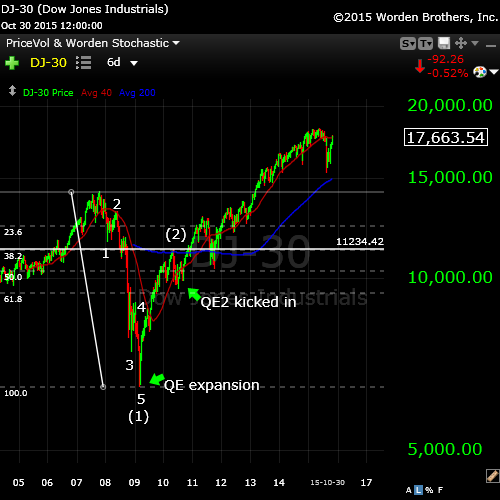
Above is the 2007 chart of the DOW. I’ve marked the motive wave down so that you can see the configuration compared to what should happen today and to what happened in 1929. Note that wave (1) came down in 5 waves and then we retraced to the 62% level. We Elliott-wavers thought we would turn down at that point, but qualitative easing had its effect on the market and up we went.
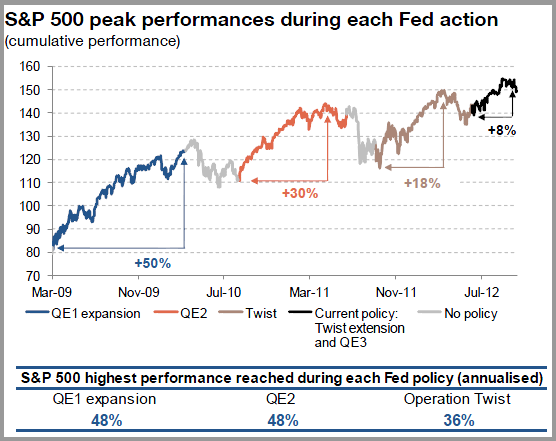
It’s interesting to note the correlation between the QE segments and the movements of the market.
Below is a chart of the various segments of quantitive easing undertaken by the FED, with their dates, so you can see how they applied to the DOW chart above.
____________________________________
Cycles Analysis (updated November 15, 2015)
This is my cycles analysis from today (Nov 15, 2015). You can click on it to expand.
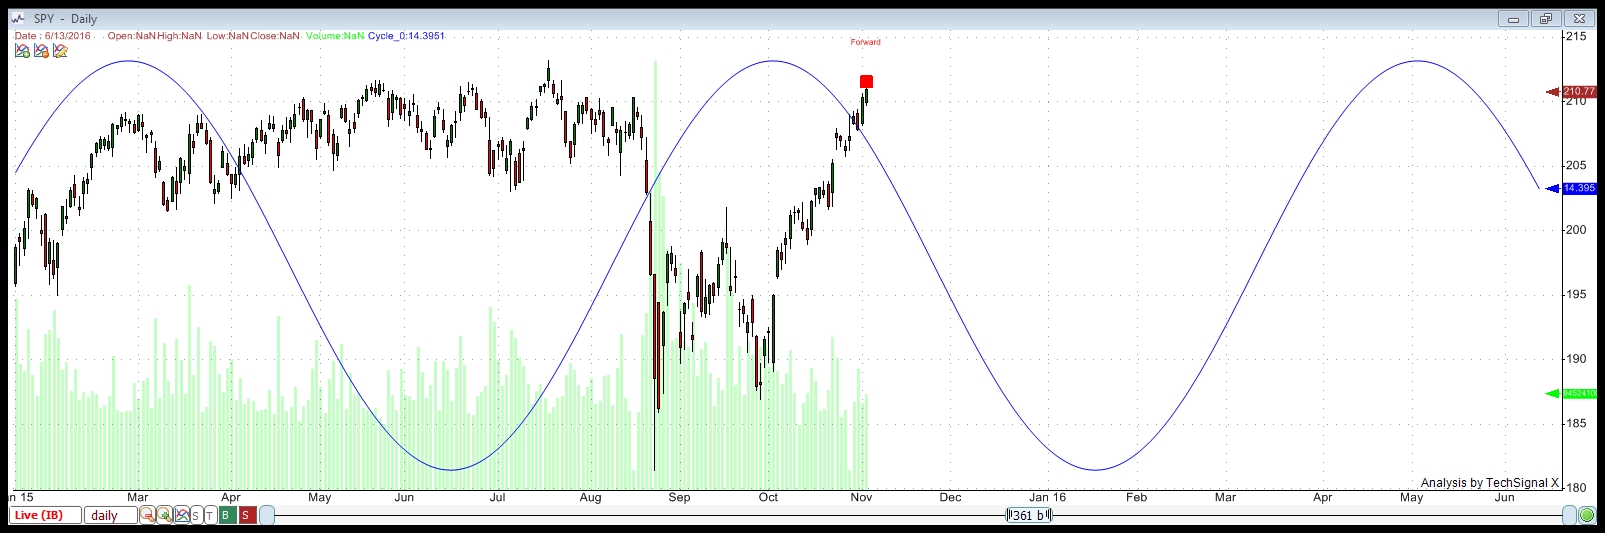
Above is the long wave in SPY. In the analysis tonight, this wave returns the highest percentage of trade wins of the 25 cycles the program finds, trading both the bottoms and tops of the cycles over a period of 12 years. I show this to give an idea of the larger cycle running through SPY (and the SP500) and where we are tonight in relation to it.
This chart uses a compiled display of all the cycles the program finds.
This cycles analysis uses Techsignal X from the Foundation for the Study of Cycles. I’m using data going back to 2002 this analysis of SPY (SPX) and displaying a compilation of all the cycles the software has found over that period.
This analysis suggests a cycle top of October 19, so we are overdue for a turn down.
It shows a bottom to this set of waves down at December 9, 2015. There are Gann and astro projections for a December 14, 2015 bottom from different, very credible sources. I would suggest that these dates are the dates to watch.
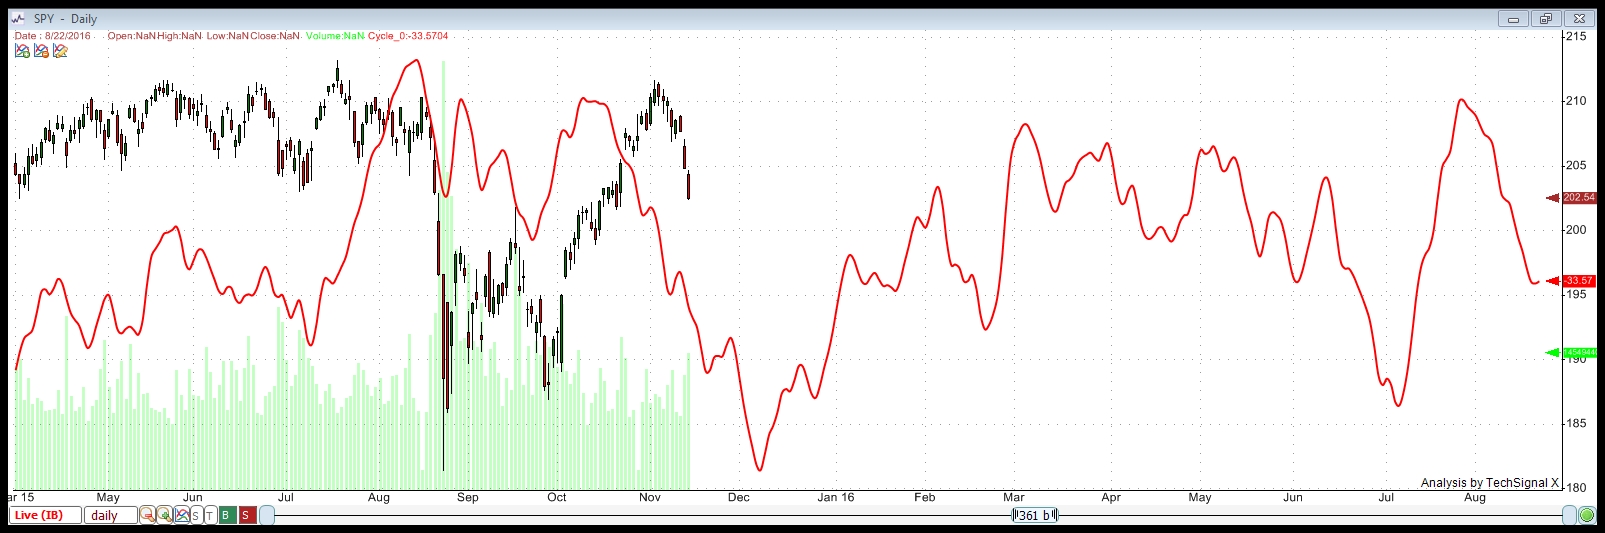
Looking Ahead Even Further
You can see on the above chart that we bounce after the December expected bottom. The cycles analysis shows a bounce that lasts through mid June of 2016. This would be consistent with 1929. The fourth wave bounce in 1929/30 lasted 22 weeks, which is about 5.5 months. From December 12 to June 12 is, of course, 6 months. This suggests a similar scenario to the 1929 drop.
I’ve gone a little deeper into what the analysis is telling me on a separate page. Here’s a more in-depth explanation of what this chart is suggesting.


Good morning Peter!
Wow! I really applaud your work and effort. To do this level of work in the middle of the night is beyond commendable.
Thanks for you time and effort…
Gary G.
Peter,
Unbelievable detail and work. I’m looking to short close to gap fill.
New to the detail of EW and getting a first class education
Thanks
You’re welcome. Well this wave down has been making me a little crazy trying to figure it out. 🙂
Peter,
From the ES chart above, are you looking for a 90 point ES drop in this first move down or is that more of a target for December 14th?
I will admit I am tense about the notion of a big decline in front of the Thanksgiving holiday and the previously mentioned “always up in a 5 year” discussion !
Gary G.
This wave down (the 5th) should be the same length at the third. The December target should be a much bigger drop.
The third in ES was about 90 points.
ES should go up to 2064 here in 3 waves to complete a second wave. It looks like we’ve had one small wave down. Then we should be off to the races. SPX seems to me to be just short of 38%.
Peter,
did you want to say “to complete the Fourth wave” ?
I’ll tell ya, Dmitri, this is an absolutely brutal market to try to go long in. Much better to wait until it gets to where it’s going and short it. It keeps backing up past normal retracement levels.
Follow the crude.
It will be that or it will test the top. I think the first wave down is motive, though. If that’s the case, we should only retrace 62%.
Sorry … that retrace number is 2054. I’m tired …. 🙂
Wow!
A high and reversal at 2060.50 !
That’s cutting it close.. What does a move above 2061.75 (if it should happen) mean to you as you see this morning’s action Peter?
thx,
Gary G.
It goes about that number and I’m dead wrong. Because then it goes into the area of the first wave. Fourth waves can’t do that, so it would have to be something else happening. That’s a hard EW rule and can’t be broken.
Now we just need a tiny second wave to confirm this with a rollover at 62% of that drop. Get our your magnifying glass … lol.
Seriously!
We had a similar situation a couple weeks ago.
Typically, we would turn down pretty quick and violent and haven’t.
We are sitting and flirting with the overnight highs..
Any update on you currencies analysis / comparison?
Gary G.
I am obviously wrong.
The next stop is the previous 2nd wave at ES 2087. That would create an ABC double pronged second wave, which is extremely bearish and will lead to the third wave down.
Then we’re back to my first count, which would take us back to the previous high.
I find myself looking at USD/JPY which looks like it’s going to do a double top now. It’s 12 pips away and that may provide the clue for the turn.
The structure of this wave down is really throwing a big wrench into the works. It’s incredibly difficult to read and I don’t have any information on what a leading diagonal does after the triangle part is done … and neither does anyone else, I don’t think. So I have to wait for the market to tell us what’s going to happen next.
We are in the fifth wave of this wave up. It’s a corrective wave so far. The C wave is now 1.618 X the first in ES, but it’s surpassed that level in SPX. That would be a typical stopping point. We’ll just have to see what happens.
All the momentum has disappeared.
I will point out one other thing. I have read that in the futures, the fourth wave rule has been broken on occasion by a few ticks. The bottom of the first wave in SPX is 2068.23 and that has not been broken. If that’s broken, this is definitely not a fourth wave.
SPX is at the moment at what we’d call a fourth wave flat. So it’s not out of the question that we could roll over somewhere around here.
Euro dollar has also gone to a new low, so it’s not quite done bottoming. The other major usd pairs seem to have bottomed. We may simply be waiting for everything to get in sync.
If we’re going up to the top, this would be wave one and we would have to correct in a second wave (down) soon. So there are options.
On a crossroad
Today is a possible mercury turning point so this could be a dead cat bounce.
Let see what will happen.
Nothing seems to have have violated wave 4 except ES, correct. So is plan still in place at this time?
Technically, yes, but I think we’re going higher still. There are gaps just above and I think they will need to be filled. That could either happen now or in a second wave later, but I think they’re higher than the second wave would reach. I put us in the fifth wave of this wave up and if it’s 1.618 X the first, it takes up into the gap.
Honestly, trying to guess where we’re going in a moving market is a fool’s game. The market will tell us … eventually. I wouldn’t count on the bottom of the first wave in SPX to hold.
This 62% retrace we’ve just done within the fifth wave now suggests we have the third of the fifth coming up, so that should take us up to ES 2080. This supports the double second wave idea. We could also head to the top from there.
My top choice for a count would be to test the previous top at 2116.48 SPX based on today’s action. This is a motive wave and the wavelengths suggest the top as a target. I’m going to put Bob Prechter’s leading diagonal to bed permanently, I think. But we’ll see what unfolds here before I order the gravestone.
This video is really informative : )
https://www.youtube.com/watch?v=8GP87dgTqF8
Gary G.
Thanks, Gary, for sharing
As mentioned yesterday, bought UVXY this morning between $ 28.00 – 30.00 Sold half at $ 31.69 Keeping half for now. Good luck to all.
It is nice to see gold coming down. I am true gold bug, although I have no gold stocks nor physical gold. It looks like gold is coming down to at least the 1035 – 1028 level with a possibility down to the $ 975 level. Good luck every one.
Not right now, but it will eventually.
Sold other half at $ 33.28 UVXY Waiting for another set up. GL
We’ve spent all day today on wave 4. So we have wave 1,2,3 and 4 in place. Wave 5 still to go.
The big question is if this is the first wave of a five wave sequence or if this wave (in 5) is “it.”
The corrective wave down today is very shallow for a wave two. If it’s wave 4, then we would expect to continue up to about 2068 SPX. That’s only a 50% retrace of the entire wave down.
If this is wave two and we have a third wave from here that’s 1.618 X the length of the current third wave up, it would take us to the top at 2116 SPX.
I’ll update a chart or two tonight but the short-term forecast will be questionable.
Note that the ES is the only index that has travelled into the area of the first wave (by only 1.5 points or so), so other than that anomaly, my count from last night still has some validity. If SPX rises above 2071.34, then my count would be doubtful. That’s because of the lack of clarity with regard to leading diagonals (and if they even exist).
It’s a dangerous market to play in. However, it will give us a clue as to where it’s going in the not too distant future, I think. Stay safe!
Thanks Peter, Had a nice day of trading today. If ya have a chance could ya post a
gold chart, no comments needed.
R
Peter, could this be a measured move from low of today? Would go back to the high
of 11/6 almost to the tic, 2094.25 on ES.
R
Robert,
I don’t know what you mean. Could what be a measured move?
Distance or the low of 11/13 to high today added to the low of today.
Im so new at EW but I counted five up from 11/13 to todays high where I shorted. Then three down to gap where I got out, on a fifteen min chart. If we go up
the same move in the next few days, a big ABC it will clean up some unfinished business on my hour chart, not EW to the 11/6 high.
I may be way off but man I appreciate you hard work and dedication to work and helping others.
Robert Whitley
Good for you!
The move up has to be in 5 waves. It may only end up being a fifth wave, or it could be a much longer wave, which would take us to the top. In the latter case, yes it would be about the same length as what we have now.
I added a little blurb about the futures above. Not much has changed since yesterday, except in currencies. We still could see a reversal if we stop at the fourth wave level from yesterday.
If you look at any of the cash indices (or futures, for that matter), the structure up from the previous fourth wave (2019 in SPX) has 5 waves, but the fourth wave is huge compared to the little 2nd wave. They’re not in any way balanced. So this wave counts as a ‘3’ now and can be considered corrective. Watch for a double top and a turnover at the previous high that we’re now very close to.
I added a chart to the top of the post.
If we turn over here, and this is a typical first wave down, we could easily drop to the bottom of the C wave. That’s about 1871 SPX. It is exactly 2.618 from here extending the fib tool.
We may have to wait for the Fed meeting, later on today before things get rocking and rolling.
I added another chart showing the big picture drop.
Perhaps. EVerything’s stalling. This is potentially a 530+ point drop in SPX.
WOW,I would be happy with only 100 point drop. Over what time frame, how quickly?
Thanks Peter
EW isn’t great for time. Fifth waves of a first relative to the rest of the wave go down very quickly, looking like a straight drop.
https://worldcyclesinstitute.com/first-wave-down/
You can see in the diagram how in first waves, the fourth wave rallies to the previous fourth and then we get a drop in five waves. It would be over by the end of the week or early next is my guess.
There will be a big second wave within it to watch out for, but after that, it’s all downhill.
Thinking this through on what we know … if we head down today, we might bottom on Nov 23, one of the two big turns dates this month. Then we would bounce up (second wave)0 through US Thanksgiving, and then down in a third wave to Dec 14, then a big bounce in a fourth wave until we bottom in January.
After that is a larger fourth wave (if we go with history as a guide) that will last for months before a stair-step process down. You can go look at my 1929 charts for an example of what the scenario might visually look like.
day before and day after thanksgiving 80% and 67% positive
I knew it was high …
I wouldn’t expect this fifth of the fifth to get past 2071 as that’s 1.618 X the first.
Hi Peter
Thank you for your hard work .
There is a gap on SPY ( NOT SPX ) around 207.67 , now the price is about 206.420 , and I was thinking that we might need to close that gap before we go down .
If that happens ( reach the 207.67 on the SPY ) , then does change your count ?
SPY @ 207.68 = SPX about 2078
Regards
AZ
This gets into this issue of the leading diagonal. I don’t actually know what’s considered the bottom of the first wave. In SPY, I see we’ve already travelled into what I might traditionally think is the bottom, but now I’m coming to the realization that it’s likely the bottom of the triangle. In that case, nothing changes. Yes, we might get a little spike up to fill those gaps and then head down.
If the bottom of the triangle (208.50 in SPY) is the bottom of the first, we can go up to just below that point with no issue.
I added a “Just for Fun” chart above showing a composite of possible turn dates and the path.
Lots of interesting stuff going on in currencies. USD/JPY just did a double top, which may change the direction completely. EUR/USD had not bottomed but looks like it’s trying to to that now. Lots of sudden movement.
Peter—Squiggles damn squiggles….EW is frustrating to say the least. I suggested to Prechter recently that it was near impossible to count a clear 5 waves down to complete wave 1 in 1929 and 1987…..he agreed. The move down to the August lows had similar characteristics, that’s why the long term EW bulls label it (A) of a bullish correction, while the correct count is (1) as you have labeled it. The BIG wave 2 into the Nov highs is fairly easy to count and wave personality suggested the same. Technically I believe we began a new bear market at the August lows and the market has been on life support ever since. (short covering the primary source of oxygen along with hopes for more QE). Now, as we start wave 3 down the market has become a BULL’s worse nightmare as she is doing everything in her power to keep them engaged. We shall certainly see…..my bet…. the current wave 2 will end with a gap down for some illusive reason or no reason at all. Gary (Denver)
Well, yes, EW can be frustrating … why you need to pore over it sometimes for hours, look at other charts, drill down to the one minute level. Actually, I counted wave one through four down just fine from May 21 and even had an online argument over it (somewhere in my blog posts from way back). I was accused of “forcing the count.”
I saw wave 5 down wave by wave but missed trading it as my hard drive collapsed while out of town (in Toronto). So I’m not letting this one get by.
I could go with the gap below 2020 SPX as that will get covered by wave 2. I do think there’s going to be a sharp drop due to a volume vacuum. In any event, we should follow the typical EW path … and should get a little less frustrating from here.
This wave down has been the most frustrating for me and may end up proving that Bob’s leading diagonals do, in fact, exist. 🙂 That’s about the only good thing that’s come out of it so far … haha
To your point about EW being frustrating. In this fifth of fifth wave up, we have wave 3 at 1.618 X wave 1 and then it looks like wave 5 is extending to 2.618 X wave 1 which takes us up to 2079. But that’s also the 62& retrace level, so it works, but it makes it difficult to project wave ends/lengths.
Peter,
There is one more final gap higher on SPY @ 209.610
IF we are to close that gap before heading down , then SPX need to reach around 2092-2096.
78.6% from Nov 3rd high to Nov 16 low is about 2092.
78.6 is Square Root of 61.8 , and one of Larry Pesavento best ratios to give big turns.
Just my thoughts .. and I could be completely wrong
AZ
In that case, we’d be heading back up to the top.
Just looking at my chart. I don’t know where I got 530+ for this drop. In SPX it’s actually about 203. I must have been looking at the third wave or something. We should drop to either the bottom of the C wave or more likely the Aug 24 level and then bounce.
SPY @ 207.67 has been filled , next 209.610 and it should be over .
The NYSE has become the latest exchange to announce plans to no longer accept stop orders and good-till-canceled orders, beginning Feb. 26.
NYSE joins the Nasdaq and BATS to announce such plans.
Based on this info, I assume it will be a blood bath this spring in the markets.
Amazing … !
from time cycles i have 3 times today nov 18 (as related to highs and lows in 2015).
also north node is at 2068 (90 subharmonic). es and Cash did a short moment to about 2070. and on this moment they try to rally further. If they don’t succed in closing above this price then I believe they can go down, but wait for closing.
We also just closed the SPX gap
Peter,
is it over now your scenario with the fourth wave ?
Because Spx has also gone in the area of the 1st
No, I had that discussion earlier today …
“This gets into this issue of the leading diagonal. I don’t actually know what’s considered the bottom of the first wave. In SPY, I see we’ve already travelled into what I might traditionally think is the bottom, but now I’m coming to the realization that it’s likely the bottom of the triangle. In that case, nothing changes. Yes, we might get a little spike up to fill those gaps and then head down.
If the bottom of the triangle (208.50 in SPY) is the bottom of the first, we can go up to just below that point with no issue.”
SPY has actually retraced 62% so this is a second wave for it, DOW has now done the same. I expect SPX will, too. The outcome will be the same.
In the case of a second wave, the first wave overlap has no bearing and it proves the case for the leading diagonal. I show SPX having to stretch a little bit higher at 2079 to hit 62%.
Peter,
My target on SPX is 2096 – 2103
AZ
Well, we must be going to the top. I know I’m not the only one completely baffled by this wave. While it looks motive, the second wave, if that’s what it is, is way too short. And the Nasdaq Composite doesn’t even have a second wave. It looks corrective to me …
Volatility contracts expiration today.
So, the market should hold up until the close
Unfortunately, now that we’ve reached 62%, there is nothing in this wave structure that definitively tells me it’s done. The count of the subwaves is dubious.
The VIX was hammered down. That pushed the market up.
But it was not accompanied by EurUsd or crude
Yeah, I know. I’m short usd/cad and doing well. It’s in a third wave (cad heading up, dollar down). It fact, it’s moving like crazy!
I think USD/JPY has topped, although it may have to test a big spike from the this morning. I can get a measurement on NQ and ES that put them stopping right here, which is also the 76% retracement level. But otherwise, I don’t know why here.
Surprisingly the euro/usd hasn’t budged, so perhaps the dollar hasn’t quite topped. It’s a head-scratcher.
I’ll maybe post my count for NQ and ES tonight with a few notes. We’ll see if we get a small fourth wave tonight.
I put us at the top of a fifth wave in both those assets.They measure correctly, but the first set of waves up don’t look correct (not the right number of waves), so that’s one of the reasons I think this wave is corrective. Odd.
Second waves can go as high as they like as long as they don’t go to a new high. If this is a fifth wave, though, it should be in 5 motive waves and I’m hard-pressed to make the argument that it is… We wait to see what tomorrow brings.
Peter,
if it is the second wave than the 1st wave down was not motive
The opposite, actually.
If you count the leading diagonal as the 1st than you have only the 2nd and the 3rd after ?
Thanks, Peter,
It’s something strange with the market.
Up to now it was fueled by the carry-trade based on EUR and JPY.
It has completely decoupled last night and is levitating on its own.
I’ve been watching that. Yes, but I’m thinking this is fairly typical at tops and bottoms. USD/JPY has turned down now, eur/usd has turned up. It may take the markets a short time to catch up.
This is partly why I thought we might be a turnover today, but you’re right, the currency turn so far has not affected the equities. I think it will, though, shortly.
It should be lagging waiting for the BOJ.
Either USD/JPY rebound or the market will go down
Well, USD/JPY has topped and all the currencies have bottomed, so we have a huge shift in trend happening right now, as I’ve been mentioning. The US market doesn’t have the power to control that … it’s bigger. So guess what? I’m expecting it to affect equities big time. It’s just a matter of how long … and we’re finishing the C wave, so I think it’s very soon … 🙂
Peter,
how do you know the USD to have topped.
It may just retrace a little bit to break out higher on the anticipation of the divergence of the monetary policies.
Because of the count. Euro has reversed—it’s in a countertrend anyway and it hasn’t reached the 38% retrace of the big wave down, so it was just a matter of time. CAD and AUD have down 5 full waves down and now they have to retrace. They go in the opposite direction of the dollar and USD/JPY has a similar count in the opposite direction. I’ve been watching it for quite a while.
The reversals in the carry-trade pairs should be violent because all the crowd is on the same side
There was a whiplash in eur and dollar on the FED announcement.
This wave up from 2018 SPX looks motive for me.
It has spiked 16 points at the open on Monday, then immediately retraced 10 points and has gone up in the 3rd into Tuesday, then retrace in the 4th and today is the 5th
Because something “looks” motive, doesn’t mean it is based on EW rules. You can go look at the Nasdaq Composite and try to find a second wave. It’s clearly an abc wave up.
This market behavior resembles a lot to Oct-Dec 2014
I think we have a 4th wave down and we’re going back to the top, but I’ll post a couple of charts to show you why and also what the problems are.
But I think ultimately we have to give this wave to the bulls and see what happens.
Here you go … https://worldcyclesinstitute.com/dmitri/
The other BIG thing that’s going on is the change in trend in the currencies. Major spikes this morning. I don’t know if USD/JPY has completely changed but we should know tonight. It looks like it to me but I don’t have a complete set of waves down.
starting to look like a break above 18137 into Dec 11 followed be a drop is becoming possible ,the 16500 area still support .how to count this ?
a high back on July 2014 and nothing but 3 wave move since . I still favor a top of importance in the year 2018 . this would be a longer term set up for a huge deflationary spiral .
the wave count now to be considered is that wave 3 peaked in the year 2000 and wave 4 in the year 2009 , thus implies we need 5 full completed waves up from the 2009 low and we are now in the latter stages of wave 4 of wave 3 . once this larger 5 th wave completes ( iv now then v3 then 4 and 5 ) the market would have to go back to the 2009 lows at a minimum .
Joe
New post: just a few charts to focus on the fifth wave up and the current count.
https://worldcyclesinstitute.com/the-beat-goes-on/
This website is for educational purposes relating to Elliott Wave, natural cycles, and the Quantum Revolution (Great Awakening). I welcome questions or comments about any of these subjects. Due to a heavy schedule, I may not have the time to answer questions that relate to my area of expertise.
I reserve the right to remove any comment that is deemed negative, is unhelpful, or off-topic. Such comments may be removed.
Want to comment? You need to be logged in to comment. You can register here.