
 I’m a sailor – a captain who has a fair amount of experience with pleasure yachts up to about 50 feet, or so.
I learned to sail back in about 1964 when I lived in Long Island, New York. My father built a Sunfish, which is a small one sail boat with a centreboard—absolutely perfect for learning to sail.
My favourite place to “bareboat” now is the British Virgin Islands (bareboating is renting a yacht and sailing it yourself), but finding a crew is always the issue. Otherwise, this little guy does all the work while the elite passengers enjoy themselves—a non-starter (after so many times through the mill, but it took me a long time to figure out than changing some humans for the better will never happen).
The other downside is that as a captain, I’m personally responsible for anything my “crew” does on land or at sea. When I contract for a boat, I just about sign my life away … pages and pages of rules.
However, you’re never going to get me up in a crow’s nest. I don’t particularly like heights; I’d much rather sail from just about the waterline.
Where we are in the market right now is similar. You get a different perspective looking down from a pinnacle. That’s where we are now, albeit with one more push to a new high still to come. Looking across the markets, currencies, and even gold, they’re all pointing to an imminent top.
The message; Don’t get buried in the little stuff: Always keep your eye on the bigger picture. You need to look right across the market. Only then can you “see” what’s happening “below the waves.”
The Big Picture
ES/SPX: I expect we’re going to see the E wave of a forming triangle in ES/SPX this coming week, The direction for the coming week is down, with the fifth wave up when Wall Street gets back in force the week after. And then the real fun begins—after the turn. I’m still looking for a September turn, realizing that we could sneak into the beginning of October, but I can’t see how this market can stay up beyond that time, because we have only two more waves of a triangle left to go.
Currencies: Expect some volatility as we head to the final target. We still have a third wave of the fifth to go in all of the currency pairs. In the USDCAD example, I’m half expecting a rate announcement this week, so it could be particularly volatile. However, they need to get to their targets. As I’ve said before …
The market does the most predictable thing is the most unpredictable way.
Gold: Down first is my call before it turns up (in conjunction with a US market top). However, all the waves up are corrective, so it actually could head up further before heading down. Be careful here. If you’re going to take a stab at it, wait for 5 waves down and 3 waves up and a turn down (a lower high, if you like).
Oil: Down is the call. We’re in a triangle. However, a triangle is the most “balanced” pattern of the EW batch, so between the trendlines, oil can do what it wants pretty well. The major inflection point is at $49, so we don’t want to be above that level.
EW Record So Far
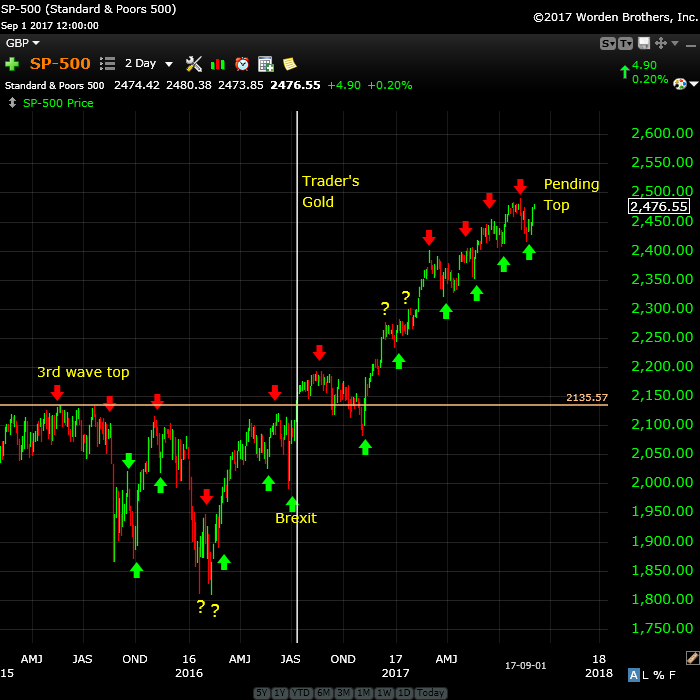
Above is the two day chart of the SP500. This is a review of my major calls for the past couple of years, both in the free blog and my Trader’s Gold service, which I began in August, 2016. In the Trader’s Gold service, I analyze gold, oil, the US indices and five USD currency pairs.
The red arrows are calls for tops and the green arrows are calls for bottoms. The question marks were points at which I was not confident in the wave structure and could not confidently call a turn. On those occasions, the market could have gone either way, imho.
The structure of this wave up from about 1810 on February 11, 2016 is clearly corrective, which has been the major challenge in accuracy. Most Elliott-wavers would be expecting a motive set of waves up, but that’s not what we got.
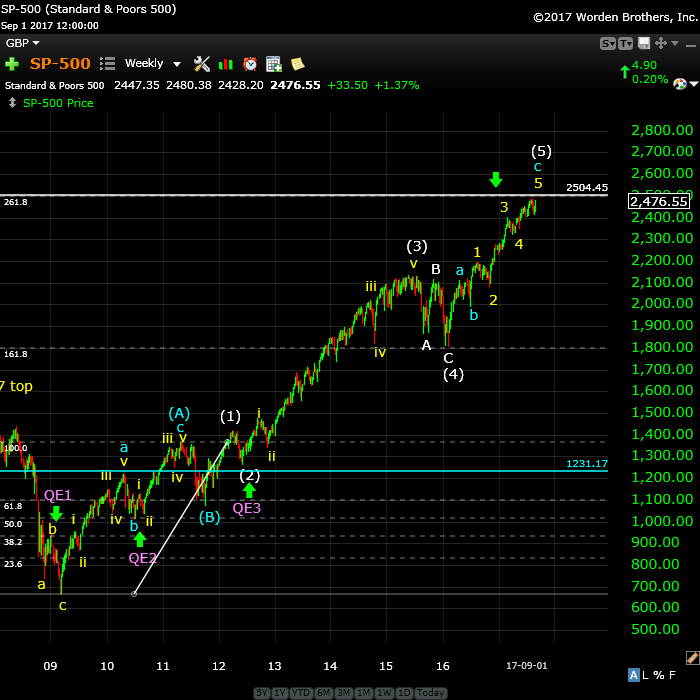
Above is the weekly chart of the SP500 showing the corrective count right from the bottom at 2009 up until today’s date. We’re in the final wave of this corrective “blow-off” and I’m expecting a turn down within the next month. This will be a major turn to a bear market that will last years.
The blue line is the 62% retracement level relating to the so called “Great Recession.” That was the drop from the 2007 to the 2009 low. We expected the market to then rally 62% and continue down, but quantitative easing took over the market rallied and has kept rallying until now.
However, contrary to all the noise and punditry, the Elliott Wave Principle has continued to work as it always has, showing that it’s a natural phenomenon that works in all markets, no matter how crazy they are (and this has been the most difficult market ever to analyze).
We’re just about at a top, with one more pattern to play out, and that’s a situation that I’m finding across US equities, the DAX (and related indices), TSX, and USD currency pairs (including the dollar, which is the asset that determines what happens to all the others).
We’re moving towards a major top, and the market tells me we have only a few weeks left to go.
_________________________________
Rise above the rest … SM 2
Rise above the rest …I have only ever met a few people who, in their chosen fields (astrology, medicine, music, martial arts, technical analysis), rise above all the rest and you are one of them…you have ‘the gift’…and that’s why I’m a Trader’s Gold member. —SM |
Have not had a losing week RW 2
Have not had a losing week …I have been with Peter almost a year. The only thing that matters is have I made money with his service. I think I have finally turned the corner using Peter’s EW. I have not had a losing week in the last 5 months. Thanks Peter, for your amazing amount of hard work. —RW |
The best of them JL 2
The best of them …Last couple of years, I subscribed to several ‘market traders’. You are by far the best of them and the personal contact is awesome. Daily and daily updates are very well written! Besides your expertise in EW, I also like your cycles analysis. Best investment I ever made! —JL |
Couldn’t be happier … KK 2
Couldn’t be happier …The analysis and insight you provide is simply amazing! I’ve been trading the futures and equity markets for well over thirty years and usually average around 5% monthly. Since joining your Traders Gold Service two months ago, that number has better than doubled. I couldn’t be happier.—KK |
A true expert in Elliott Wave FL 2
A true expert in Elliott Wave …You are a true expert in EW analysis. What you provide is not available anywhere and is priceless. Subscription on your services is the best thing I have ever done. Many thanks for your effort to make me a better investor. I now have more trust in my investment decisions. I hope you will continue the excellent work! —FL |
the real deal SM 2
The real deal …‘Educational, insightful and thorough market analysis for all levels of traders. It’s Elliott Wave at its best….Peter Temple is the real deal’ —SM |
Get an upper hand … JC 2
Get an upper hand in trading …Seeing all the different currency pairs and the wave structures and hearing you explain why this has to do that on a nightly bases gives one a upper hand when trading. Elliott Wave applies to all stock and indices and can be applied to any candlestick chart. If someone ask what you want for Christmas – Tell them a membership to Peter’s “Traders Gold!”—JC |
Tops in your field DZ 2
Tops in your field …You are tops in your field. Tried to follow Elliot Wave international for years. They were always behind the market. After discovering you, I perceive that you are an expert in reading the waves, which puts you way ahead of the rest of your peers. And you can read the Waves like you are reading tomorrow’s financial section. I pray you stay healthy. —DZ |
The Market This Week
Here's the latest daily chart of ES (emini futures)
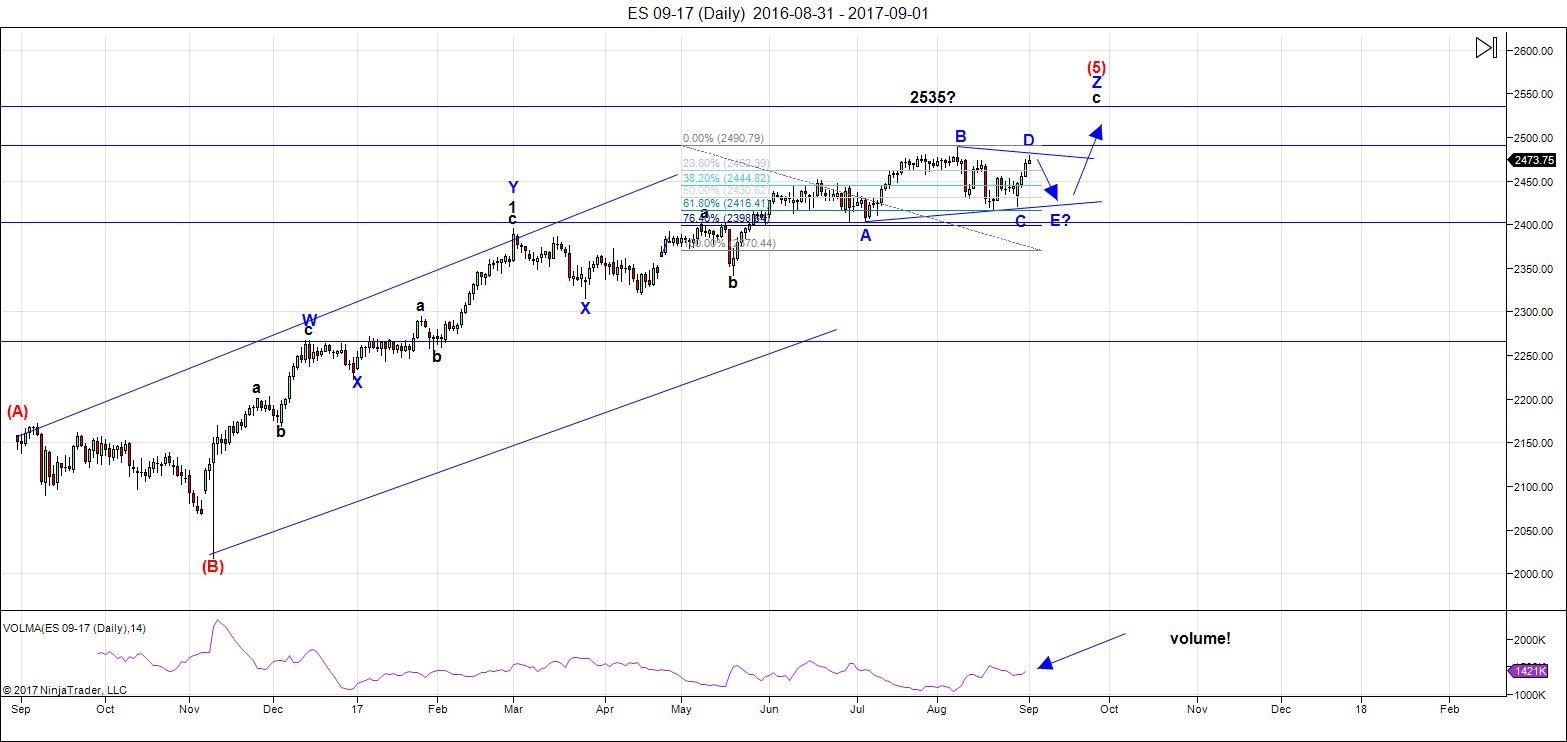
Above is the daily chart of ES (click to enlarge, as with any of my charts).
My prognosis is once again panning out, but with one very subtle change. On Monday of this past week (Aug. 29), the b wave of the third wave of a proposed ending diagonal dropped to a level that suggested the third wave would not make a new high. Therefore, I alerted my Trader's Gold subscribers that we were most likely looking at a contracting triangle, rather than an ending diagonal—a subtle difference, for sure, as the pattern remains essentially the same.
With the turn at the end of the day on Friday (if it holds), we're confirming the contracting triangle. NQ is still in the larger ending diagonal and has two moves left, as well (a down wave 4) and a final 5th. Both ES and NQ are in sync for a final run to the top (after an E wave down, on the chart above).
USD currency pairs are also in their final waves and so they should all converge on their final targets together.
Volume: Note that volume now expands with selling, but drops considerably when the market heads back up. This is yet another signal of an impending top.
Summary: The final wave five in ES,NQ and SPX is in progress. We have a contracting triangle in the final stages, with a E wave down starting now (we could get another tiny wave up to test the top of the weekend before turning down in earnest).
______________________________________
Sign up for: The Chart Show
Wednesday, September 13 at 1:00 pm EST (US market time)

The Chart Show is a one hour webinar in which Peter Temple provides the Elliott Wave analysis in real time for the US market, gold, silver, oil, major USD currency pairs, and more. You won't find a more accurate or comprehensive market prediction anywhere for this price.
Get caught up on the market from an Elliott Wave perspective. You’ll also get Andy Pancholi cycle turn dates for the SP500 for the balance of the current month. There’ll be a Q&A session during and at the end of the webinar and the possibility (depending on time) of taking requests.
All registrants will receive the video playback of the webinar, so even if you miss it, you’ll be sent the full video replay within about an hour of its conclusion. For more information and to sign up, click here.


Thanks, Captain Pete.
Only because I have a hat that says that. Like the Donald, the hat is everything … lol.
Fascinating times to be in the market. Thanks for the update!
I love trading triangles. The scenario is setting up perfectly for the classic and predictable thrust at its completion in that final manic wave up you’ve been predicting. The only possible difference I see is that I was counting its start off the August 8 highs with two very clear zig zags for the A and B leg so I was expecting a C leg down on deck. Either way, I suspect it will remain within the contracting trend-lines, failing to make new highs or lows, and thoroughly befuddling traders who are not aware of what structure is developing and nimble enough to trade the increasingly narrow ranges. I just LOVE ’em! 🙂
ps. The way I like to trade em is is with both put and call credit spreads using the triangle trend lines to choose strike prices. Since we expect a final wave up after the triangle, this approach can be quite powerful as it allows you go out far enough on the spreads to hold onto the long calls of the call credit spread in anticipation of the thrust from the triangle, as well as the long puts from the put credit spread in anticipation of the completion of the final wave up. In the meantime, you simply harvest profits from the short legs of the spread as price moves between trend-lines as the triangle unfolds. This approach drives the market makers crazy as it is one of the few times you can reliably beat them at their own game. Watch the bid/ask on contracts during this period as they like to try and bamboozle traders with ridiculous spreads. You can generally do a lot better than the official bid/ask using limit orders. Have a great trading week everyone!
thanks for these thoughts, verne. On the spreads presumably you are describing diagonals, where the long call and long puts are farther out in time than the short calls and puts? that way you can close the short ones and keep the long ones, and roll the short ones as well.
Whitemare, the credit spreads I use would not be considered diagonals or calendar spreads as the two contracts have the same expiration dates although they have different strike prices. The strategy is quite simple as obviously in the case of the bear call spread the expectation that the value of both the sold and bought calls will decrease with the gain (credit) from the lower strike call sold, off-setting the loss from the higher strike call bought, the latter essentially being a hedge to limit risk. The reverse is the case with a bullish put spread.
PALS this week:
Phase: weak until late in week
Distance: weak until Wed, then two weeks strong
Declination: strong until Wednesday, then weak into weekend, then two weeks good
Seasonals: September not usually strong
Summary: Waiting in cash until at least Wednesday.
Is it a good enough dip to buy
I don’t believe in coincidences. Peter Temple is a sailor, a person that controls a vehicle which traverses a liquid a characteristic of which is a pattern of waves. And is a EW trader, a person that controls an investment vehicle with liquid capital based upon characteristic patterns of waves. =)
Nicely done!
Thanks Peter for all the research and leadership. As you have proven your character, I would sail with you any day.
Yes indeed! It is great to have a great helmsman as we navigate these treacherous market straits. I am expecting the moves to become even more manic as we approach a final top. On Friday I opened a massive DIA 215/220 October bearish call credit spread that I expect to hold for no more than a day or two as the triangle will in all likelihood complete in a few sharp whipsawing moves. The next week or two is going to b a wild ride! 🙂
why call spread, why not bearish spreads..what I have seen in past if market moves against you and you think it will comeback…
I meant why not bearish put spreads
Hi Bill. The call spreads are CREDIT spreads, which means I sell in the money calls and buy out of the money calls for a net credit. The spreads are bearish as they expect the calls sold to decrease in value as the market declines. It is the safest way to trade in this unpredictable market.
Love the photo Peter , happy times on your boat.
Phil
2 nights ago I had this very vivid dream. I saw a large group of people in the streets protesting. It was about a currency crisis. Then I heard this voice say, “The Euro must go!” . Then I woke up. I don’t know if this dream has any significance but I thought I should throw it out there anyways, just in case it does.
Tom, very intuitive of you. It is just a matter of time before the Euro goes down the drain well below the US $
Thanks for the update Peter
For me it was a 14 foot sealark in lake Washington .
In later years sailing the San Juan islands . Then came the Bering sea
And crab fishing in every imaginable weather condition and now
Just back and forth on the left coast, lol . I think you dated yourself just a bit and have
A few years on me 🙂
As for the stock market, my eyes are on the big picture and I agree with you
The minor detail ( timing ) that concern me though cause me to pause
Like a large ship backing down hard as it heads towards a bridge pier
Running down wind with a strong current on her stern in thick fog .
Peter G , ???
I guess we will soon discover how the market reacts over the next 14 trade days .
The 6 week period following the solar eclipse lands in the Sept 28 Oct 8 time period
If my memory is correct .
15 years from the Oct 2002 low and 30 years from Oct 1987 low .
The Aug 1982 low to March 2000 high is spx also calls for an Oct 2017 high .
Oct 2007 high plus 10 years is an odd count , Nov 2012 plus 5 years ( 60 months )
Dec 1 2017 the mars Uranus opposition and the ven mercury Sun conjunction
Should be a trigger and the Elliott wave count is completing .
Long term indicators are pegged with some at records ,
The correlation of this present Sun spot cycle dove tailing with the maunder minimum .
The odd time count of 1932 to 1975 of 43 years low to low still allows for a 2018 high
Yet that does not imply the year 2018 needs to be an all time high . It just means
The benner business cycles 90 plus year accuracy will most like be another nail
In the coffin and we have that shipping backing hard trying to avoid a collision with
Everything going against it .
The end is nigh
43 years
86 years
172 years etc….
Things are adding up
Correction
Dalton minimum …. It all lines up
Taking profits on my bearish call spreads. I suspect we are in another C wave of yet another corrective zig zag.
Capt. Peter T,
I agree with Phil. Love your photo with dawn breaking at the background. Really gorgeous picture.
Thank you again for the guidance. My problem is JPM. It has gone below August lows and seems to be heading down to Jun lows.
I’m not sure what Joe is saying. I’m thinking he is hinting at a possible Oct. 8 low because of the Puetz crash window?
Take care.
valley , is the dip good enough for you.
valley , are you ready to buy?
The song “how low can you go” seems the theme song until the fat lady named Irma is done singing.
It seems to me that both Irma and Kim Jong Un have the potential to be “Black Swan” events, possibly presaged by the numerous Hindenburg Omens we have witnessed the past several months.
What do Irma, KJU, and the Hindenburg have in common? Full of hot air. =)
Good one!
When, in the case of Mr Kim, the hot air is of the thermo-nuclear variety, and in the case of irma of sustained wind speeds exceeding 200 mph, those are ominous omens indeed! 🙂
Will we use one of the secret new-fangled toys from DARPER to subdue this cretin, or are we going to food the region with radionuclides?
The Chines subtlety in trying to play Kim against the US for their own self-interest is about to back-fire big time. It now is not a matter of if we are going to respond, it is just a matter of when and how, with enormous consequences for that neck of the woods, even for non-combatants. The Chinese are about to have their economy hammered with trade sanctions for their most unwise policy of aiding and abetting this monster. They have clearly over-played their hand in the hope that Kim would take out the 7th fleet, allowing them unhindered access to Taiwan. This is going to end badly for everyone I am afraid.
Joe,
Just went back and reviewed your posts of July 14th where you provided two links:
(1) chart showing the bearish decades and..(2) a charts showing the bullish decades where they on average peaked between July 28th and August 11th. S&P peaked on August 8th on an extreme basis and on August 7th on a closing basis.
With today’s action…your analysis looks like it is a “bullseye”! Like Peter T says… “Trade what you see not what you think!” Am I missing something?
You have set forth analysis that seems quite amazing…but you seem to be walking away from it! Not a criticism! Simply an observation!
Could you possibly address any reservations that you might have had since that
July14th post? Again, I find your analysis of the “bearish and bullish” decades most interesting and compelling.
Looking forward to any response that you might have!
Joe,
Since my post above I went back and read many of your post over the last several months. At one point you mention “zero sunspot” days could hint of a market turning point. At another point you mention a George Lindsay and his bottom to bottom to top using the 1982 low and the 2002 low identifies October 2017 possible high and a turning point.
In your thinking do “zero sunspots” and possible October 2017 high make you more cautious? Your “Bearish and Bullish” decades charts are at least to me compelling.
I am not trying to be confrontational. Just trying to understand. Everyone appreciates your perspectives.
Peter G,
Was it you that mentioned the Steve Puetz Crash Cycle? I believe the full moon played into that thesis! According to the “Moon Phase September 2017” calendar that Full Moon could be either today, September 5th or tomorrow September 6th.
That seems to coincide with Joe’s July 14th post concerning the Bearish and Bullish decades. Any comment?
Solarham.com has X9 solar flare earth facing coronal mass ejection about 5 hours ago. X9 is one of the largest of the last decade.
Ed and lizh
Peter t present update is about the bigger picture and my comments are about the bigger picture .
We are heading towards the end of the bull market that began in 2009. Every year there are cycles
Which tend to correlate ( work ) with that year . What works in one year won’t always work the next
Year . On a relative basis vs the earth as an example the planet mars has the longest cycle of 2 years vs every other
Planet which is only 1 year. That may not sound correct but if your looking at planets in relationship to the earth
It’s how I see it . As for the puetz cycle I still feel we do not have a true puetz cycle this year based on my perspective
Of the puetz cycle . My view differs from Peter g and I’m not saying I’m right or wrong just saying I look at it from a different
Yet very strict view point . In the broader sense we have several different cycles all coming together at the same time.
Mercury just turned direct , having been retrograde since August 12 th . So a change should come , Sept 28 th is another
Planetary alignment which I can’t ‘re call yet based on what I have read , it brings tension . To me this implies as we move past Sept 28 th ( which happens to be the 6 week period after the solar eclipse and a different cycle of its own ) the tension
Between north Korea or congress the senate the budget deal daca etc…. Should begin to abate. In short we should begin
A new cycle in October . How that effects the stock markets remains to be seen .
The late Sept early October time frame should be intense yet I’m un sure how it effects the stock markets . Mercury turning direct I see as a positive for stocks , Peter t shows that the wave count has more to go before being complete .
What I find fascinating is the USA debt and budget deal must be done by Sept 28 th .
In regards to the puetz cycle and I think Peter g will agree with me on this point ( even though I don’t feel we are in a true puetz cycle now ) under a puetz cycle there is no guarantees a crash will happen , it’s just a window of opportunity that if a crash
Was to come then that window is the likely time period . Under the mars Uranus cycle the same note of caution applies
And it’s guideline is that you look for a high at the opposition which is Dec 1,st 2017 and it duration is longer than the puetz cycle , the Venus bull and Venus bear cycles last approximately 10 months each ( 20 months from low to low ) also has some rules that apply . As example when the market flat lines or declines in a Venus bull cycle then when the Venus bear cycle hits look out below . With the mars Uranus cycle I take a similar view point , following Dec 1 this year we will be in a bearish cycle
For pretty much all of 2018 with just mars Uranus , the Venus bear cycle which is set to begin in Dec this year is bearish into Oct 2018 , the benner business cycle which is calling for a high in the year 2018 is then calling for a low in the year 2021.
Using George Lindsay time counts the low in early November 2012 was the start of the bull market yet as strange as this sounds
Using George Lindsay time spans it was April 2009 when the bear market from December 2007 ended .
It gets complicated trying to correlate every method and they do not always line up at the same time .
It is a domino effect where they collectively hit one after another .
The big picture is we are entering a time period where the dominoes begin to drop , the low to low to high count
Is one of those dominoes , the cycles based on planetary alignments another domino and the wave count is the measuring
Stick . As the cumulative of the cycles begin add up the forces of these dominoes so to speak strengthen and the wave count
Unfolds in a series of waves 1 2 and 3 . The 3rd wave being the point where several cycles are working together , a sideways trend is cycles opposing each other , short term cycles can cause a pause in a longer term cycle etc…
A ship with its propellers in reverse and it’s throttles full would be backing hard yet with the current on her stern and the wind behind her makes it extremely difficult to stop as well as difficult to maneuver. A semi truck can’t just slam on the breaks and stop . It takes time , and if there is not enough room you end up in a collision .
My point being we are heading towards a disaster and as much as our Fed or political leaders attempt to avoid it , there is to much going against them to avoid it . There is a chance that they do something though which relieves the tension
Yet it won’t be enough as we head into next year .
For me personally I see the next year as bearish , I can see the nightmare scenario as well as the not so bad .
What it will come down to is the actual price move in the market .
Wow! Thank you for your thoughtful and detailed response!
Joe,
Thank you for your ideas. I think this is the first time you’ve posted strong bearish sentiment.
I find it amazing how politics are playing out with these cycles.
I hate politics but finding it helpful .
They called for the three-month debt-ceiling deal, which would kick the issue into mid-December, allowing them to maintain their leverage as Congress worked out agreements on other agenda items.
I can’t say I blame trump in the least bit .
https://www.google.com/amp/s/www.newyorker.com/news/ryan-lizza/how-democrats-rolled-trump-on-the-debt-ceiling/amp
Solarham.com shows highest KP (geomagnetics) index reading I have ever seen. The CME that left the sun two days ago is arriving. The solar flare that created is was X9 and partially earth facing.
https://www.nytimes.com/2017/09/07/world/americas/hurricane-irma-caribbean.html
http://www.telegraph.co.uk/news/2017/09/08/mexico-earthquake-magnitude-8-tremor-rattles-buildings-capital/
Valley
I see it . Typically I add 39 hours to the red bar
Yet it looks like that will be this weekend so tough
To say how the market reacts
http://www.n3kl.org/sun/noaa.html
Looks like a spike in sunspots as well
http://www.solen.info/solar/
There have been 3 sun corona ejections last days. The most powerful one classified X9.3 was on the 6th of September. It was 10 times more powerful than predicted and reached the Earth today 12 hours earlier than usually. It also comes at the bad angle literally “burning” the Earth magnetic field.
/YM Broke trendline from July 11 low, 8/21 low to 8/28-29 low. Maybe from 8/21 low, triangle may turn into an expanding one?
For any of you who may have family in or live in Florida .
I pray for your safety .
Events like this are never easy and I feel your pain .
Big picture.
I expect a major high around 9/20-22. Read what David McMinn said about lilith trine the node. This will be 9/22. But this is also the fall equinox and that makes it all very special. The capitulation date will be 10/3.
Next week we will see a high Monday with a low monday/tuesday caused by a tidal inversion. Another high on Tuesday as 9/12 is a strong date. 9/13 will be a low as it is 89 times 144 days from the 8/12/1982 low. From 9/13 we start the last leg up into 9/20-22, First high around 9/15-16.
10/3 is a strong date as it is 131 times 144 days from the 1966 high. This date must be tested as a high. Will it be a higher high? I doubt it.
My gravity indicator gave a significant low reading 9/11/1929. The high came 8 days earlier. We see another significant low reading 9/28/17. 8 before this date we see 9/20. Carolan’s fall high is 9/21. 9/22 lilith 120 on the node and 9/22 equinox.
Before we test 10/3 we see a low 9/28-29,
Cheers,
André
Thanks for the info. My own time cycle shows a high Sept 22nd before having a dip thru the last week of Sept I am still long. 40%
I have not made any money for the last 2 months due to our Cdn dollar sky rocketing against the US $ I also see a higher high in Oct 6 th thru the 8th Fully expecting to see approx. 2525 level All the sentiment readings are all bearish at this time, in part due to the hurricane’s, earth quakes ect. If their is going to be a market correction, the bulk of it will be in Oct. All the best every one.
I agree Dave. I am guessing (Pres. 1st year cycle, Chinese Heavenly Stem Metal, Uranus conjunction) that October will feature a rather deep sell off that snaps back into the November holiday gift buying season.
The high I see is the 6th Not the 8th Oct
André thanks 🙂
Hi André,
Assuming no change, I am patiently waiting for Sep. 20 to go short. Please don’t mind updating your view if necessary 😉
And I am sure a lot more folks here appreciate your work than you’d think. Have a great prosperous week André!
there have been some previous posts/discussions relative to Martin Armstrong’s historical stock market calls…the purpose of this post is to memorialize Armstrong’s current take on the stock market…
“The Dow – To Correct or Not?” – Martin Armstrong | September 10, 2017
https://www.armstrongeconomics.com/markets-by-sector/stock-indicies/dow-jones/the-dow-to-correct-or-not/
“There is absolutely NO WAY we are looking at some drastic correction that ends the bull-run.”
This will be a make or break for Martins reputation going forward. I for one, agree with his current analyze.
what is “Martin’s current analyze”?
Hello Rotrot, I have followed Martin since 1994. I use to bring my top 10 clients to his seminars here in Vancouver when I was a financial advisor. He is one person I would not fade. He is calling for a turn date on Nov 24 th, 25 th
The correction into Jan/ Feb. Please notice rotrot, I said the word CORRECTION, NOT CRASH. Please note, I do not take every thing he says as gospel. I have my own very unique model that I have developed over time. All the financial gurus out their, I take with a grain of salt including Martin. My model says the bulk of the correction should be in later part of Jan. and me lander possibly into April/ May before heading into new highs in our North American indexes. Again, this will not be a crash as some of the BEAR PORN would suggest. I hope this helps. All the best Rotrot.
Yes, I use a great deal of discernment what I post. This is referring to your comment on the other post.
Solarham.com shows another X class flare Sunday morning similar to the one last Monday. No news as the the direction of the CME.
X8.2, amazing following the X9 last week. West facing so somewhat limited geomagnetic effects in two days.
A new blog post is live at: https://worldcyclesinstitute.com/mother-nature-always-wins/
This website is for educational purposes relating to Elliott Wave, natural cycles, and the Quantum Revolution (Great Awakening). I welcome questions or comments about any of these subjects. Due to a heavy schedule, I may not have the time to answer questions that relate to my area of expertise.
I reserve the right to remove any comment that is deemed negative, is unhelpful, or off-topic. Such comments may be removed.
Want to comment? You need to be logged in to comment. You can register here.