This market makes me nervous. I’m personally taking a “wait and see” stance. It’s a really good time to sit on your hands. I’ve tried to portray a sense of caution but want to make sure I’m being heard, particularly as the latest moves have injected a bit more doubt than earlier moves.
When I take a position, it’s as a trader. I had someone tell me that it’s better to be noncommittal with labelling, and to only show market direction. If I did that, I’d never know when I was wrong—in other words, where to get out. In trading, you always have to have a point when you’re wrong and that’s where you put your stop.
So, at this point, the market hasn’t done anything “wrong” in terms of this count, but it’s not helping much right now to confirm it.
So let’s look at the elements of this market that make me nervous. You can look back at yesterday’s chart to see where the charts tell me we are here.
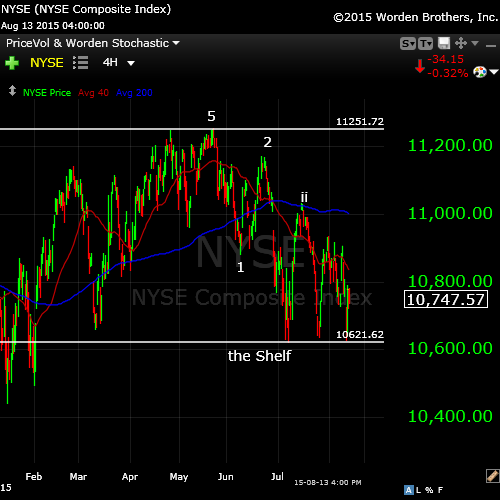
Above is the NYSE. What makes me nervous here is that we’re having a problem breaking “the shelf.” So we’ve actually had a wave come down in a definitive 3 waves. We have to break this shelf before I start to feel good again about the market direction. On the other hand, if we head up from here past the previous spike at 10,906, I would be out.
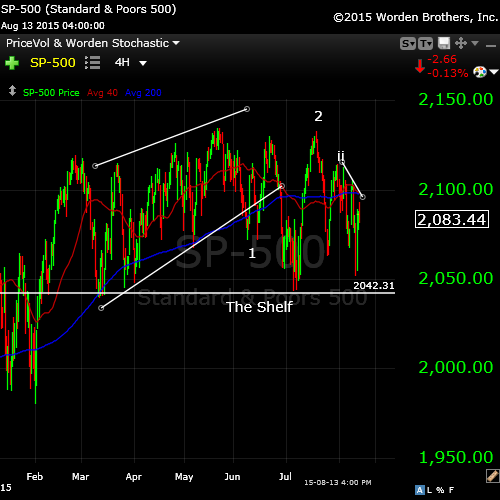
Above is the SP500. This is the index that makes me the most nervous. It also hasn’t broken “the shelf.” This is a major support level and so we may simply be bouncing while we work through all the stops, but until we break the support shelf, I’m nervous.
From a big picture perspective, there is still a concern that the SP500 could go to another brief high because the ending diagonal is not clear with this index (that would require a 3 wave move). All the others, particularly the NYSE, have a clear ending diagonal count. So, the shelf is the key confirmation level for me.
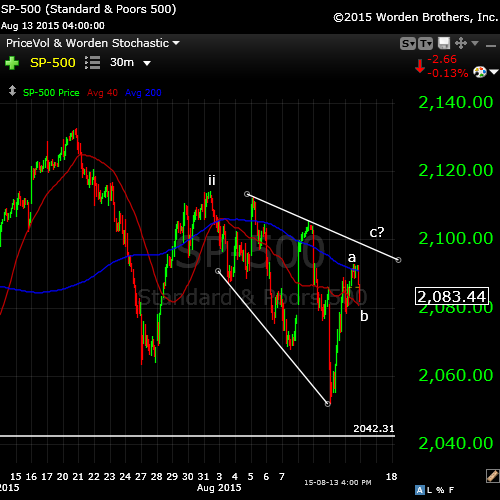
Zooming into the SP500, you can see the channel of three wave moves. I’m expecting a c wave up today but the question is, where does it stop … at the channel top, or does it go to about $2114 to complete a double second wave top (at ii)? If it goes any higher, I would be out.
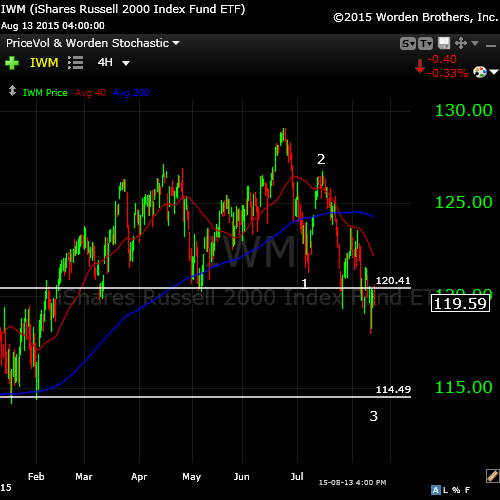
Now, here is the Russell 2000—small cap stocks. It’s more clearly in a third wave and this supports the current count. This has a similar look to the DOW.
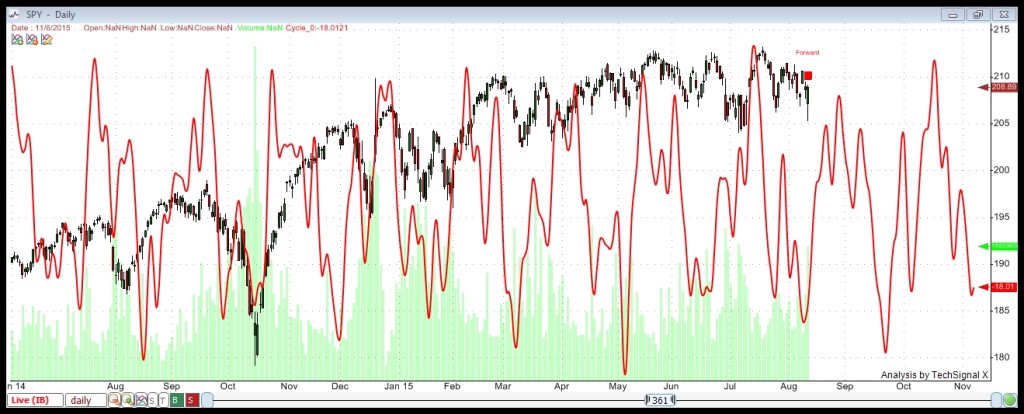
Finally, I’m concerned that we’re leaving our window of negative cycles. We have a non-confirmation with these shorter term cycles. This set of cycles has always been rather weak and we’re starting to get into a timeframe that’s beginning to be supportive of the market.
Summary
The point is that the market hasn’t done anything to upset my current count, but if it’s going to do it, now would be the time. Once we drop below the shelf, it would be hard to argue anything but the completion of 5 waves down.
Be careful out there!


Thanks Peter for the analysis! 🙂
In my humble opinion, a small cap index like the Russell 2000 often shows the path that the major indices have to take. 😉 I look at the AMX (mid cap index) to see where the AEX should be heading. Am I the only one thinking this or are you guys seeing this as well?
@André, first of all, how are you doing!? Second, do you think (looking at the new moon that hit in today) we will bottom out 17/18 August and than we go up? I believe your roadmap said next week would be down till 18/19 August right? This is in line with my thoughts… 🙂 Do you see any pricelevels for the bottom or?
@John, we both still full in the shorts (put options right?), whihaho gogogo. 🙂 You can concur with what I wrote above? And what price levels do you see for the AEX / S&P? I see 460 for the AEX and I guess 2030+- for the S&P. But hey, I am an uber bear, hahahaha. 🙂
Cheers,
W
Hi Wouter,
Sold all the puts september 440 a 2,85
Bought them at 0,75 so I m happy had some bad trades before..
Next week I m watching the dollar and decide if I will be long again…
Balance…
https://www.youtube.com/watch?v=A2YS6KVrQqc
Nice weekend..to all
Wouter,
I agree on the IWM comment – why I included it. We have some more up to do, but it’s a countertrend move … just a case of figuring out the target. Likely 2104 or 2114 in the SP500.
The moon is creating a rate of change extreme. 8/2 was a perigee roc extreme and 8/18 will be an apogee roc extreme. This is a significant inversion. During this time band, the market can be sideways. This week Nikkei set an ATH and Wall Street was down; so internationally markets were out of sync, what kept wall street ‘above the shelf’.
Tuesday it will all be over. Next week is very heavy astrologically. In one week, Earth,Mars,Venus and Mercury change sign in the heliocentric sidereal zodiac. With orbits 365, 687,225,88 days, this synchronization is remarkable. Also, after the new moon we start a new 1,6 year venus/earth cycle.
Last weekend I said I was uncertain due to venus being retrograde. And we all know what happend. This weekend Venus is at the retrograde midpoint. Also we have a midterm bradley date 8/15. On 8/19 we will be 90 degrees from the 5/20 high.
So in summary : we are down into early september as per my roadmap. The lunar inversion kept the market levitated between Perigee and Apogee. Next week the downtrend will resume.
This is consistent with the uptrend in gold due to jupiter’s ingress in vergo.
We are headed for the supermoon opposite Jupiter 8/30, mercury max east 9/4, venus at 16 degrees (9/3) and turning direct 9/6.
My Gann timing system on the DJ 1929 high gave 7/20 at 180 degrees. 9/2 will be at 180 degrees.
Next week I expect a pull up into apogee on Tuesday and then – finally- the slide down into 9/4.
I could be totally wrong. But this is what my own analysis gives me.
Cheers,
André
André,
That fits with my expectations. We may get up to a double top on the second wave by Monday sometime. The wave down was in three so it had to retrace, although it took a lot of us by surprise. Trend is still down … just taking a while to trigger.
Thanks for the update, all the work and thought.
Peter
Andre, you must be a young man. The Nikkei hit its all time high way back in in late 1989 at 38,957. This was the highest since the low in 2008 and 2008-11 double bottom.
Peter,
Thanks.
One other Gann analysis. The major 7/20 high was 34 days in my galactic year (6/16). In the square of 9, 34 is on the vertical main angle. Next numbers in this angle are 61 and 96. Combined with 6/16 this gives us 2 major dates : 8/16 and 9/20. This is yet another Gann technique that confirms my main expectation : down into 9/4 and pull up into 9/20-ish. 8/16 is also a NYSE AND Nasdaq date on the 9/18/14 high(p2t technique).
Considering nyse was at 11024 and Ndq at 4593 it is unbelievable that converting those prices into time gives us exactly the same date. This means that deep beneath the surface the prices at 9/18/14 had to be at that level. DJ1929 (381,17) gives 8/17. S&P on 10/15/14 gives 8/19.
Cheers,
André
P.s. The 5/20 high was 61 days after the vernal equinox/solar eclipse.
8/18 will be 307 days from the 10/15/2014 low. 307 is one corner of the 9th ring in the square of 9 table. This same ring gives 325 days (9/5) and 343 days (9/23).
So the square of 9 clearly shows that 8/18 is a date that has the same significance as 9/5 and 9/23.
218 is another cardinal number. 10/15/2014 + 218 gives 5/21; the high of NYSE.
Gann timing is magical; only scratching the surface.
P.s. The maximum value of the 9th ring is 361 (one full circle) or 19 squared. Degrees, time, price; it’s all the same.
Thanks for all the efforts Andre and Peter,
August 18/19 still has my attention to see a low but after that I think turbocycles will have a good chance to be on right site and we will move up .
18/19 August is also Mercurius latitude minimum.
Nice weekend..
John,
If 8/18 turns out to be a low, it will be up into 8/26 and down again into 9/4.
And could you please explain about Mercury latitude? I know of elongation, but can’t find a source for latitude.
Cheers,
André
Andre,
Just possible cit’s
Last one was Juli 26.. bottom index one day later Juli 27.
Andre , Thanks. As i told you over on that other site, you are way over my pay grade. I have read a lot of Gann’s material and understand what you are saying.So it is better i be the student and you the teacher , Thank you for your contribution . .. Nick
Of course my pleasure,
I Agree
Until now it has proven quiet succesful to take a good look at Mercurius maybe because it is so close to the sun and so tiny it causes the butterfly effect?
I look at Mercury Latitude cycle and Mercury maximum elongation cycle with the sun and conjunction both are on Time price research
http://time-price-research-astrofin.blogspot.nl/search?updated-max=2015-06-11T16:53:00-04:00&max-results=20&start=40&by-date=false
Good luck…
Guys,
Thanks for the awesome sharing of information. I still can only say that for me as a simple guy, 17/18 August should be a bottom… But looking at what most people are shouting (LONG LONG LONG), I should be very wrong. ^^
Well, we will know very shortly…
Cheers,
W
New post up. Short and sweet. There’s really not much to report.