
Update: Friday, June 8, 9:15 am ESt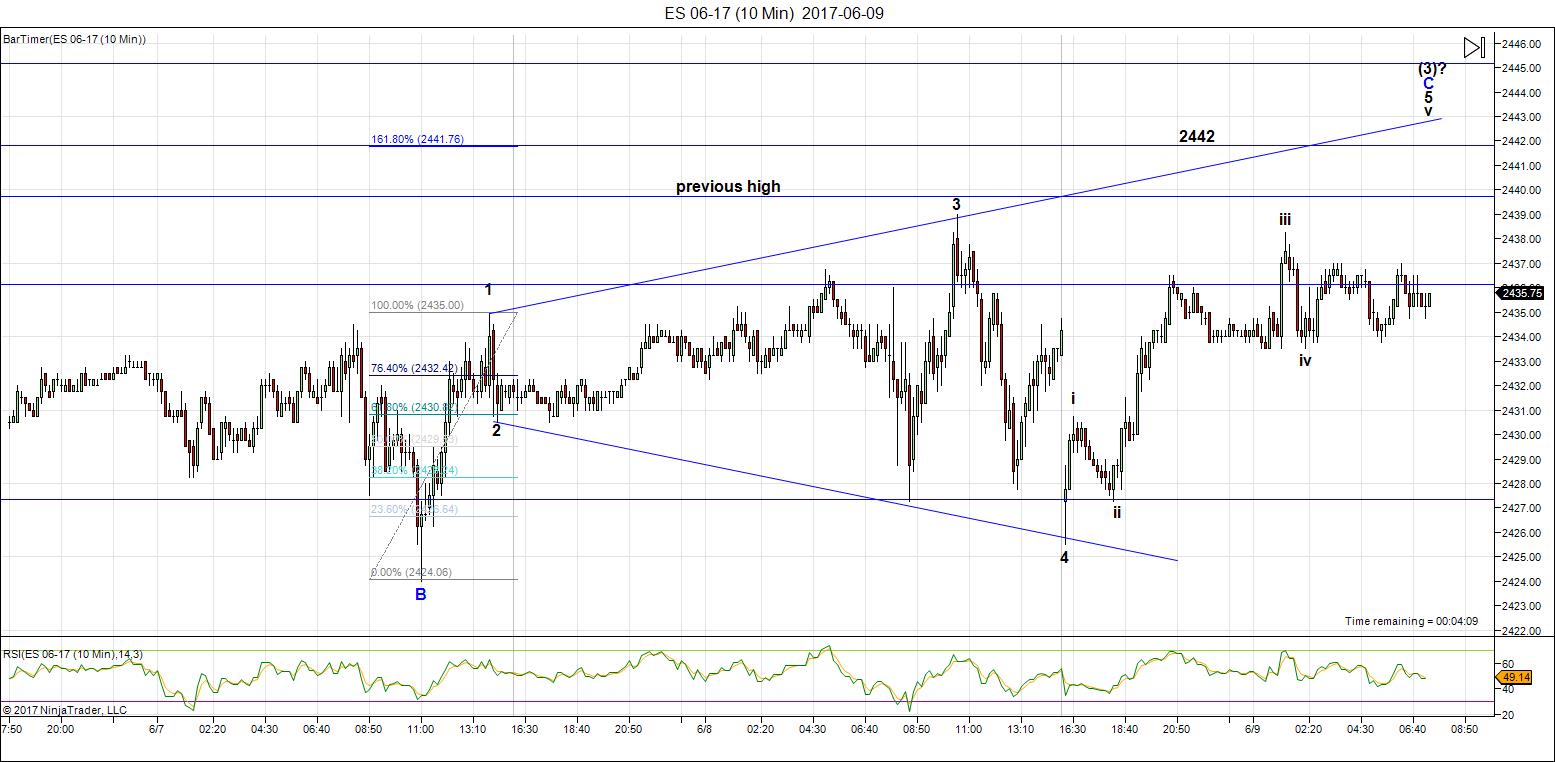
Above is the 10 minute chart of ES. I’m seeing an expanding ending diagonal (very rare). We’re looking for a top. I have a measured top at 2442. These patterns don’t do a throwover and sometimes don’t quite make it to the top trendline for the fifth wave, so somewhere in the 2442-3 area looks like it might indeed be the target.
However, based on what USDCAD just did (I got out frustrated two hours before the move!) and how far currencies still have to go, I’m leaning towards Monday morning for the turn. We’ll see what happens.
This is a really ugly market! Be careful if you’re in currencies particularly.
__________________
Market Update for Friday, June 9, 2017
Market Update for June 9, 2017  |
 |
Make sure you zoom the video to full size with frame expander (arrows) in the bottom right hand corner and also set the quality to as high as your web connection allows. This is an HD quality video so the best viewing is at that level. |
_______________________________
Market Update for Thursday, June 8, 2017
Market Update for June 8, 2017  |
|
Make sure you zoom the video to full size with frame expander (arrows) in the bottom right hand corner and also set the quality to as high as your web connection allows. This is an HD quality video so the best viewing is at that level. |
_______________________________
Market Update for Wednesday, June 7, 2017
CHART SHOW signup for Wednesday
Market Update for June 7, 2017  |
|
Make sure you zoom the video to full size with frame expander (arrows) in the bottom right hand corner and also set the quality to as high as your web connection allows. This is an HD quality video so the best viewing is at that level. |
_______________________________
Market Update for Tuesday, June 6, 2017
CHART SHOW signup for Wednesday
Market Update for June 6, 2017  |
|
Make sure you zoom the video to full size with frame expander (arrows) in the bottom right hand corner and also set the quality to as high as your web connection allows. This is an HD quality video so the best viewing is at that level. |
_______________________________
Update: Monday, June 5, 12:10 pm EST
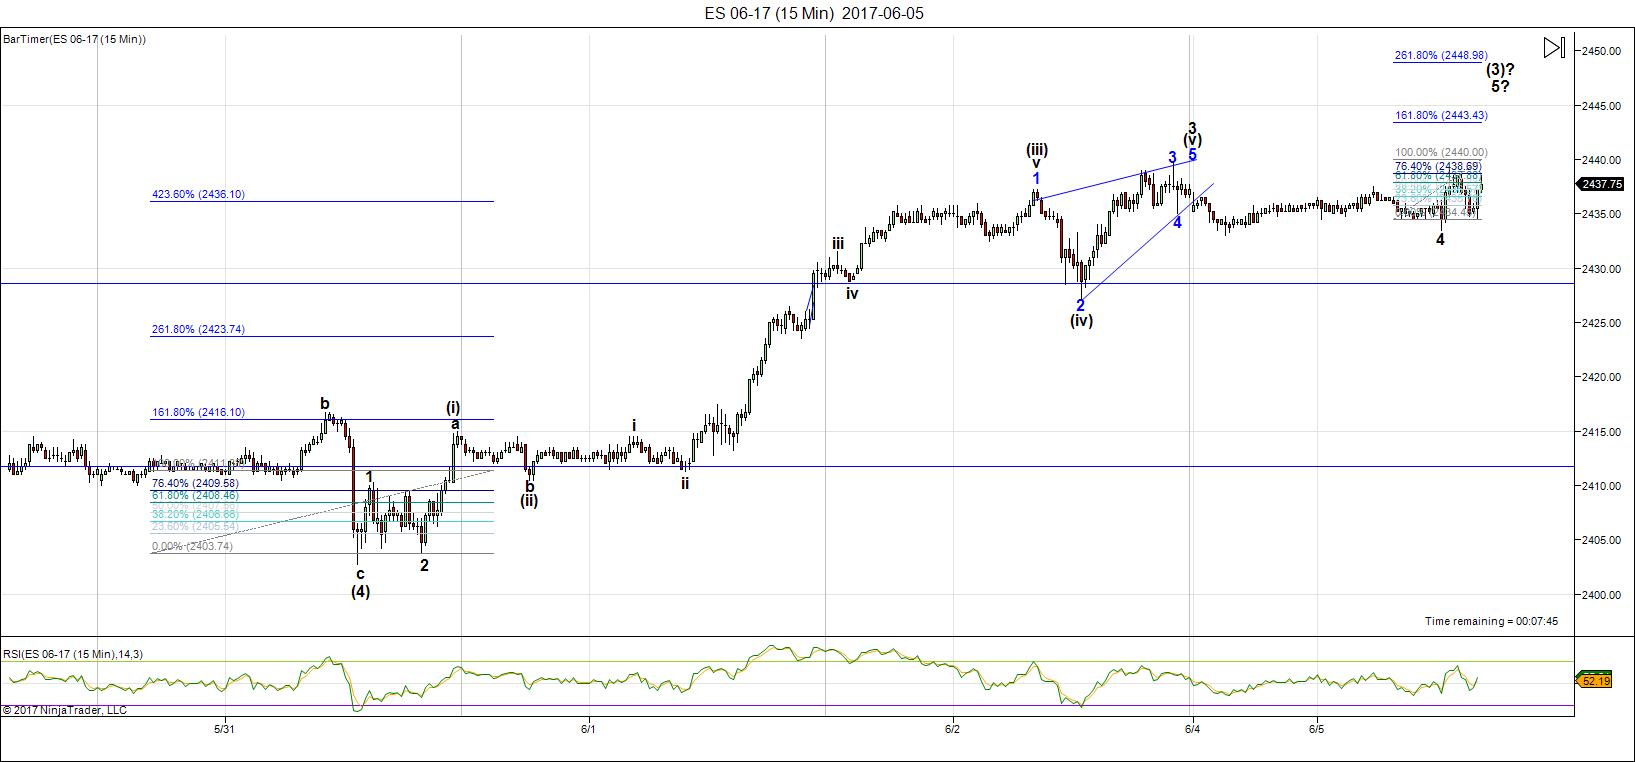
Above is the 15 minute chart of ES showing this final wave up. I’ve taken a different approach to its labelling this morning, by treating it as five waves. The labelling suggests that we’re in the final small 5th wave and that we’ve finished wave 1, 2, and are in the middle of wave 3 of 5 with a potential target of 2443.50 or so. After that, a small 4th and 5th.
As I stated on the weekend, USD currency pairs should reach their targets and the US market reaches it’s target. I still expect them to all turn in tandem.
_________________________
Ending Diagonals
“To begin with, diagonal triangles are very rare.” Robert Prechter, The Elliott Wave Theorist, August 5, 2009
Perhaps not as rare as he made out. Certainly not in the past year or so. Ending diagonals have been appearing with some frequency. We have a potential one at the hourly chart level and below, I’m showing one at the 5 minute level.
This weekend, the ending diagonal and larger structure has reached up to develop “a sharper point.” Ending diagonals are described as having an ending wave with no defined target as a top. I’m trying to determine whether there actually is a fibonacci guideline to determine a top but so far, do not have enough data to say so definitively. All I can do is provide the next obvious fib ratio and see whether we get a turn at that point.
But while the spiked top sharpens, there’s more to it than just the end of the ending diagonal at play here. There are larger forces at work and that’s what this weekend’s report is all about. A little more patience in needed, imho.
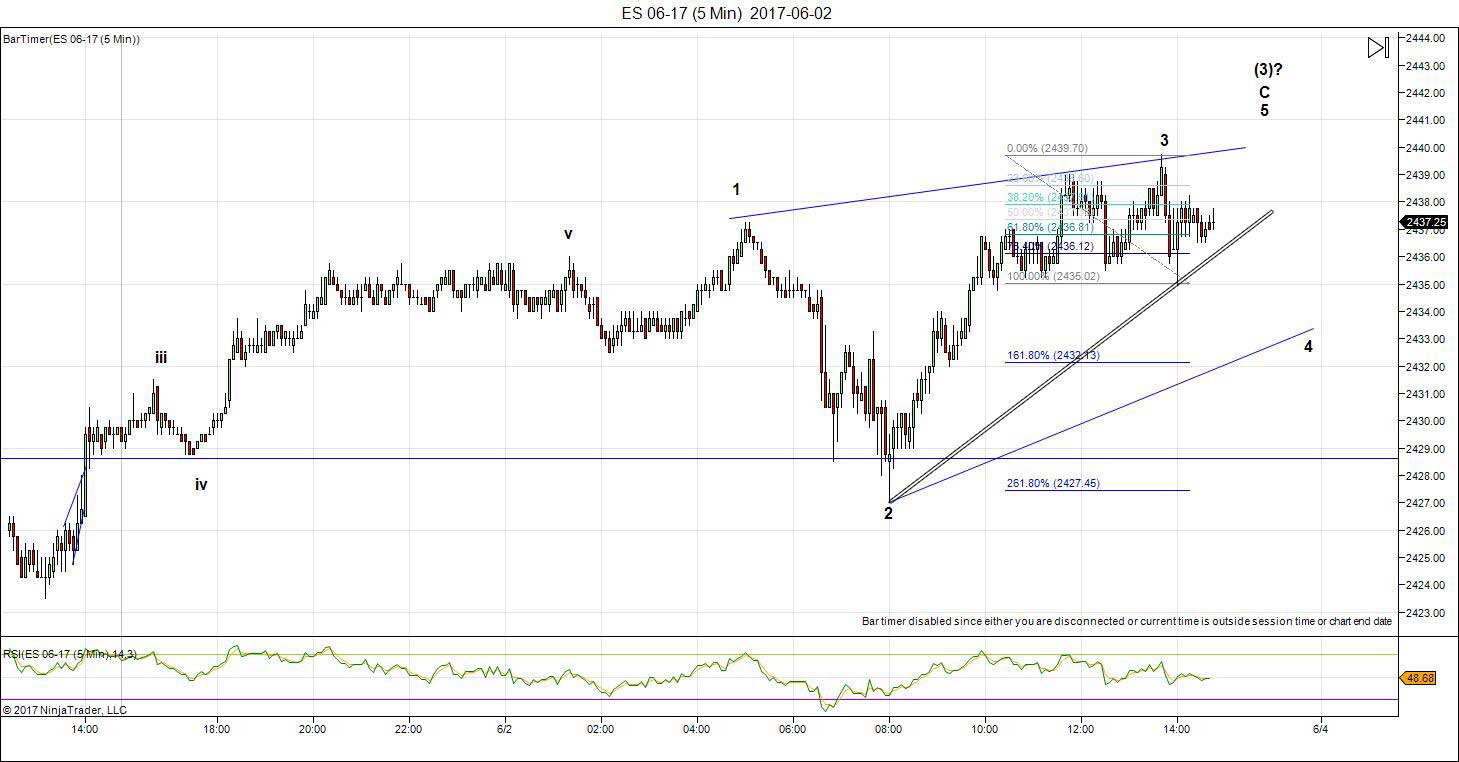
Above is the 5 minute chart of ES. Based upon the current positions of the USD currency pairs (close to their targets but not there yet), I think we have a few more days of levitation before we hit the fourth wave. All the USD currency pairs and the US dollar (of course) should turn at the same time. The bottom line is that we’re waiting for the dollar (you’ll find my long term projection for the dollar in the free blog post this weekend).
On a small scale (above), I’m expecting this ending diagonal to expand down to the lower trendline. Usually the third wave is very complex and the first tough of the trendline was what I had originally earmarked at the top of wave 3. I have since moved the digit 3 one top to the right and expecting, as a result, a much deeper fourth wave to perhaps somewhere around the level currency marked with a ‘4.’
I would expect Sunday to be slightly bearish and perhaps Monday through Tuesday to be bullish to complete this final leg up. But, in order for the larger turn down to occur, currency pairs must reach their targets outlined in today’s video and (in come cases) in the weekend longer term charts below.
A Higher Tide Floats All Boats
Last week, I summarized a very important aspect of this current top. I included the information in the free blog, and ended up getting a comment or two at the end of the week that were very sarcastic regarding the my target. They completely missed my point about the DOW and NYSE both having to reach new highs.
I have always maintained that once one index tops, they all have to (so that they stay in sync). I’ve not seen it fail yet.
But it’s more than this that keeps the SP500 from not topping until the others top. The next wave down will have to start with five waves. If you look at the charts of the DOW and NYSE from the previous week, it was very obvious that they were in fourth waves. The waves down were in threes; in fact, they wave structure was so “messy” that even an bad analyst would have to agree that there was no way they weren’t going to top before heading down in a larger fourth wave.
So, the key, as I preach over and over again, is to watch the entire market, certainly indices that are related to each other. Both the SPX and DOW are subsets of the NYSE. They move more or less together. The wave structures have to be correct in order for the next wave down to start.
This week, we completed this important step. We have one more to go: a major turn of just about everything associated with the US dollar.
All the Same Market
I’ve been mentioning for months now that the entire market is moving as one entity, the “all the same market” scenario, a phrase that Robert Prechter coined many years ago, when he projected the upcoming crash (although he and his group don’t seem to be paying much attention to it now …).
We’re starting to deleverage the enormous debt around the world. Central banks are losing the control they had and we’re slowly sinking into deflation world-wide, with Europe in the lead.
The US dollar is fully in charge of both the equities and currencies markets. They’re all moving in tandem, as I’ve been saying since September of 2015. For a short while, currencies were moving contra to the US market, but for the past several months or so, they’ve been moving together. The EURUSD is very closely aligned and will likely trace out a fourth wave as the SPX traces out one, too.
All the currency pairs will turn at the same time as the US indices for this fourth wave. Even Andy Pancholi has alluded to this, but he didn’t get the date correct. It is still to come. This is the final hurdle.
Rule of Alternation
The Rule of Alternation should play a part in the structure of wave 4. It affects waves 2 and 4 and states that if wave 2 is sharp and deep, wave 4 will be shallow and sideways, and vice versa. Wave 2 was a sideways wave and so I expect a sharp, deep wave 4. The timeframe may be a bit shorter than wave 2, but I’ve kept it the same in my projection, the dates of which you can find in the post from two weeks ago.
Wave 5 is typically 1.618 X the length of 1, so I’ve given it two extra weeks (I’m projecting 12 weeks). However, this is not a motive set of waves, so wave 5 may be shorter than this (it typically is in a non-motive 5th wave). It should not be extended, as wave 3 was extended and it would be extremely rare to have both extend. We may end up with an ending diagonal, since this is a final top in a corrective pattern. Ending diagonals appear 1) in motive 5th waves and 2) at the end of a C wave.
If we have a normal wave 5 is SPX (and a normal fourth wave, dropping to about 2250), then I project the final top at around SPX 2500.
Opportunities this Week
There are opportunities this week:
- ES/SPX (a big opportunity short, the wave down should last weeks)
- All the US Currency pairs are turning (almost there – everything will turn at once)
______________________________
Here’s the latest daily chart of ES (emini futures)
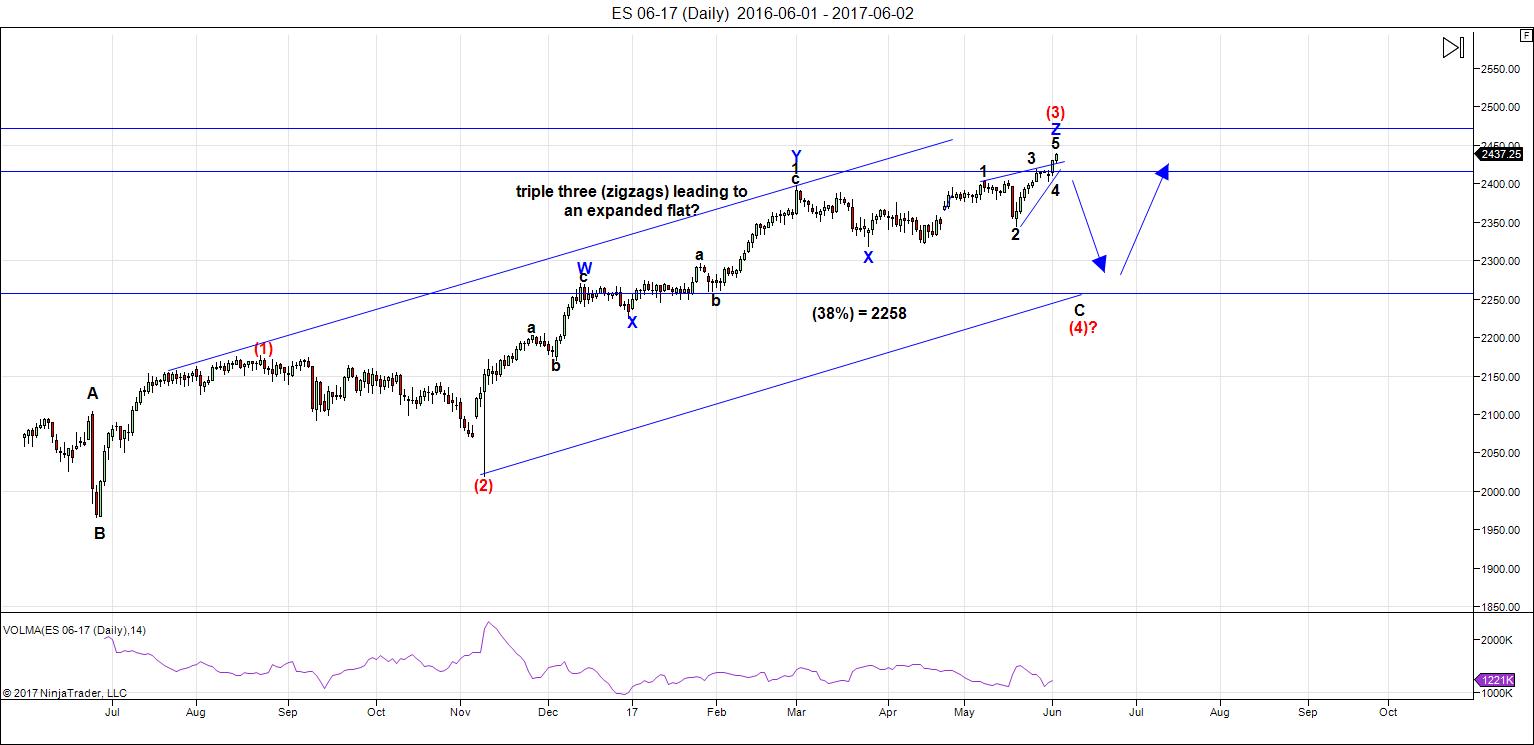
Above is the daily chart of ES (click to enlarge, as with any of my charts). The count has not changed appreciably. What appears to be a third zigzag of the third wave (you can only have three patterns within a corrective wave—this third pattern starts at blue X on the chart) has continued slightly higher and continues to build a potential very large expanded flat at the top of the circle red third wave. The top of this last wave has now formed what looks like an ending diagonal, and that is also very close to a top.
Last week, as I mentioned above, I warned that the DOW and NYSE still had to top. That step was completed this week. Now we’re waiting for the USD currency pairs to hit their targets. Everything is going to turn at the same time. It takes time to turn around an ocean liner.
Summary: We’re completing the third wave in ES with a possible expanded flat. Look* for a turn down this coming week.
After completing the larger fourth wave, we’ll have one more wave to go, which could be an ending diagonal as a fifth wave. The long awaited bear market is getting closer.
* When I use the words “look for,” it’s the same as “watch for,” as in “Watch for a tornado in the western plains area this afternoon. The conditions are right.” It doesn’t mean we’re going to have a tornado, but you should be on the alert, just in case we do. It applies to my call for this week, as well. The conditions are just about right for a turn. However, as I’ve stated above, the USD currencies must reach their targets as a pre-condition of the turn.
_______________________
Here’s the latest 60 MIN chart of ES (emini futures):
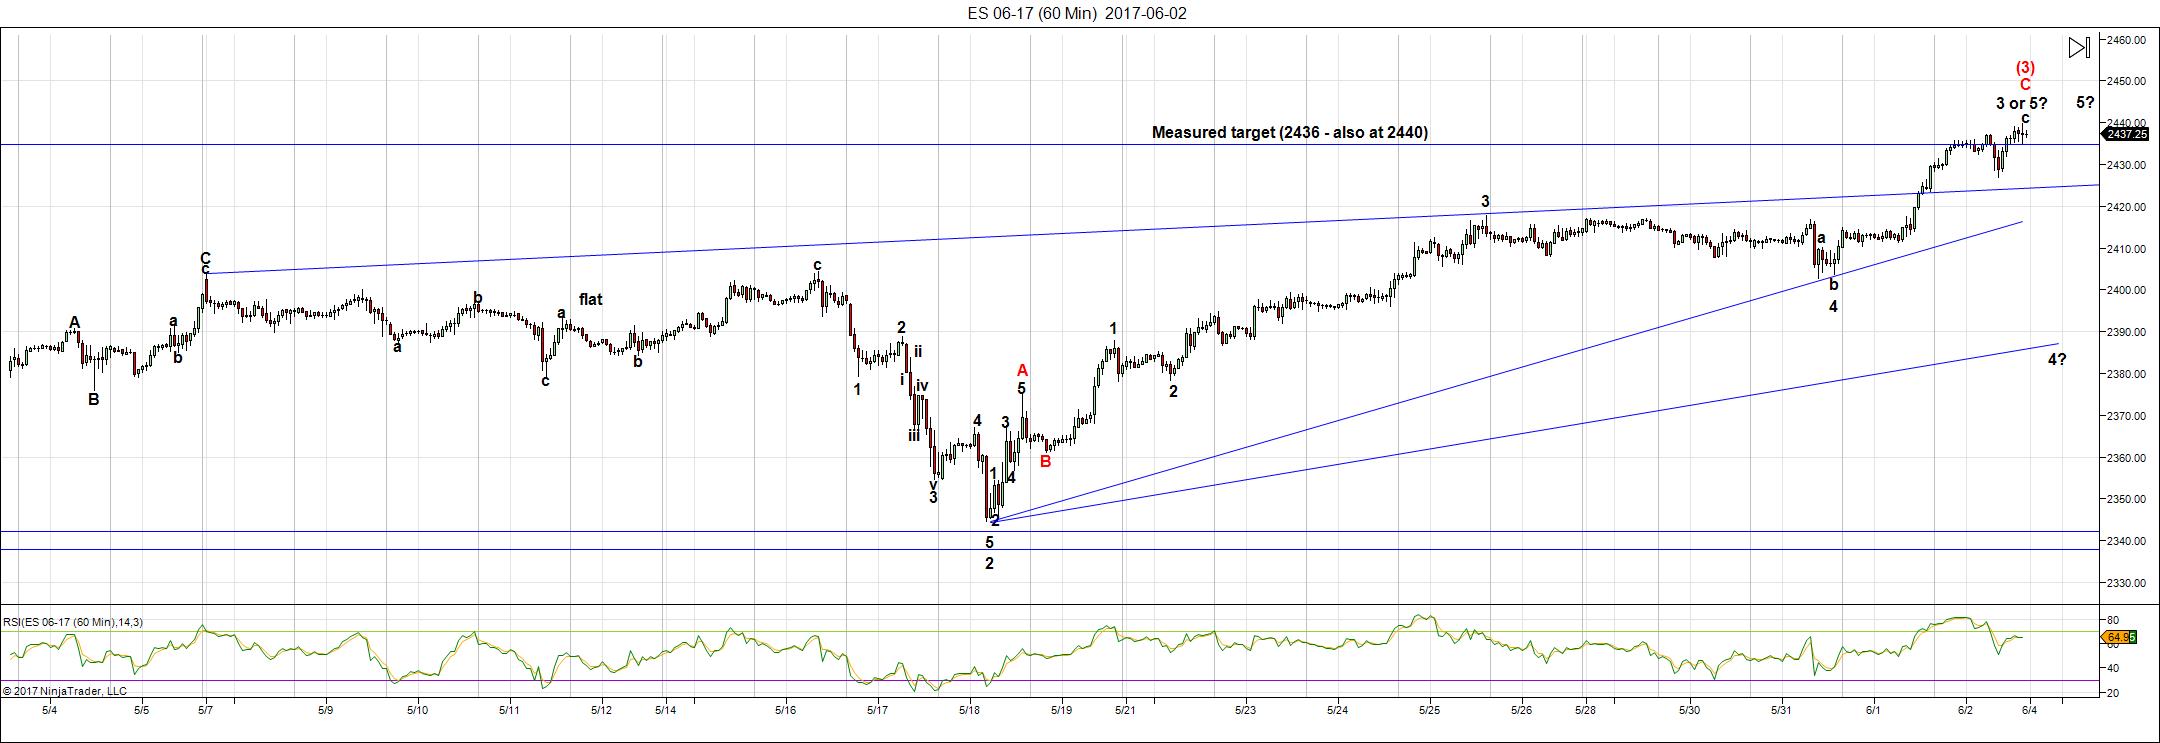
Above is the 60 minute chart of ES (click to enlarge). Please watch the video to get the full story on what’s happening short term.
I’ve pointed out the ending diagonal on the 5 minute chart. However, there’s potentially a larger one on the 60 minute chart. So, the question arises as to whether this larger ending diagonal could expand, similar to what I’ve outlined on the 5 minute chart above. It could, and this would be a much larger move, of course. I don’t have the answer. We’ll have to wait and see.
At the same time, this structure on the 60 minute chart may not be an ending diagonal at all. We already have, and have had for some time, a potential flat forming. More specifically, this is a potential expanded flat. That means that when it’s ready, we could see a very sharp and dramatic turn down. We may not have any warning in the US market, but we should in the currency pairs—that’s why it’s so important to watch them and why I’m alluded to there position several times here and in the free blog.
Andy’s turn date for SPX is Saturday (next weekend) but there’s a EURUSD turn date for June 7/8 and since everything is likely going to turn together, my attention is on the earlier date.
_____________________________
Some housekeeping:
The Projected Timeline for a Top is in the Forum now (click here)
Andy Pancholi Turn Dates (June, 2017)
- SP500: June Sa10, Th22*
- EURUSD: Jun W7/Th8, M12, Th22*
* denotes major
New Free Blog Post: Elliott Wave: Probable Cause
The CHART SHOW signup is live for Wednesday, June 1 AT 1pm EST. You can sign up now in the usual spot: webinars.
________________________
Here’s a video overview of the market for Monday, June 5, 2017
Market Report for June 5, 2017  |
|
Make sure you zoom the video to full size with frame expander (arrows) in the bottom right hand corner and also set the quality to as high as your web connection allows. This is an HD quality video so the best viewing is at that level. |
_______________________________
Charts Going into Monday

Above is the 2 hour chart of SP500. As with ES, we’re at the top of the third wave. As I said last weekend, this final wave up is a zigzag and the C wave of this zigzag should play out in 5 waves—it has. As per my prognosis for ES, this structure needs a turn down and then another turn up. The fifth wave of an ending diagonal must be in three waves and so far, it looks like a “one.” So we need a small bc to end it off.
We have an Andy Pancholi projected turn date for the EURUSD on Tuesday/Wednesday, so perhaps both the EURUSD and the SP500 will turn on that date.
The rest is in the video, and virtually the same as my prognosis for ES (above).
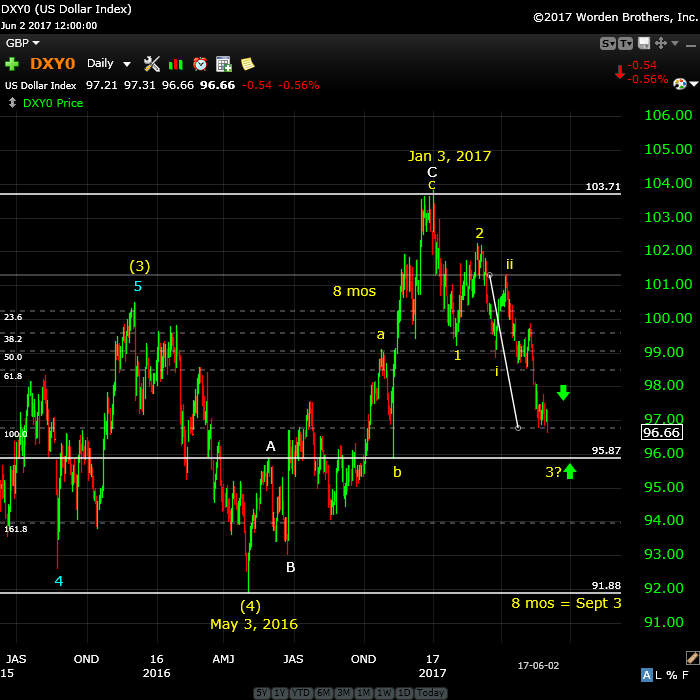
Above is the daily chart of the US Dollar. No change here in terms of my long term prediction—we’re heading down to the 91.88 low.
On a near term basis, we’re now quite obviously in the third wave of this downward thrust. We got a small wave 4 retrace (I was expecting a little bit deeper, but I think it’s done). Now, I’m expecting a continuation down to about 95.87 to complete the third wave. Then we should get a larger 4th wave turn up.
Note that we’re about half-way down to our target now and we’ve travelled for about four months of the projected eight month wave to the final target (~91.88). At this rate we’ll hit our target in September, as previously predicted. EURUSD is following a similar path in the opposite direction.
The movement of the dollar determines the movement of just about everything else these days. The longer term target for the entire wave down is 91.88.
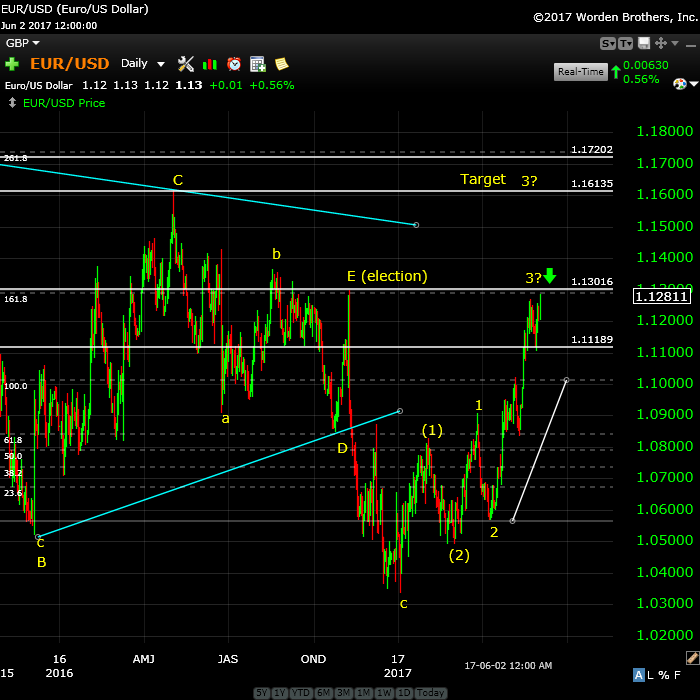
Above is the daily chart of EURUSD. The bigger picture is that we’re headed up towards a target of 1.16 (and change) before we get a really major turn down (a fifth wave).
On a short term basis, we’ve completed 5 waves up in the most recent wave. However, the subwaves don’t yet look complete and we may head up a little higher to the 1.13 area before turning down in either a larger fourth wave. That would put the US indices, EURUSD and US dollar in sync, as I’ve been predicting for the past year and a half. The larger trend remains up.
More in the video, of course.

Above is the daily chart of USDCAD. We’ve continued down in what so far is an ABC correction. I get more specific in the video. My preference is still for a double top, or a retrace the the 62% retracement level (horizontal line on the chart at about 1.3838). I expect it will take place as ES/SPX heads down in the fourth wave.
On a short term basis, it looks like we’ve reached the downside target (1.33836), which is the point where wave C is 1.618 X wave A. We then bounced to the previous 4th wave area. I’m expecting a double bottom here. If by chance we drop to a new low, that would mean we’re completed five waves down. At that point, we would need a second wave retrace to 62% of the full wave down. However, my preference is the for the double bottom.
The high (whether the current one remains in place or not) should mark the turn into to a multi-month wave down to 1.19. I would expect the turn to coincide with that of AUDUSD, as they usually move together. It may also coincide with the end of wave three in the US market.

Above is the weekly chart of the AUDUSD. I’ve changed the short-term prediction for this currency pair.
I got called out on this chart by one of my subscribers and on second look, he was right to question it. The ultimate outcome is the same, but it doesn’t make sense for the current pattern to be a bullish triangle.
I’ve re-labelled it as an A wave up with a very complicated B wave that may drop to either .71452 (the previous wave B low as market on the chart) or .708 (an extension fib measurement of the very small ‘a’ subwave (not shown—it’s too small) of the blue AB wave on the chart). This also makes sense as I would expect a larger drop when the US market movers into the 4th wave down.

Above is the daily chart of GBPUSD. I’ve been expecting a fourth wave for the past two weeks or so and it’s finally taken hold. The longer term direction is up, but this correction may be a larger one still.
GBPUSD has seemed to be moving independently of everything else but it appears to be molding into fourth wave in conjunction with other pairs. Expect more downside; however, the larger move is to the upside. I expect the move up to continue to at least 1.34457 (a previous smaller 4th wave).
More information on the short term prognosis in the video.
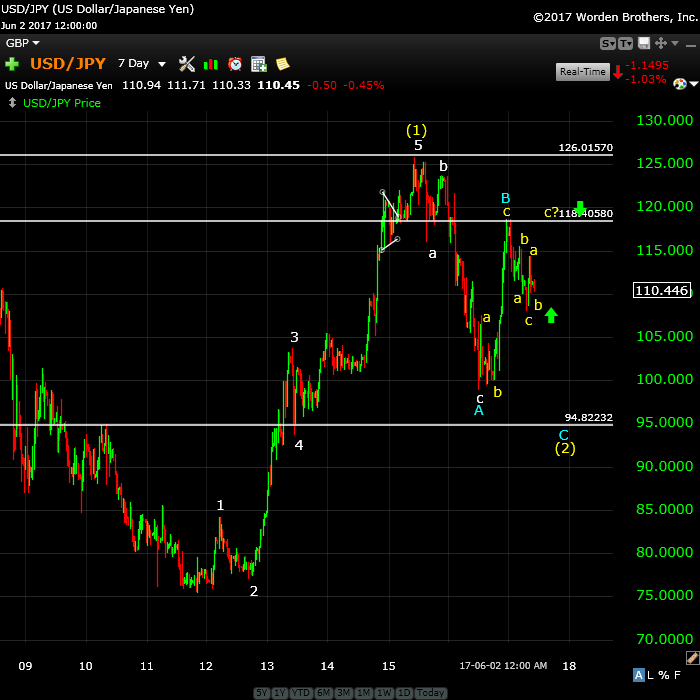
Above is the 7 day chart of USDJPY. We continue to flirt with a top here. The upside target I have is at least 114.5, and could go as high as 118.4. That’s because the wave down is in 3 waves. More on this in the video.
Once we hit the upside target, I expect a turn down to about 98.75.
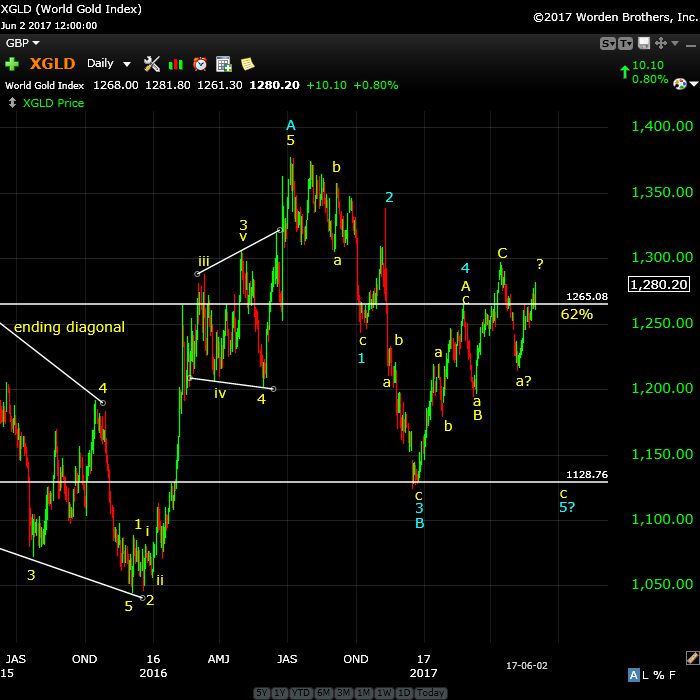
Above is the daily chart of gold. I’ve been saying lately that I don’t like what this asset is doing. I’m now expecting a new high. It can certainly spike to a new high, but the waves up will still be in 3’s, so the longer term projection is for another wave down. Silver may only retrace to 62% and if it does, this would help us time a top in gold.
Logic would project a move up as the US indices move down it the projected fourth wave.
So be on guard for a further move up, but I still believe the larger trend to still be down.
When we reach our target, we’ll turn back up. The final upside target is around 1585.
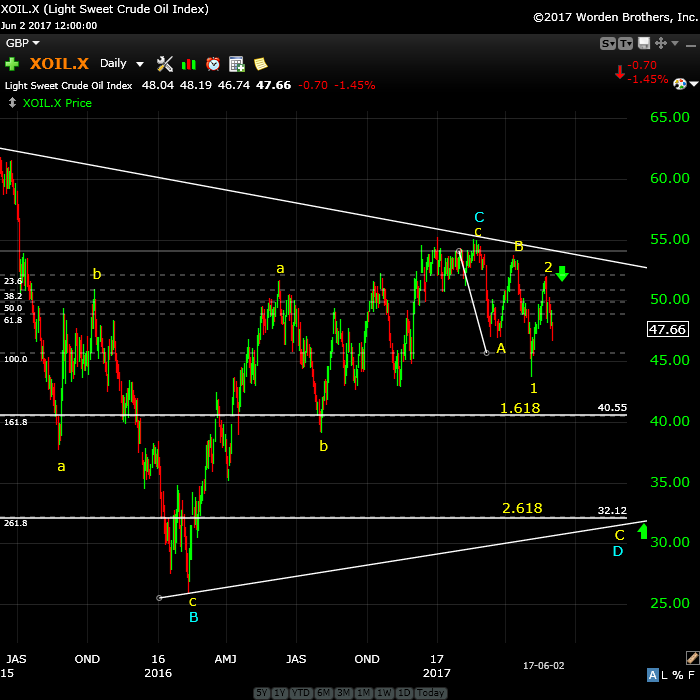
Above is the daily chart of WTI oil. The direction continues to be down. Not much more to say here.
The longer-term target is around 32.00.
Finally, we should get an E wave up to the upper trendline to complete the larger pattern. That would be followed by a final 5th wave down to a new all time low.
Good trading!
_______________________


The new blog post is live: https://worldcyclesinstitute.com/a-sharper-point/
The free blog post is also live. The link is in the Trader’s blog post.
Peter do you have a timeframe in mind for oil to reach $32. Just from a trading perspective I’m trying to figure out the best way to short oil without paying continued overnight charges. Wave C took a year so I’d expect wave D to be less considering markets drop sharper than they rise. Maybe $32 oil will coincide with the US market top lasted this year.
No surprises today. We look like we’re going to grind away in the US indices for a day or two before topping.
EURUSD came down in three waves and I’m expecting a double top to warn of the top in the US market.
I was short ES overnight and got out this morning. I’m short USDCAD this morning (as about the only thing out there I’d be even remotely interested in) and expect it to double bottom at about 1.33878 or thereabouts and also signal a top in the US market.
Silver hit 61.8% & Gold is/was up against a major multi-year downtrend line. Logic says down, but I’m staying out in the hope that I’m wrong and they go up with ES dropping down hard.
Well, it’s interesting that so far, gold and silver have been running in tandem with the US market, and I’d have to guess that’s because of the US dollar, which is running counter. So the dollar is running counter to gold, which is likely the larger influence. The waves up in both gold an silver are corrective (4 hour chart) and my gut tells me we’re going to see a double top on gold and silver will turn at 62. Remains to be seen. Would look for 5 down and 3 up on a 5 minute chart.
I posted a chart of ES showing progress (or lack thereof). I changed the labelling in an attempt to find a potential target for the top. We are in the final 5th wave and I’m relying on currency pairs to signal the impending turn.
The Market Update for Tuesday is live at the top of the post.
Part 2 of “300 Years of Lies” is live on the landing page of the site.
feels like 300 years of trading in past few months. hate the wait
Kurt,
Yeah, I know … I put a bunch of books on the top of my screen, in hopes that helps.
🙂
In ES, we have three waves down. This is just a slightly larger fourth wave. Expect a new high.
I have a feeling the gold wavecount may need to be adjusted. I expect gold to break well above $1300 if this expected drop in US markets happens considering we are at a double top already.
I expect the opposite, actually. Having spent some time with the gold and US dollar chart over the past 24 hours, they’re been moving counter to each other since they both turned at the beginning of the year (Dec/Jan). Gold should turn down as the dollar turns up, if that continues to be the case. The dollar is now also moving counter to the US indices. I’m going to cover in the chart show this week.
The Market Update for Wednesday is live at the top of the post.
The Chart Show playback in now live at https://worldcyclesinstitute.com/june-7-2017/
The Market Update for Thursday is live at the top of the post. I went through gold and silver in detail today in the Chart Show.
The Market Update for Friday is live at the top of the post.
Once ES/SPX gets to new high, where’s the best short entry after 5 down and 3 up?
As it turns back down at the top of the wave up in 3.
Peter,
GBPUSD have turned as expected by you to current 1.265.
From EW rule , can the ES turn before putting up a new high>2400?
Are there any chances where it turns before that as currencies like Yen have also turned as expected by you.
Qwerty,
Thank you for your input.
ES needs to get to a new high, but that’s all. GBP next stop is 1.25195. If it finds that point, we’re likely going to see a much larger C wave up from that turn.
If GBP crosses into wave 1 territory I think we might head to the bottom again and it’s close to that so beware.
USDCAD. There’s a chance it has turned and it heading up now. The wave structure has become very muddy. I want to see the next move. It’s not heading down and the waves down are in 3’s, so I would leave it alone.
Any thoughts on USDCAD road it up and back down? Barrier triangle still or no seems like we broke through barrier.
It looks more like it’s trying to be an ending diagonal. If would need a bit bigger fourth wave for that. I still think it needs to bottom out at the previous low 1.33852 or so. It’s been a really tough pair to figure out lately. So volatile.
Hi Peter
Is this the next big wave down in gold and silver
As I’ve been saying, if you get three waves up to around 62%, it very likely is.
It looks like 5 waves down forming in gold … still a little early to be sure.
Took a pioneer entry on it near 1295 & had the third wave correctly measured to 1271.20. Exited since I wasn’t sure from there. Will wait for this to finish out and re-enter trade properly. Waiting impatiently for SPX to finish it’s business.
Good for you. ES today possibly, but I think we’ll have to wait until Monday.
Watching intently to see if we get a top this morning in ES. We’re at what I would consider to be a probable target.
Correct me if I’m wrong, but I see three up in ES with the top of the third now at a 161.8% extension of the first. Does that mean we are looking for a short wave 4 pullback and final run to the top?
Could happen shortly if this is right. SPX is only $4 away from your target.
Forgot — my “version” of ES is the SPX cash contract in my Forex account, so #s may be different. I noticed it’s usually $2 or so higher than SPX and your ES numbers.
Although I labelled that last wave as a 5 in my haste, it’s really a zigzag, which would need a tiny 4/5. If it goes much beyond where we are now, something other than an ending diagonal may be happening.
SPX target from what I recall was 2446.14. We hit 2446.20. Close enough or is another wave up in the works?
Yeah, my final upside target was 2446 in ES, as well.
We should get a fourth but the fifth may not get much above where we are. I’m watching NQ which has completed a double top. It looks like it needs one more wave up to test the previous high … .at the least.
NQ is at a double top.
Peter,
ES just hit your target 2443.5
Vince
We are in the area. Now all we need is a big time reversal this afternoon!
NQ is tanking … a very good sign.
NQ is red. Maybe a sign of things to come.
Gold making more sense. A 61.8% retrace from here would send it up to the long-term downtrend line from 2011, where it would turn down again.
Looks like a full 5 waves down in NQ to the previous 4th, so should get a second wave in NQ. ES still looks like the top is not quite in.
A lot of individual Tech stocks are starting to get slammed. If it persists, it will carry into other indices.
NQ is extending, so it looks like ES is about done now, too.
ES should come down to 2426 to complete a first wave before a bounce. That’s the previous 4th at the moment.
Peter, does it look like ES is in a small wave ii now?
4th wave.
Thanks. So theoretically we can count 5 down now on the 15 minute
Yes, although not complete. So technically the top is in, but that’s doubly certain due to NQ … wow. I got short a while ago in NQ.
SPX will likely get to 2425 today. That’s previous 4th and where I might expect a second wave bounce. Usually in Friday drops, we see the second wave over the weekend.
Agree. Would love to see a weak close today. Still 2.5 hours to go and a lot can happen
Peter, when this 1st wave completes, what % retracement you think we will have? 62?
yes
It looks to me like we’ll do the usual finish the first wave at the end of the day and then do the 62% second wave on the weekend. You don’t want to be in SPX over the weekend if that bounce concerns you.
At the same time, if you’re not in the SPX or ES, etc, Monday morning with a bounce to around 62% should be an excellent point for a short.
Where does wave 1 stop? lol. And the NDX is getting crushed. That’s what I call turning the corner with a Bang!
There’s SPX at the target (or almost). I’ve exited futures, waiting for the bounce.
Amazing the ES contract has already re-traced 50% of the down move
In ES, this may be only part of the first wave. Looks like we have more to come. We’ve stopped in an odd place. So this could be the larger 4th wave we’re at the top of now.
So it may make sense to stay in over the weekend. I’m leaning that way at the moment. I’m short ES again at this higher level, although it’s not a second wave.
Target for ES, more like 2403, I think.
Peter,
Just to clarify for SPX , you are expecting a bounce in SPX on Monday right? I don’t trade futures so I cant follow you on futures.
And the best time to short is during that Monday bounce right?
Vincent,
My more recent comments are that I think this bounce is a fourth wave, which means more downside before we get a second wave. If that’s the case, we’d likely continue down on Sunday, open down, and then Monday we work our wave back up in a second wave.
The issue is that this wave down in ES went past a smaller 4th, but it not far enough to really consider bottomed. It ended in the middle of nowhere, which would be unusual. I’ll have more in the blog on the weekend once I’ve had a chance to review everything.
Confusing, but tending to lean this way as well. Naz only retracted 38.2%, the DOW retraced more than 61.8% and SPX 50%.
What’s interesting is Gold has not retraced and the banking sector (was watching GS) stayed green. Makes me think a few people know what the Fed will do next week — sending currencies to our targets and SPX down.
I wouldn’t rule out the possibility of a very slow grid in the indexes on Monday with a drop after the Fed on Wed. Who knows, I am short near the top on ES & closed most of it out in the 2425 area, was waiting to add back in on a retrace. Will see what it does over the weekend. Shorted the Dow on the retrace up, now concerned it may not have even topped. Weird movements correlating the 3.
I see all of that, but the one thing that has the market pointing down is that the waves up from the low today are all overlapping. The second thing is that the Nasdaq, which should always lead, is also pointing down in a big way.
I’ll be in front of my screen at 6pm Sunday for sure
Peter,
what is the lowest point to which the spx could drop and hold the wave 4 corrective count? thanks
Technically, in SPX, it can go down to 2200. It can’t go into the area of the first wave and it’s just below that level. Typically, it’s going to retrace somewhere around 38%, which in SPX, is about 2271.
The blog post for the weekend is now live: https://worldcyclesinstitute.com/fourth-wave-getting-a-grip/