
Irrational Euphoria is in its Dying Stages
 The herd is still irrationally euphoric about prospects for the future, mostly based upon propaganda of one type of another. There’s also the fact that as long as they’ve been alive, the “nanny state” has always provided for them, as we all live well beyond our means and go further and further into debt.
That’s not going to change quickly; in fact, there will be many still “believing in Santa Claus” well past the halfway point in the ongoing crash to the bottom: I’m talking a couple of years from now.
At the top of these 500 year cycles, the state is fully in charge; the greater good of the state wins out. You can see this in the quashing of free speech, something that has always happened at the tops of 500 hundred year cycles. However, as we turn colder and dryer and the market crashes, you’ll find the individual becomes the focus, the revolution explodes internationally and, in the long term, authoritarianism begins to fail and democracy and free speech gain traction again.
It’s a pendulum that slowly swings back and forth over very long periods of time, always in a similar manner. Civil wars will erupt across the world, chaos will reign, but in the end, society will evolve once again into a better world as it has done time after time.
Tough times ahead, for sure, but it’s important to keep your eyes (and more importantly, your mind) on the bigger picture.
We’re getting closer and closer to the top of this market; we’re a lot closer than many believe. In fact, most are completely oblivious to what’s about to take place; they’ll be the biggest losers.
In terms of the market, there’s quite a bit of uncertainty short term, but the longer term picture is clear. All the wave patterns will play out. The US dollar, gold and silver, oil, and the US market (as well as indices around will world) will top at the same time. It’s always important to play attention to the different major asset classes, as together, they give a better sense of where we are in the bigger picture.
An Short-Term Overview of the Asset Classes I Cover
The big picture of where the market is going is clear. We’re closer than many think to a top in the US indices, the US dollar is at a short-term high, gold and silver are close to a low, and oil is starting to trace out its final pattern that will lead to a long-term top. It’s the short-term picture that’s in question in currencies, and that has an influence on the just about everything else. Here are my general thoughts on the overall short-term direction:
US Dollar and Currency Pairs: The uncertainty is focussed around the US dollar. We’re in the process of a turn but we’re “mid-wave,” meaning that we could turn either way. However, my preference is that we’ve topped and we’re in the middle of a first wave down. This week should tell us whether that’s the correct “read” of the current wave structure.
The US dollar affects all the USD currency pairs, of course. USDCAD and USDJPY look like they have short-term weakness ahead before heading up, which should mean the AUD, EUR, and GBP head up from here.
US Indices: We’re looking at move downside to finish a fourth wave and then a turn up to finish a 5th wave, which will end the large B wave and lead to a turn down in a multi-week C wave.
Gold and Silver: Both these assets have more downside before then turn up in a multi-week rally. They should mirror the movement of the US indices.
WTI Oil: Oil is at an inflection point; however, the rally from Friday is so far in three waves. I’m expecting weakness leading in to the beginning of the week before a turn up in to a second wave.
This is an overview only. I cover the specifics of each of these asset classes in the weekly Chart Show (sign up at the bottom of this blog post) and in nightly videos for my Trader’s Gold subscribers.
The Australian Dollar—Book Covers Sometimes Lie
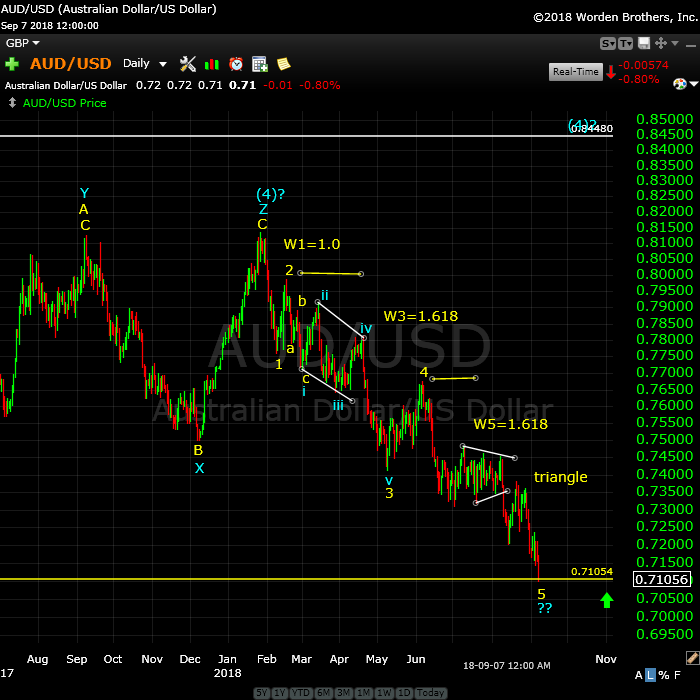
Above is the daily chart of AUDUSD. This is a really interesting study in the application of the Elliott Wave Principle. While on the surface, this wave looks impulsive, I’m not so sure. In fact, I’m calling it corrective until the imminent rally tells me I’m wrong.
First of all, we’re at an inflection point. A turn to the upside is imminent. Both fibonacci measurements and the wave structure tell us that. How far up we’re going depends on whether this wave down is impulsive, or not. Here are the arguments:
Impulsive:
- the larger wave count shows five waves to the downside.
- the wavelengths of yellow waves 1, 3, and 5 are exactly what they should be for an impulsive wave (shown as percentages on the chart)
Corrective:
- wave yellow 1 down looks to me to be a ‘3’
- wave yellow three, which should contain 5 impulsive looking waves does not (this is an EW rule) — identified by the blue i, ii, iii, iv, v sequence
- wave yellow 2 to the downside has a wave structure that looks like a ‘3’ (identified by abc labelling on the chart)
- wave yellow 5 has too many waves (ie- it is not impulsive-looking)
- the entire corrective structure has not retraced 38%, which is usually required, imho (this is not an EW rule … so far)
Therefore, I’m forced to classify this wave as corrective. However, if I’m incorrect, it will only retrace to the .774 area
This is a good example of the process I use when trying to identify the real structure of waves that are questionable. This one is borderline. Most analysts won’t go to the lengths I go to in determining the outcome; they’ll see five waves and instantly label it impulsive, without looking at subwaves. You have to look at subwaves to figure out whether an impulsive wave fits all the rules. If it doesn’t, it’s corrective.
Silver
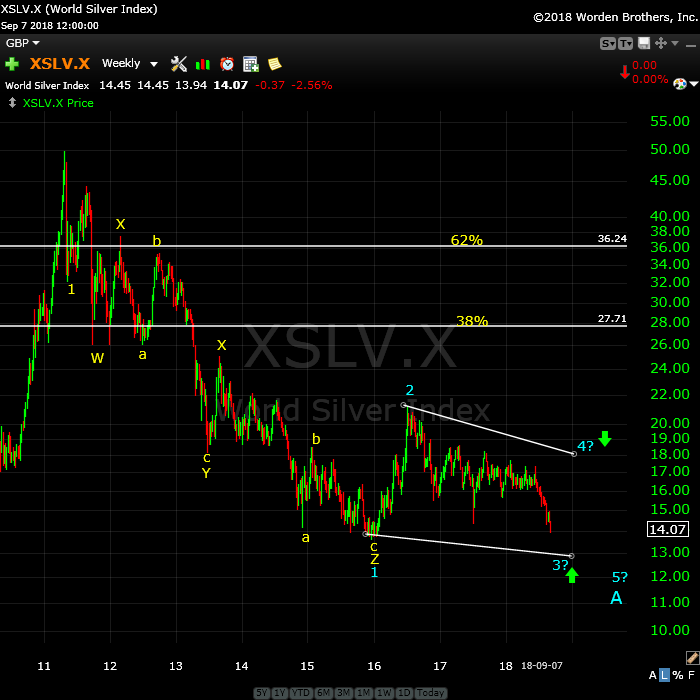
Above is the weekly chart of Silver. Kyle had asked for the long term picture and targets during the most recent Chart Show, so since I don’t cover it directly, I decided to create this chart and share it here.
Silver looks to be in an ending diagonal. If this is so, then we’re looking for the completion of the third wave with a bit more downside. To be complete, it must drop to a new low (below 13.62). Then it will turn suddenly and head up in a fourth wave (I would expect this to happen when the US indices top in the current B wave). Finally, it will complete a fifth wave to the downside (when the fifth wave in the US indices reaches a top?).
Longer term, once the US indices finally top and head into the bear market, silver should rise to either the 38% or 62% level, shown by the horizontal lines on the chart.
This is similar to the prognosis for gold, except that silver is much weaker overall. I can’t be any more specific than this for downside targets, as ending diagonals don’t adhere reliably to fibonacci wave lengths, in my experience.
______________________________
Elliott Wave Basics
There are two types of Elliott wave patterns:
- Motive (or impulsive waves) which are “trend” waves.
- Corrective waves, which are “counter trend” waves.
Motive waves contain five distinct waves that move the market forward in a trend. Counter trend waves are in 3 waves and simply correct the trend.
All these patterns move at what we call multiple degrees of trend (in other words, the market is fractal, meaning there are smaller series of waves that move in the same patterns within the larger patterns). The keys to analyzing Elliott waves is being able to recognize the patterns and the “degree” of trend (or countertrend) that you’re working within.
Impulsive (motive) waves move in very distinct and reliable patterns of five waves. Subwaves of motive waves measure out to specific lengths (fibonacci ratios) very accurately. Motive waves are the easiest waves to trade. You find them in a trending market.
Waves 1, 3, and 5 of a motive wave pattern each contain 5 impulsive subwaves. Waves 2 and 4 are countertrend waves and move in 3 waves.
Countertrend waves move in 3 waves and always retrace to their start eventually. Counrtertrend (corrective waves) are typically in patterns — for example, a triangle, flat, or zigzag. Waves within those patterns can be difficult to predict, but the patterns themselves are very predictable.
Fibonacci ratios run all through the market. They determine the lengths of waves and provide entry and exit points. These measurements are really accurate in trending markets, but more difficult to identify in corrective markets (we’ve been in a corrective market in all the asset classes I cover since 2009).
To use Elliott wave analysis accurately, you must be able to recognize the difference between a trend wave (motive) and a countertrend wave (corrective). There’s very much more to proper Elliott wave analysis, but this gives you the basics.
____________________________
Registration for Commenting
Want to comment? You need to be logged in to comment. You can register here.
If you register, it protects your information. It also allows you to comment without filling in your information each time. Once you’re registered, simply go to the home page and click on the login link top right in order to log yourself in. Usually, you’ll be logged in for several days before needing to be logged in again.
______________________________
Problem receiving blog comment emails? Try whitelisting the address. More info.
______________________________
A true expert in Elliott Wave FL 2
A true expert in Elliott Wave …You are a true expert in EW analysis. What you provide is not available anywhere and is priceless. Subscription on your services is the best thing I have ever done. Many thanks for your effort to make me a better investor. I now have more trust in my investment decisions. I hope you will continue the excellent work! —FL |
Tops in your field DZ 2
Tops in your field …You are tops in your field. Tried to follow Elliot Wave international for years. They were always behind the market. After discovering you, I perceive that you are an expert in reading the waves, which puts you way ahead of the rest of your peers. And you can read the Waves like you are reading tomorrow’s financial section. I pray you stay healthy. —DZ |
Couldn’t be happier … KK 2
Couldn’t be happier …The analysis and insight you provide is simply amazing! I’ve been trading the futures and equity markets for well over thirty years and usually average around 5% monthly. Since joining your Traders Gold Service two months ago, that number has better than doubled. I couldn’t be happier.—KK |
Rise above the rest … SM 2
Rise above the rest …I have only ever met a few people who, in their chosen fields (astrology, medicine, music, martial arts, technical analysis), rise above all the rest and you are one of them…you have ‘the gift’…and that’s why I’m a Trader’s Gold member. —SM |
the real deal SM 2
The real deal …‘Educational, insightful and thorough market analysis for all levels of traders. It’s Elliott Wave at its best….Peter Temple is the real deal’ —SM |
The best of them JL 2
The best of them …Last couple of years, I subscribed to several ‘market traders’. You are by far the best of them and the personal contact is awesome. Daily and daily updates are very well written! Besides your expertise in EW, I also like your cycles analysis. Best investment I ever made! —JL |
Get an upper hand … JC 2
Get an upper hand in trading …Seeing all the different currency pairs and the wave structures and hearing you explain why this has to do that on a nightly bases gives one a upper hand when trading. Elliott Wave applies to all stock and indices and can be applied to any candlestick chart. If someone ask what you want for Christmas – Tell them a membership to Peter’s “Traders Gold!”—JC |
Have not had a losing week RW 2
Have not had a losing week …I have been with Peter almost a year. The only thing that matters is have I made money with his service. I think I have finally turned the corner using Peter’s EW. I have not had a losing week in the last 5 months. Thanks Peter, for your amazing amount of hard work. —RW |
The Market This Week
Here's the latest daily chart of ES (emini futures)
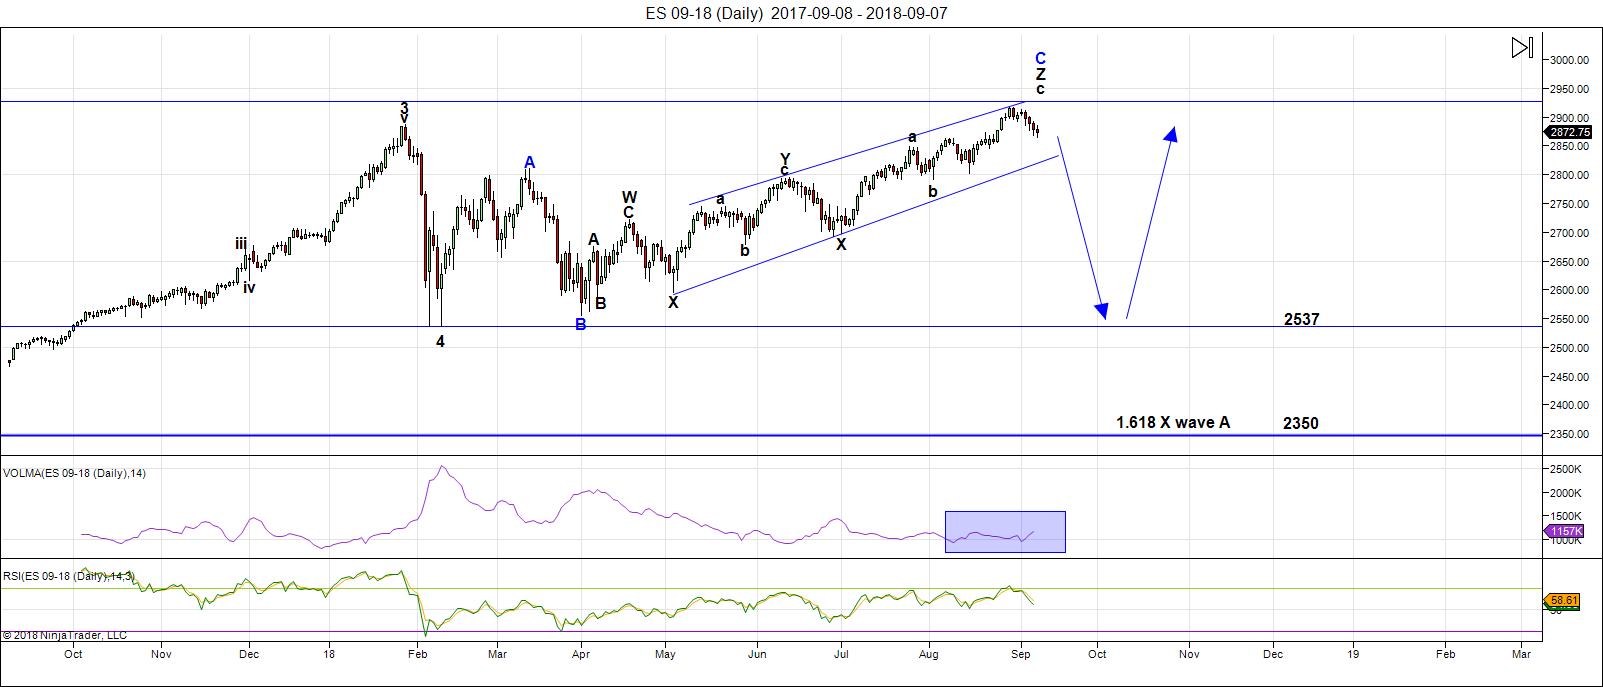
Above is the daily chart of ES (click to enlarge, as with any of my charts).
No change from last week. We're still waiting for the fifth of the fifth wave to a minimal new high before a turn down in the long-awaited C wave of a flat pattern.
My preference is for this unfolding fourth wave pattern is that of a expanded flat. However, technically, it could also be a running flat. At the present time, the B wave (that's the ABC wave up from about 2532) is longer than the A wave (marked as the 4th wave down from January 29, 2018). A regular flat registers as an expanded flat when the B wave is over 105% of the length of the A wave—ie, the B wave would need to reach above 2889, which is has done.
That means that the ES/SPX has multiple possibilities as to a target on the downside. Accuracy (in determining the most probable target) is going to depend upon both counting and measuring the waves to the downside. It's impossible to pick a downside target at this point in the process.
If we select all of wave 4 (on the chart—down from January 29) as the "A wave," then we're looking at an expanded flat. In that case, this outcome is the most probable:
- the C wave of a flat is typically 100 - 165% of the length of the A wave (so the target would be from 2532 - approx. 2360) - preliminary targets
There are other options:
- a running flat would trace out a C wave that is NOT longer than the A wave (in other words, it would not go to a new low). I regard this option as very low probability because it's extremely rare (I've only ever seen one of them). However, if NDX is tracing out a final impulsive pattern, its fourth wave should not be very deep, which may also restrict the length of the C wave in the SP500.
Volume: If you look at volume at the bottom of the chart, you'll see that it spikes up on selling and drops to nothing as the market rallies—a sure sign a top is nearby.
Summary: We're waiting for a top in a B wave, which will result in a C wave to a new low. My preference is that this structure represents an expanded flat, but there are other options. Once the c wave (down) is complete, expect a final fifth wave to a new high. That fifth wave up to a new high will be the end of the 500 year bull market.
___________________________
Trader's Gold Subscribers get a comprehensive view of the market, including hourly (and even smaller timeframes, when appropriate) on a daily basis. They also receive updates through the comments area. I provide only the daily timeframe for the free blog, as a "snapshot" of where the market currently trades and the next move on a weekly basis.
______________________________________
Sign up for: The Chart Show
Next Date: Wednesday, September 19 at 5:00 pm EST (US market time)

The Chart Show is a one hour webinar in which Peter Temple provides the Elliott Wave analysis in real time for the US market, gold, silver, oil, major USD currency pairs, and more. You won't find a more accurate or comprehensive market prediction anywhere for this price.
Get caught up on the market from an Elliott Wave perspective. You’ll also get Andy Pancholi cycle turn dates for the SP500 for the balance of the current month. There’ll be a Q&A session during and at the end of the webinar and the possibility (depending on time) of taking requests.
All registrants will receive the video playback of the webinar, so even if you miss it, you’ll be sent the full video replay within about an hour of its conclusion.


Really informative update. Thanks!
Thanks for update Peter
Peter
Quick question not market related .
How do you like the ninja trader platform ? I’ve heard mixed reviews
so thought I’d ask your thoughts . Do you find it stable and reliable ?
Do you use it for trading real time ?
Joe
Joe,
I’m not a big fan. It works from a production perspective—easy for me to get futures charts into videos and blog posts. I primarily work on a Mac for everything other than trading, so moving charts back and forth over the two platforms (Mac/PC) can be difficult and some trading platforms aren’t as efficient as others in that regard. I haven’t found the perfect solution.
I actually prefer Medved trader as a charting program. My trading is done with interactivebrokers (they have crappy charts, but a good alert system). So I tend to use somewhat of a hybrid system, different programs for different needs. It all works together somehow over 2 computers and six screens. But I wouldn’t promote ninja as the best solution for charting.
Thank you SIR PETER for all the work you put in..this is a most pleasant update. It is a good projection with a very solid count. I agree with your analysis that B wave goes higher but EW always seems to know the how but not the when. However..I do think B wave may go much higher then everyone is expecting..my target for B wave is 3020 with Dow at new high around 26.7K..then C wave hits your 2790 target with a shallow C to match shallow NQ drop..then SPX takes off like a bat out of hell..for the 5th and final wave in euphoric rise..all the way into 2019..and possibly beginning of 2020 to a target of 3500 to 4K. Dow possibly hits 40k by that point. Thats whats what im seeing thru my lenses. Keep up great work SIR PETER!
Very interesting lenses Sir Charles!
I will agree with you on one item.
A failure of the next wave down to demolish the 2800 pivot, and do so decisively, will make me seriously revisit the near term bearish outlook.
My expectation is that pivot will not hold on the next impulsive move down, and that will be the initial signal that the market is going a LOT lower.
Thank you SIR CHARLES for your interesting comment. For the more likely outcome of the market please refer to Peter’s analysis above.
310 years ago
300 years is .618 of 500 .
I think this article adds to what Peter has been writing
Since I began reading on this site .
It’s worth the read as we begin the fall and enter the winter months .
https://www.nationalgeographic.com/archaeology-and-history/magazine/2017/01-02/1709-deep-freeze-europe-winter/
Peter
Thanks for the info , I have been debating software for a while now
And was thinking of ninja yet the mixed results has kept me away , your
Thoughts just adds to it . Medved I’ll look into .
The computer I put together about a year ago with Windows 10 has some
Issue which has delayed me on programming. I’m still using my old computer
Yet Windows 10 in my opinion is not the future . I’ve debated Mac and while I’m going
To give Windows 10 one last attempt to redeem itself I think longer term that
Linux is the way to go.
So, on Thursday in Calgary, we’ll have a high of 6 degrees (42° F). The overnight low will be below freezing. Sept 13. All our trees are turning, which is quite early. Winter is coming!
What you’re referring to was part of the Maunder Minimum. We’re going back there. https://en.wikipedia.org/wiki/Maunder_Minimum
Lol! I guess the bunglers over at EWI are blaming their incompetence on “just a few stocks” being responsible for the new market highs which they “did not expect”. Oh really now?
How about having the WRONG COUNT???
What a bunch of CLOWNS!!!
I really feel badly for anyone trading on their useless predictions. I wonder how many accounts they have blown up with their garbage analysis over the years…..
I have seen the phrase often here – “There needs to be euphoria before the market tops”. Does anyone have a good objective measure of euphoria ? I remember 2007 pretty well – and there was no euphoria then. Housing market euphoria had peaked in 2006. There was nothing but concern around subprime and Adjusting rate securities as SPX made new all time highs. 2000 was a little different as markets all peaked in March 2000. The reason I keep going back to treasury yields is because that is the only market signal that topped well before the market (at the same time as peak euphoria). To me, as long as yields are making new highs, I will assume stocks can keep making new highs. Once that changes, I will be on the look out for a market top. This has been the case since mid 1980s. As of now, I am sticking with the idea that we are in a dis-inflationary world, and hence treasury rates will signal euphoria better than stock prices. For people looking for “euphoria” I would love to hear if they have an objective measure (as a testable subjective measure) that can be back-tested successfully on the various crashes we have seen since 1987. If not, then its a classic wall street phrase given as a reason when no good ones can be found – most people resorting to that will likely miss out on the first turn of markets.
It is definitely an expression thrown around by folk I consider propagandists for the most part, to argue that we have a perpetual bull market. It really quite remarkable how often that mantra is repeated with no specific explanation as to what exactly that means. Can one get more euphoric than a parabolic rise? In case folk forgot, that is what we saw last January!
Fellas..the last 5 years before top of 2000 crash was marked with a meteoric rise of over 140%..much more in technology. The last 5 years of the 2008 crash stocks took off by over 75%..much more in real estate. In comparison the last 5 years of the current rally barely eclipses 50%. This one IMO will go out like 2000. I reckon yall will see another 30 to 40% rise from current SPX levels up to 3750 possibly 4K before all is said and done. JMO
Charles do you believe in Peters prognosis for a crash below 666 S&P eventually? I know you have more bullish targets for the end of bull market.
With FED removing liquidity from the market and no volume?
Have looked at the % of stocks trading below their 200 day SMA lately?
While I do expect an eventual resumption of Q.E. as the CBs all panic, I think that will come only after the first wave down and result in a deep second wave, at which time, enough of the herd would have awaken to the danger and go..
“Uh, uh!!” 😁
If SIR PETERs count is correct then the C wave drop should come soon to finish 4th wave..then the euphoric final 5th should start its dog and pony show..based on wave 3..it could last 12-18 months..in line with my estimation that crash takes place in 2020. Top of 5th wave SPX measurement could extend to 4k. Right now..capital still flowing into U.S. of A..and that should continue for a couple years IMO.
Charles,
That’s not a very likely assumption from MY count, so you’re getting it from somewhere else. I have the NYSE and related indices in a B wave, which means this is the fourth wave of a final zigzag. The Nasdaq is already in the 5th of the 5th wave of an impulsive pattern, so it’s pretty close to done. And there’s no volume. I won’t go into all the other asset classes, but they don’t support a blow-off.
Thank you SIR PETER..my question is this then..based on my below comment on alternate count..is there any possibility that SPX could also be in 5th wave? Or is NQ just that far ahead?
I wouldn’t necessarily call NDX “ahead.” The wave structure are different. NDX still has an up/down wave pattern ahead of it, as does the NYSE, imho. I think I’m all “explained out” as to why NYSE is not in a fifth wave (and of course, S&P can’t be if mother isn’t).
Now one caveat I must add by method of addition..in an alternate count..if SPX heading into 4th of the 5th Wave then top of market may only be around 3020-3100.
I just published an interview I did with Dave Dubyne (ADAPT2030) earlier this year on the landing page of the site: https://worldcyclesinstitute.com/what-to-expect-moving-into-2025/
Fed is fighting inflation currently..how say you..deflation coming? Oil prices heading to $100-$150 per barrel. Isnt that inflationary too?
Yep! You got it! 🙂
Yes..im planning for best case..spx at 3k or higher..but have stops in @ 2790. Just added to my calls on dip at EOD and shorted volatility. Rock on fellas!
If you are shorting volatility, you should take another look at the chart.
Just shorting the spikes for a few pips
A lot of traders miss the very best gains in the market by missing the big picture, and critical market turns.
The case for a coming deflationary depression is water-tight if you have done your homework. While it would take far more space that practicable to give a thorough discourse on the reasons, just think in broad terms of the size of global dollar-denominated debt. The global economic slowdown, already underway if you simply look at what is going on with global, and particularly emerging markets, is as plain as the nose on one’s face. Even the great engine of global growth, China, is in a whole lot of hurt that is going to get much worse, trade deal or no trade deal. Their export demand based economy is unsustainable in the face of flagging global demand. Period.
What do you think is going to happen when defaults on all that dollar denominated debt begins to implode? Puerto Rico was just the beginning.
Yep! A scarcity of dollars, which WILL inevitably lead to a rising dollar, which will inevitably lead to DEFLATION.
Anyone telling you that inflation is coming and you need to structure your trading and investing thesis on that outcome simply have not done their homework and don’t know what they are talking about.
That is deflation in a nutshell! 🙂
I mean in short-term..its inflation first IMO then when market tops next year or 2020..I agree on deflation..but I see that as way down the road. Just my 2 pennies.. I trade trends and EW waves..along with scalping.
Looking like another market gift..to buy the dip. The market that keeps on giving..yes I will be adding some calls at the open. Thank you Mr Market!
SPX is now falling in a waterfall formation. The decision point for this formation (purely based on an average of similar patterns historically fitted since 1987) comes in another 3 trading days. Purely based on trendlines, the level would be around 2835 on ES on 9/14. In 23% of the cases after that, the market drops pretty hard for 3-6 days afterwards. In rest of the cases, it bounces and fully retraces the previous move. I know that Joe and Williem have mentioned 9/18 as a potential date. Then we also have 9/24. I really do not see any reason to buy this market right now. I don’t mind waiting till the end of the week. If my historical pattern continues to hold, we will be another 1% lower by then, but with muted volatility. If we have already finished wave “B”, then next week, we get fireworks.
Im buying EVERY dip. Free money IMO. Bought todays dip and looking good..as usual. No bears left. Only like 18% bears and 60% bulls..the math works out for us bulls.
Up 50% on my calls!
Not sure why bears keep waiting for a drop..there will be a brief pullback and then back off to the rodeo. So many bears miss opportunity trying to time the market. This is a bull market and yet i know so many traders who have missed it because they were bearish and stayed on sidelines..worse yet many actually lost money because they shorted a rising market..thats foolish IMO. I know we will have a C wave down..but until confirmation its in place Im as bullish as one can be.
Well – as they say – bulls make money, bears make money. I was comfortably bullish from 2600 to 2800. I will be comfortably bullish either after a pull back or a clean break of 2900-2950 area. This is the zone along with the month (September) that has me extremely cautious. I do not care of focus on 0.5% swings. They are a distraction for me. If you can make money on those, then more power to you. I have found focusing on 5-10% moves more useful. I try and put risk on once I have good probability one way or another. I try to be bullish 75% of the time (because the market goes up 75% of the time). It is very rare for someone to be permanently bullish or bearish.
Good wisdom there..I do much of the same. Bet my long term money on trends i see and scalp on day trades. Im prob bullish more like 90% of time and when i see confirmed downtrend get bearish..but that doesnt happen very often like you said. I just know there have been a ton of perma bears who has missed hundreds of points calling tops over and over again. This one is going to at least 3k before the next drop IMO.
Yep. Markets in a very fragile state as number of stocks trading below 200 say SMA continue to rise. The lion’s share of the advance in many indiced has been narrowly focused in a very few stocks. The waterfall decline you describe is exactly what one would expect on any breakdown of those leaders.
I am long volatility and 50% short equities. I will be closing out a few more profitable trades at the open.
I bought 287 calls at open and they doubled..wash..rinse..repeat.
Lol! Sold some of my positions at the open so the banksters and BTF dippers could give me some cheaper puts. Right on schedule! 😊
Also shorted VXX at open. Almost up $1!
Woo hoo…gidee on up. We gonna reclaim 2900 then 3k next for SPX
I nailed 150 pips on a Dow long today too. Still have my Dow long at 26050 and that should be a extremely difficulty barrier for the bulls to breach. Maybe I need to increase my long stake for the market to drop 5% and ill do that to make sure S&P 3k is not reached on this leg up if required.
I used this pop to short ES @ 2891. Will use 2905 as a stop.
Get ready to get stopped out..youre on wrong side of market.
Don’t mind being stopped out. That’s part of the process. As long as people are honest with their forecast and claims. Those who claim to be right all the time are mostly crooks. I recall a few bulls stop posting for weeks after the January drop earlier this year. Those are the pretenders.
I agree with you..thats why i tell what im doing ahead of time..and update when ive been right or wrong. Most of my buy on dips have worked..but a few days it hasnt but that comes with territory.
Maybe not Sir Charles. ES clearly back-testing former support and I think the man is gonna make some COIN!! Hehe!
BTW, smart to set your stop a bit higher than the 2894 pivot. The banksters and market maker clowns know a lot so stops are set right there and will probably run stops with a brief intra-day move past it. We know how they roll!! 🙂
Cashed out VXX puts for 40% gain.
Charles i found the article about you recently. https://www.marketwatch.com/story/xiv-trader-ive-lost-4-million-3-years-of-work-and-other-peoples-money-2018-02-06
Lol! You laugh but I don’t typically hold them overnight. Im a daytrader and typically cash out after 25-300% option moves.
Nice trade! Thanks for the cheap calls guys! 🙂
Wow! I am scooping VIX calls as fast as I get my hot little hands on them at these fire sale prices!
Just scooped some VIX calls. Let’s see how that plays out
You fellas are cray cray..hardy har ha..but I do love your determinedness. Im on the opposite side. May the best man win.
I have to agree with your approach Sir Charles. Profits not taken early and often in this market can disappear quicker than you can saw Wazzat?!!
My Diamond 260 calls I sold for 3.35 this morning now trading at 2.40 bid. I’ve got a “stink bid” at 2.10 to reload. Rinse and repeat.
I am am snagging VIX calls on any move under 14 and VXX under 30.
Today’s move down is very clearly leveraged shorting and I will happily take the other side of that trade very day and twice on Sunday..lol! 🙂
Thanks Mr. Verne. I like your approach too. You seem to know your stuff. 🙂
Markets will eventually get that leg down the bear have been waiting for..but i like to strike while iron is hot and keep my profits rolling. Even when i stop out..im usually so far ahead that a few losers working against me is ok.. then when trend change is confirmed i go the opposite way!
So far as the wave cont goes, it looks to me like we need a C wave down to complete a fourth wave. Maybe I should have grabbed those diamond puts at 2.40.
On the other hand, I suspect I will get an even cheaper opportunity. You’ve gotta strike while the anvil is hot, so to speak! 🙂
Im still thinking nyse & dow hit new highs before this major leg down. My target time line is nov mid term elections. i think demoncrats getting control will spook markets. Im mostly long stocks..short vol..til Nov or 2790 on spx..whichever comes 1st.
Shorted volatility into close for long term trend trade. This market is going up..up..and away.
Glad you’re already sitting on some nice profits. Do mind your stops! 🙂
Looking like another day to buy the dip. This has been such a sweet..sweet market. One that goes down for a min or two.. always rebounds. Like McDs..im lovin it! Adding vol puts and spy calls @ open or once I see bottom on this dip. Just wishin it twas a bigger dip for mo profits.
Made 50% on first dip n rally. Looking for next pullback. Closed Vix trade out +25%. Looking for another spike to short. Easy money folks!
SPX moved only 6 points on the first move. Are you telling me you have a way of making 50% on a 6 point move – let alone the idea that anyone can catch the full move on any time frame. And then, when you are wrong, its only 20% !! I hope you understand why it sounds ridiculous. If you do have a way to do it, then you are wasting your time. Start a hedge fund.
Buy same day ATM calls sir. 5 points is 50 cents on spy. Thats what I took
Big money was on larger dip. Bought calls at .27 and sold at .67
I dont lose often as the bolinger bands have been near perfect. Using dollar cost average i can mitigate losses.
For example i will sometimes buy at $1, .75, .50 and .25 in equal lots for avg of .62 so if theres a bounce my loss is not as great as my starting lot which was $1.
It can be done with same week expiration contracts. If you can trade bigger lots ( 50-100 contracts), you can make some serious intra-day coin. Most traders cannot pull it off. You need a rules based system that is repeatable and when I asked him, Sir Charles told us exactly how he does it. Not too many traders will share their methodology. More power to him!
Yes Mr Verne. My system is entirely rules based..no emotion. Will do up to five lots on one buy signal and will dollar cost and wait for bounce. If said bounce doesn’t manifest within a couple hours or its a clear down day I set my stops tight. My fav chart is 5-min and just wait for trade to come to me using bolinger bands. Buy the dips..sell the dips. It works more than eighty percent of time. The twenty im wrong average loss is 20-40%.
On my short I mentioned here yesterday that was set @ 2891 with a 2905 stop, I am moving my stop down to 2896. All of us have different ways of investing. Hopefully we can all learn from each other.
I like your short leash. This is still a very bullish market..you couldnt pay me to short it.
The shorting of volatility we saw yesterday was clearly executed with extreme leverage. They are going to have to double down or unwind. Gap up on 5 min suggests the latter.
DJIA divergence this morning offered yet another one-way shorting bet. Quick double on 160 strike puts snagged on that preposterous morning ramp….are you kidding me???!!!
Reloading DIA 260 puts. Amazing!! 🙂
I will take the other side of that trade..Mr Verne. New high for Dow ahead IMO
Banksters running the stops of weak hands on the short side. I think they will ramp it just past 2894. All sound and fury from the corrupt, criminal cabal… 😁
Im lovin these dips. Up over 100% on day
Hope you took quick profits…! 😉
Charles must be cleaning up big time. Intraday buy the dip seems the best strategy for now. EW bears around the world are scratching their heads…including me.
Yes bought calls today at .27 and sold at .67
Selling DIA puts for another quick double.
Maybe one more rip? 🙂
Is this legal??!! 😀
Scalping is fine for those of us with quick trigger fingers, as you can plainly see.
Having said that, it has been quite awhile since I have seen this market make its intention so clear and given traders so much time to get pre-positioned. Really remarkable!!
Like clockwork!
Another ramp into the close.
Trigger finger at the ready.
Will be executing on any move much above 26K.
Come on BTF dippers…you can do it! 🙂
Shorted volatility again and loaded up on more calls! This is free moola
Good for another 40% on 288.50 calls. Yes in one hour or less.
Come on guys…I need 26,075 at least to make it worth my while… 🙂
Should hit 26.7k soon IMO
We are very likely in some sort of B wave.
If so, we are going lower before we go higher.
Not sure what indicators you are watching but mine are on “SELL.”
I have NYSE and Dow making new highs in B wave before C wave begins. Targets are as follows fellas..
3020-25 on SPX..
26.7k on Dow..
13.7k on NYSE..
then a 5-8% pullback in C wave
Pullback probably in Nov..up until then
and bull market continuing through 2019
Oh well, you can’t always get, what you want!
Snagging more diamond puts but I am going out a few weeks. Man I hate buying premium when scalping! 😞
You mean to tell me a lousy few hundred contracts are producing red candles on the 1 minute??!!
Wusses!!! 😀
The long opportunity should come in the a.m. after the sharp c downn to complete the current minor degree correction imho.
I know Mr Verne..so many have been waiting for this C wave for months..until I see SIR PETERs 2790 on SPX im full on bullish riding this B wave as long as she goes. No one except me said Spx would hit new high. Thats what I traded. Im still waiting on NYSE and DOW to make marginal new highs then they all roll over together. IMO the 5th wave is where the non confirmations and divergences will really be unleashed. But as I said im of the minority that believes this bull market has anothe 1-3 years depending on when the C wave bottoms.
In this Q.E. fueled market (clearly central banks continue to buy!), anything is possible. Having said that, no bull market is sustainable with increasing numbers of stocks hitting 52 week lows, over those hitting new highs.
Yesterday witnessed someting unprecedented in market history, SEVEN consecutive Hindenburg Omens!
And while Sir Charles may indeed be the most bullish on this particular forum, the fact that VIX sits at 12.85 this morning shows that the herd’s perceptiion of market risk aligns very well with his. Be careful out there….
And vix heading down much lower IMO..under 10..and why i keep buying puts. My timeline is market up through Nov and then Nov elections will be where we get some volatility. Til then smooth sailing!
Move up iis corrective and will be fully retraced….just wait and see…:)
You are a master of the Dow. I will follow your moves from now until proven wrong. I added to the Dow long as we made new recent highs and stop at B/E on that. For the first time in my life i have gone long dow when its almost at a new record and its not gone wrong. My luck is changing i think.
Puts nicely in the green. Will sell to close at market out the gate manana.
See ya’all later….! 😉
Very rare gap higher in futures. My, the bulls are frksky!
Small B wave now has “right look”.
Does look like a full wave B. I got stopped on my short overnight. What this also means is that after we get a wave “C”, we should still expect new ATH. This is looking more and more like 2006. Multiple 2% declines just to get fully retraced.
I sold this rip again – but I am not expecting a big move lower – most likely a move down to 2850 and then another rally. Just stating what I can forecast using my methods. Likely low date is still 9/18 or 9/24.
Now you are seeing the power. Same day options can move 25-50% on just a 5 point move. Watch the bolinger bands on 5 min chart..and wait for extreme reading. I dont buy puts on extreme overbought unless its way overstretched and make a few points. Now just hoping for a bigger dip so I can add more calls. Thats been the money maker on this way up! You couldn’t pay me enough money to short this market unless it was a day trade.
I buying the dips and rips now like Charles. Whilst it makes money keep doing it. Apple is ripping higher too. My faith in a near term drop of any size is rapidly disappearing. Feels a bit like January but who cares if you have a stop loss.
I use 1 or 2 day contracts waiting for drop below bollinger bands..I try to go slightly in the money on spy. So if spy at 290.6..id use 290.50 calls. Then sell typically once it hits upper bollinger band. Typically get 5-25+ points. Thats usually 25-300% because when it moves in your favor you capture the majority of the move. Just dont get greedy!
I mistakenly posted this comment in a different area of Peter’s site.
https://worldcyclesinstitute.com/predictions-for-the-coming-business-cycle/comment-page-1/#comment-32476
Closed calls. I think maybe dip buyers may come in 11:20ish edt but I think next 2 days may just be choppy. Let’s see how it goes next Tuesday. Heading off for an early weekend. Good luck to those staying in their trades.
I deleted the other one for you.
Unless you don’t want me to and I can put it back.
Thank you Peter :). I can just post it here again. Comment last night, 9/12:
“Last month, swing low was a few days after New Moon and 3 trading days after perigree. Swing high was a few days after full moon.
Today is 3 TDs after perigree.”
For those of us who have followed Peter’s work or attended his chart shows, one thing we should have all learned by now is how to distinguish corrective and motive waves…or am I just mistaken about that??!! 🙂 🙂 🙂
Yea but until a wave changes course..motive or corrective..its still tradable. I only change strategy when a trend change has been confirmed..so far bulls still in charge and Dow only needs about 450 points or so..3 more days like today and its there!
It looks corrective to me for sure
I agree. Its definitely corrective but how high she goes is the question?
I went out two weeks on the puts I bought yesterday as I suspected the banksters might pull a stunt like they did this morning. I more than made up for those underwater puts with near term puts bought on this phony ramp this morning.
BOO-YAH!!!!! 😀
I added more oct and nov calls on todays little pullback and adding a large vol short on next spike.
My vix puts popped. Woo ya! Market agrees with me.
New low on UVXY!!! Yee haw..this bull is as fierce as ever. Funny how many analysts point to low volume in summer and said once traders got back from vacation market was really in trouble..NOPE it was the bears in trouble. SPX 3K..here we come!
Nice trade short vol. I keep adding on moves down. Yikes! 🙂
Yes thats a tough trade for you..hope you can get outta those soon! unless theres some sorta event..then vol going sub 10. Next little spike im adding several hundred contracts to my short volatility positions. VXX UVXY puts and SVXY calls..loading up the truck.
Reloading short term 261 DIA puts…l 🙂
Adding to DIA 262 puts….
Hope you are going out several months? 262 gonna be outta the money soon. My target is 267 for DIA by nov
Wanna bet?! 🙂 🙂 🙂
I dont normally bet..but i would wage money toward charity. If im right you donate and if im wrong i donate or something of that nature.
Challenge would be.. if dow hits new high by nov i win.. if not you win..
Woo hoo! Bulls still in control..just need a little pullback to reload. Big short coming up on vix and loading up on SPY calls.
Hehe! Boy are you in for a surprise! 🙂
Nope..market strong like bull. Hardy har ha. Made another 50% on the dip to 2900 back up to 2907. Added some Oct vol shorts. I have market up until Nov elections. When demoncrats gain control of House it will rock markets IMO.
Dip from Trump tariffs. Good chance to top up Charles. Hardy har ha.
Yes..Added some SPY 290 calls on this big dip. Boo yeah!
Calls were ripe for the picking if you jumped on. 290s were less than 0.50 now close to $1..so a double if you were quick to the trigger..and why Im buying EVERY dip til spx hits SIR PETERs 2790 target. May not be until Nov IMO
seems like this up since last weeks bottom is an ED c wave for a final top of B at 2924-37 for 50-61.8% the length of the a wave before it. It will also just test the underside of the bottom of the long term channel it fell out of when this 4th wave began at the end of January. Too pretty and perfect?
ps. would top on tue/ wed and keep in tact the pretty regular 2 week cycle that has persisted through the entire B wave. again, way too pretty but my favored count/scenario.
Adding spy 290s for another dip and rally
Sold 290 calls for 60% gain! Free money..fellas!
Added another boatload of new VIX 12 strike calls on move under 12. You simply do often get trading opportunities like this!!!!!
Amazing, considering what is about to happen, you could buy VIX under 12!!!!
I bought some more VIX puts on this dip!
Free money on calls and volatility puts. No bears to follow through on dips. Hardy har ha!!!
Maybe only a few bears left? Its gotta be at least 4 bulls for every bear..im lovin this!
That’s a sign of a top so we need more bears to keep the market going up.
No top for a while IMO
Price action has little to do with bulls OR bears. What we have is central bank buying the market at key pivots. They are supporting round numbers for now but we still have a few broken bearish rising wedges with price trying to clamber back inside them. Meanwhile, the number of stocks hitting new 52 week lows continues to accelerate so this market’s days are numbered, CB or no CB.
This B wave seems to be a little tricky..but VERY profitable. Cant wait for the C wave to trade the opposite with some of the bear..but im targeting nov for the C wave
Very strange price action in VIX. Somebody bought my boatload of calls at my ask price for better than an instant double!
I was expecting to hold them for at least a few more days. Something very strange about that…look at that price spike!!!
Vix will be below 10 soon. It was going down even when market was going down. Sign of much more upside IMO
I have an open contingecy order to buy VIX on any move under 12.00
This website is for educational purposes relating to Elliott Wave, natural cycles, and the Quantum Revolution (Great Awakening). I welcome questions or comments about any of these subjects. Due to a heavy schedule, I may not have the time to answer questions that relate to my area of expertise.
I reserve the right to remove any comment that is deemed negative, is unhelpful, or off-topic. Such comments may be removed.
Want to comment? You need to be logged in to comment. You can register here.