
Update: Friday, March 17, ~11:25am EST
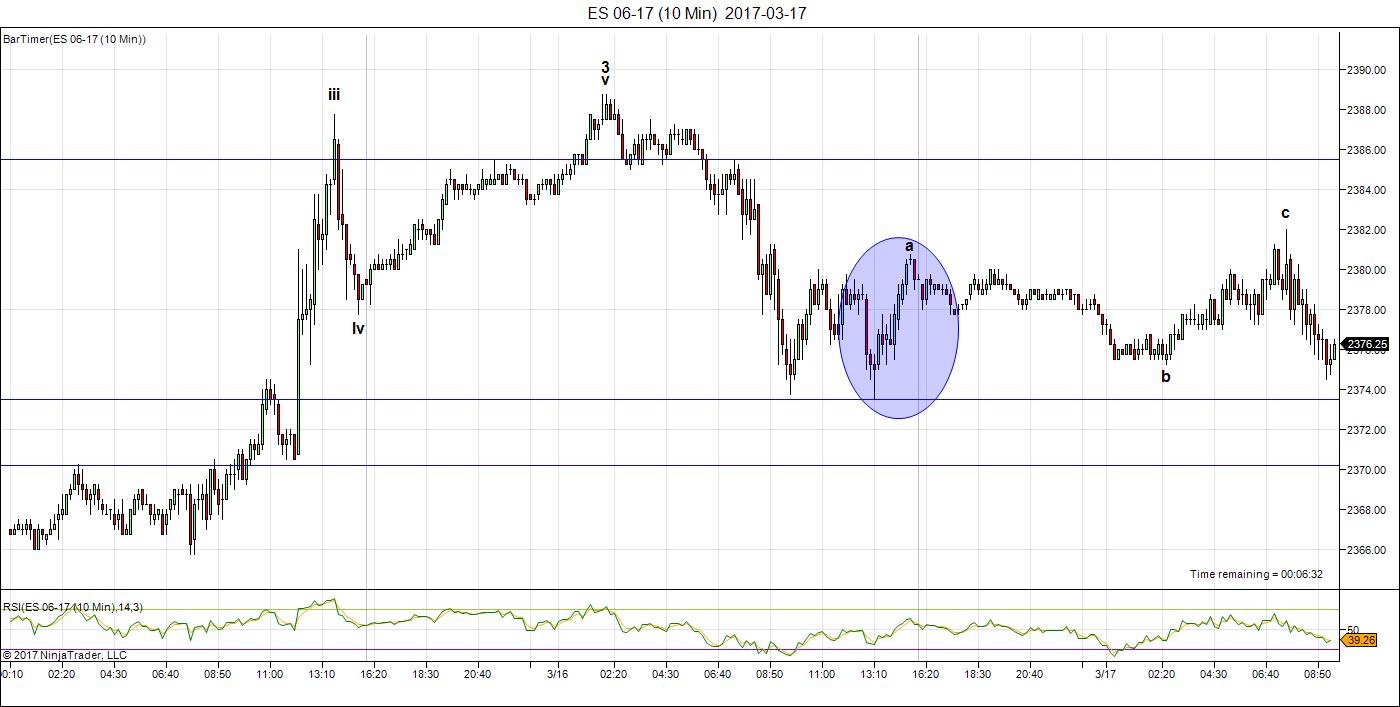 Above is the 10 minute chart of ES. If you look closely (you can double-click all my charts to expand), you can see that the a wave on the chart went up in 3 waves. Likewise, the larger move up was in 3 waves (an abc configuration). So that meant the market had to come down to the previous low. It’s not quite there yet, but it will need a double bottom in order for it to reverse direction and start moving up again.
I see the same thing happening in USDCAD, but in the opposite direction. In that currency pair, 1.336 is the 4th wave 38% retracement level and and 1.34 is the 62% retrace level. We’re almost to the higher level as I write this. The market should reverse down when it finally reaches that level (or a little above it).
______________________
Market Update for Friday, March 17, 2017
Market Update for March 17, 2017  |
 |
Make sure you zoom the video to full size with frame expander (arrows) in the bottom right hand corner and also set the quality to as high as your web connection allows. This is an HD quality video so the best viewing is at that level. |
_______________________________
Market Update for Thursday, March 16, 2017
Market Update for March 16, 2017  |
|
Make sure you zoom the video to full size with frame expander (arrows) in the bottom right hand corner and also set the quality to as high as your web connection allows. This is an HD quality video so the best viewing is at that level. |
_______________________________
Update: Wed., Mar. 15, ~12:30pm EST
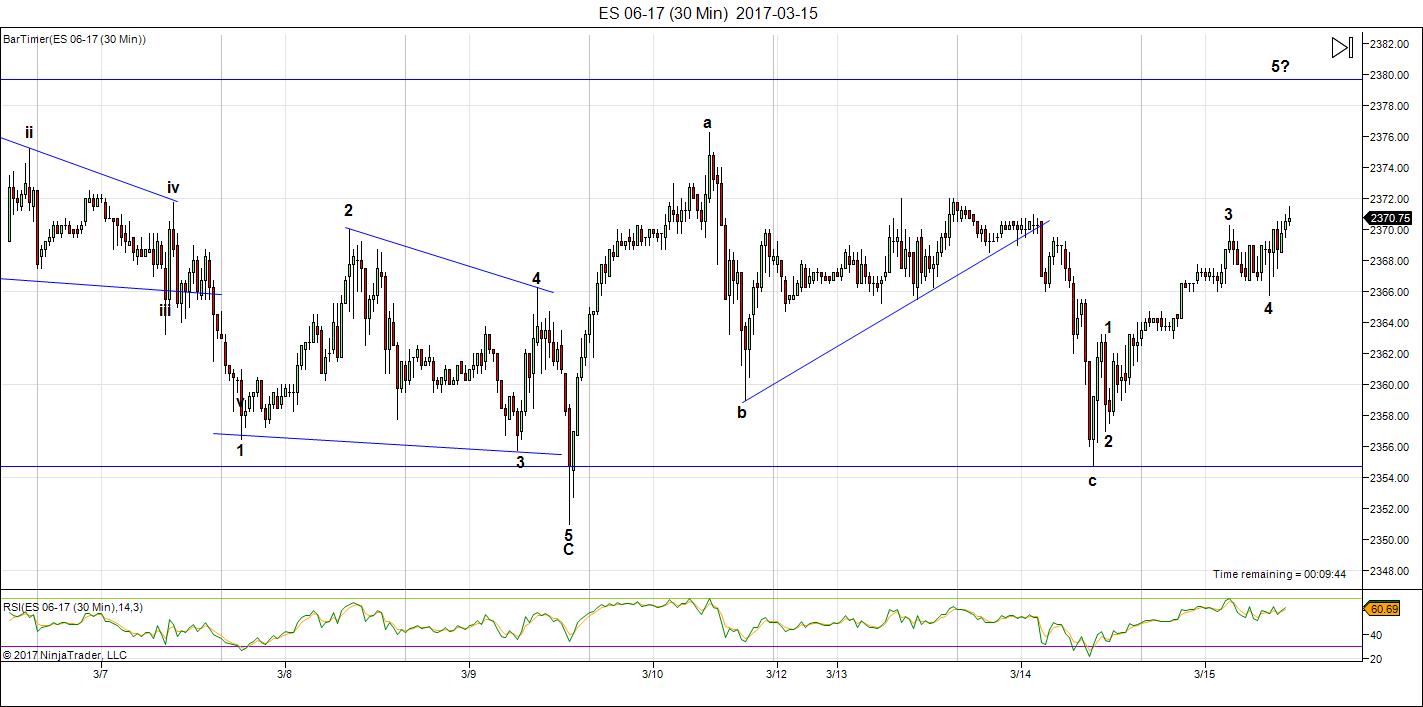
Above is the 30 minute chart of ES showing the 5 waves we’re working on. The target looks to be 2380, which is the 62% retracement level from the top to the recent bottom. We should hit a turn down when we get there, but I still have us needing a new high eventually.
________________________
Market Update for Wednesday, March 15, 2017
Market Update for March 15, 2017  |
|
Make sure you zoom the video to full size with frame expander (arrows) in the bottom right hand corner and also set the quality to as high as your web connection allows. This is an HD quality video so the best viewing is at that level. |
_______________________________
Update: Tues March 14, end of day
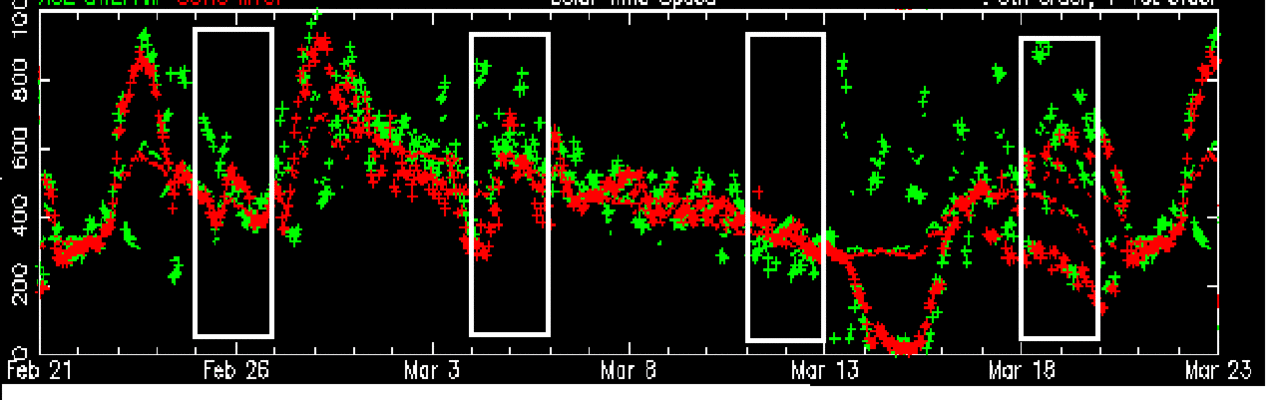
I give you Tom’s energy chart (from the free blog area). I’m relating this to ES/SPX and watching with great interest. It shows the energy field dipping today and turning back up on the 15th, which looks like what we have happening. We didn’t go to a new low and I don’t expect us to, but we may turn up timing as per this chart.
Notice that the next bullish move in energy is rather lacklustre, which might just point to an ending diagonal. I’ll be watching to see what plays out and how well this tools adheres to reality.
__________________________
Update: Tues March 14, ~10:51 EST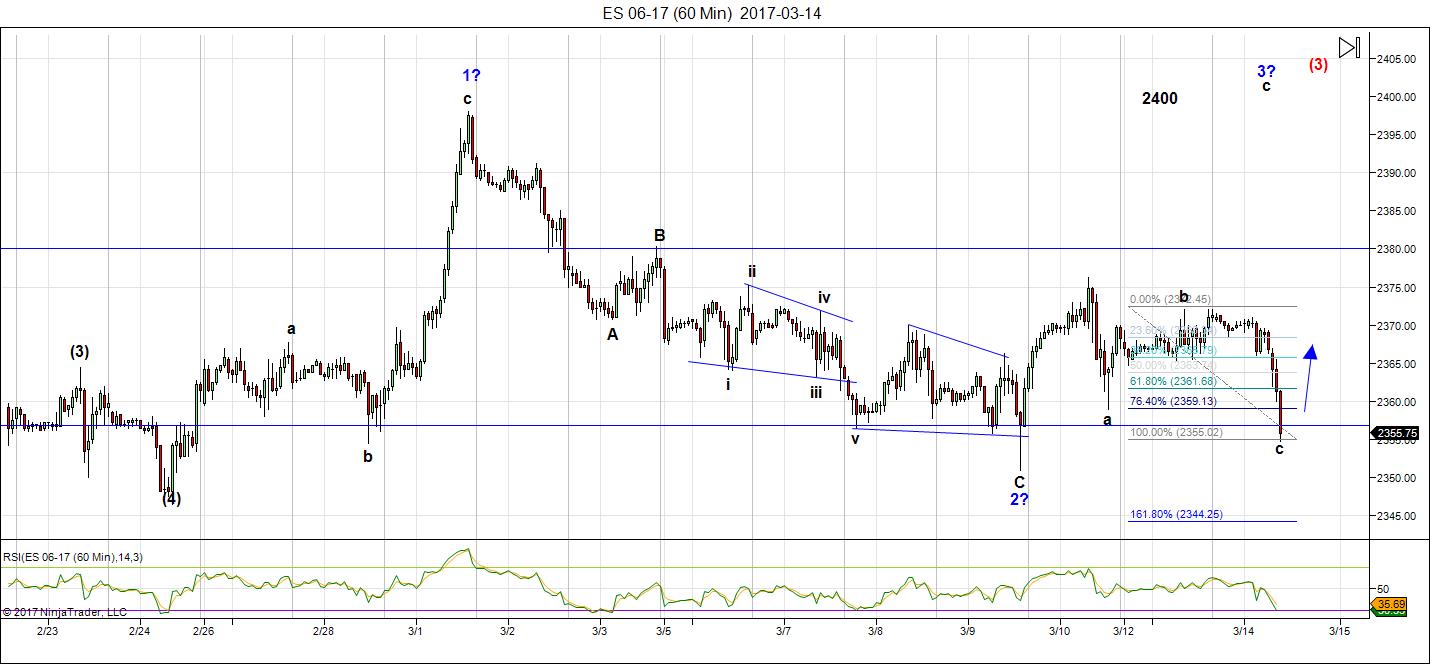
Above is the 60 minute chart of ES. We dropped below the trendline from last night, which gave us a C wave drop. The C wave is the same length as the A wave at 2355, which is a likely reversal point. The larger direction is up.
__________________________
Market Update for Tuesday, March 14, 2017
Market Update for March 14, 2017  |
|
Make sure you zoom the video to full size with frame expander (arrows) in the bottom right hand corner and also set the quality to as high as your web connection allows. This is an HD quality video so the best viewing is at that level. |
_______________________________
If you have kids, and you’ve ever gone on a long trip, you’ve no doubt heard this line. I don’t have kids, but I was one—many of those same characteristics are still with me, for good or for bad … 🙂
Once again, I’m looking for a top.
I know I’m sounding like a broken record. But here are some traits of wave 3’s:
- they’re the most powerful of all the waves
- they’re never the shortest wave of a five wave sequence and are most often the longest
- they exhibit the strongest volume
- if they’re motive, they will have 5 waves obvious within them
- they often extend (which is the case in the US indices now)
The final, larger fifth wave should have lessor volume, be shorter than the third wave and possible end up as an ending diagonal.
This weekend, the US markets are fairly straight-forward in what they’re telling me is going to happen. We are in the midst of a fifth of fifth wave up to a final wave 3 top. We should reach the top mid-week.
It’s the USD currency pairs that are becoming “interesting.”
That’s because they’re more tightly aligned in their turns, but what’s a bit confusing is that the EURUSD has already turned up into its final wave, while the other currency pairs seems to still be in their second to last wave, although near the ends. I was expecting a turn somewhat in tandem.
I called the turn in EURUSD on Thursday night as it finished a very sharp downward wedge. The turn happened right at the measured 62% target. Since then, it has been heading straight up—all as predicted. In fact, this currency pair has been highly predictable ever since it bottomed on January 3.
In terms of the other currency pairs, very little has changed since my post last weekend (except for USDCAD—you’ll find more on that in the chart below and in the video).
Last weekend, I wrote:
“There are some really good opportunities coming on line this week, as the markets go through a major turn.” I have a good feeling that Wednesday will see a top to wave 3 in ES/SPX and the other US indices.
There were turns in AUDUSD (minor), EURUSD, USDCAD, and USDJPY (minor) this past week. They all happened at exactly the same time, but to differing degrees.
I’m concentrating on these is this weekend’s video, and also on gold and oil, which also have had major turns in the direction I’ve been predicting (FINALLY!) However, both are at dangerous levels at the moment. I’m expecting a turn up in silver and gold (into a B wave) and oil soon, after a bit more on the downside.
I keep hammering on the fact that the least risky entry after a turn is after the first wave has been confirmed and the market has retraced about 62% in a second wave. This is critical in assets such as gold, where the risk is quite high if you get in at the wrong point.
However, I’ve moved the First Wave Down diagram and explanation to the forum, where we’ll always have it available. You’ll find it here: https://worldcyclesinstitute.com/forum/traders-gold-1/trader-first-wave-down/#p185
The Top is a Result of Herding
The top will come when the tide has turned—when the final Elliott wave has played out—when the herd has everyone onboard the bull train and there simply isn’t any more money or unreasonable exuberance out there.
I hear the constant predictions of a turn-down at one top of another, but as I’ve been consistent with saying is that truncations in my experience are not real. They’re “fake news” from another time.
The Elliott wave structure forms the foundation for any major trend throughout society, worldwide.
Think of human nature and getting a herd of people to change their minds. Let’s use the example of smoking. Government and health organizations tried for many years to turn the tide on smoking cigarettes through huge amounts of advertising, negative ads right on the packaging itself, and taking the industry to court. But that’s actually just the recent history. All that happened after the tide had already turned!
Even though the argument was incontrovertible, due to study after study, and a long history of death from various cancers, the herd did not suddenly turn off smoking. People don’t suddenly, as a group, make a decision to change overnight. In fact, if you can get them to change a habit at all, it’s a major win!
Herding causes the change to happen gradually.
But the bigger story is two-fold:
- trends of any type follow the Elliott wave structure of 5 motive waves
- governments always get involved once the trend has changed (because they operate on consensus and the tide needs to turn more than 50% in their favour before a law will be passed)
So if you think Elliott wave is some crazy idea that’s kinda weird and sometimes works, guess again. It’s a mathematical representation of human nature and it’s simply going to play out, no matter what! The challenge is in the analyst—how good they are in reading the wave structure, which is fractal (a little plug for me).
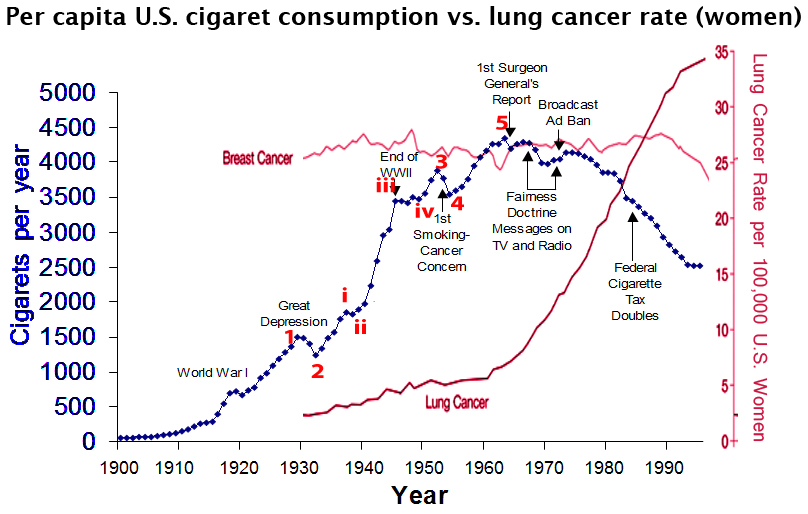
As per the diagram above, the Elliott wave structure of five waves up or down, with waning volume in the fifth wave (and very often an ending diagonal, which is a motive wave, but has the structure of a corrective wave) is not exclusive to the stock market. You’ll find it as the foundation for any major trend throughout society, worldwide. There is more definition to the structure based on how much of the population is involved (ie.-the size of the sample).
The red numbers is the chart above are mine, The data comes from the United States Department of Agriculture: The 1986 Surgeon General’s Report. Note that the third wave even has 5 motive sub waves within it!
Also take note of the fact that the government gets involved once the trend has changed. But nevertheless, they’ll take the credit for the success of the change. This is just a fact of life, and happens over and over again throughout history.
Take employment, as an example. The government has no real affect on employment but they’ll take credit for it in the good times, and blame it on someone else when it turns sour. We always fire politicians when the market turns down, even though they have nothing to do with it.
Elliott wave are a natural phenomenon and logically are a result of exogenous forces (beyond the confines of the Earth). I’ll let you think about that one—a subject for another post, or video.
______________________________
Here’s the latest daily chart of ES (emini futures)
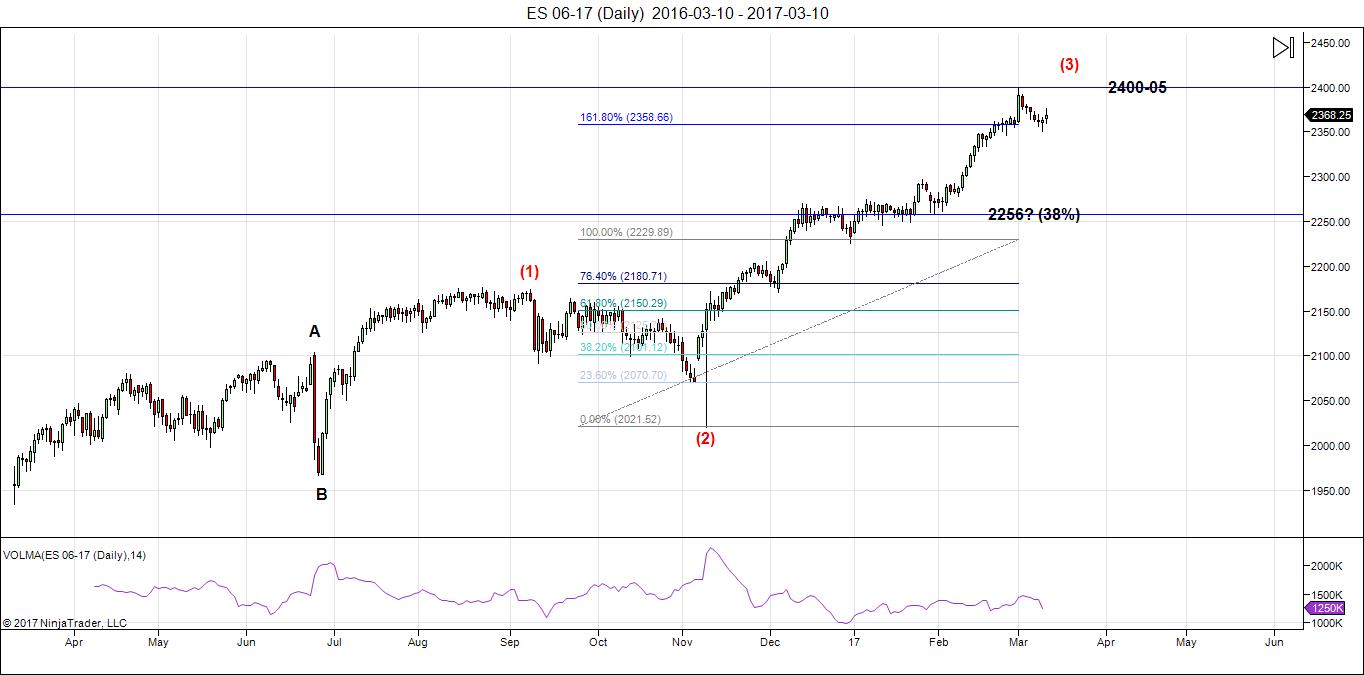
Above is the daily chart of ES. Nothing new here. The full wave up looks to be like a triple three (a combination wave) which is almost at completion (or will be with one small final wave up to about 2406—shown in the hourly chart below).
The larger 4th wave (after the top of 3 this week) will come down in three waves. After we finish the A and B waves, we should be able to project an end to the C wave of the 4th wave. Once we finish the fourth wave , we’ll get a final blow-off wave. I’m making a point of not projecting a final date for a top because the volume is so low, the markets are so erratic, and they’re moving so slowly.
Here are the path predictions going forward:
- Wave 4 will come down in 3 waves with any of the corrective patterns possibly in play.
- Wave 5 is likely to be an ending diagonal. In any event, it will be in 5 waves (not motive).
Summary: We’re at the top of wave 3 of the final larger 5 wave pattern, getting close to a turn-down into four with one more very small wave up to a new high. I expect all major US indices to turn this week. The larger wave 4 should come down in 3 waves (an ABC configuration to the target).
After completing the fourth wave, we’ll have one more wave to go, which could be an ending diagonal as a fifth wave. The long awaited bear market is getting closer.
_______________________
Here’s the latest HOURLY chart of ES (emini futures):
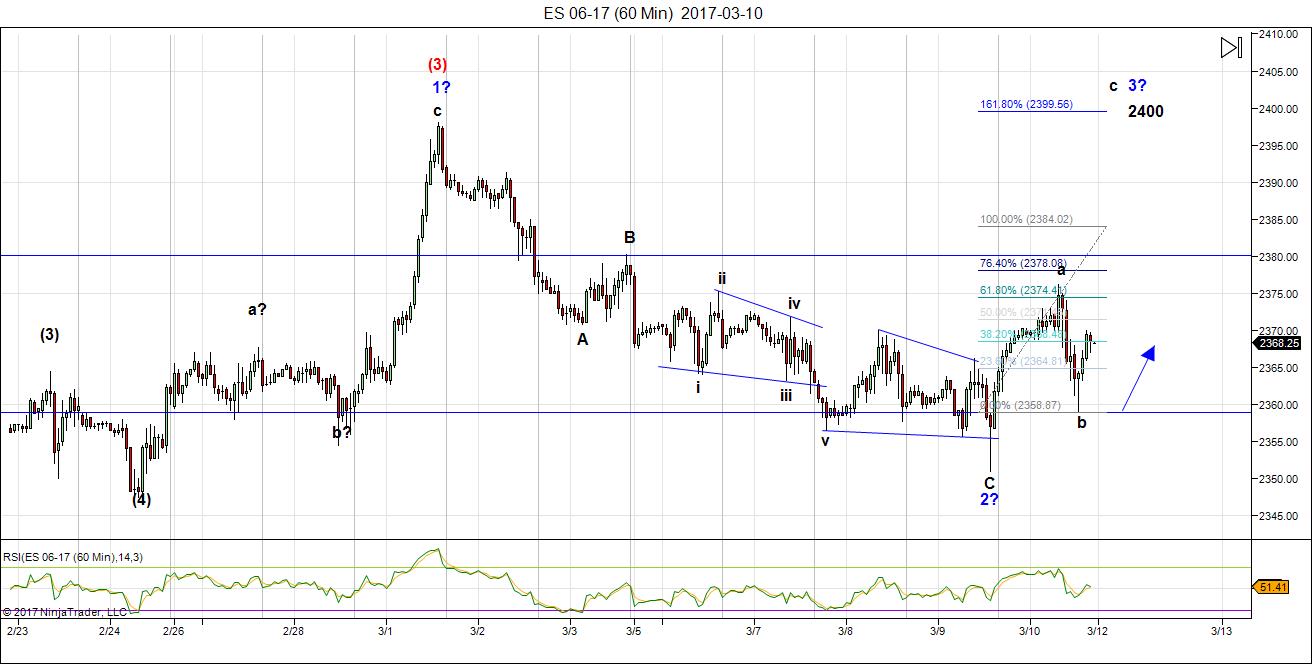
Above is the 60 minute chart of ES. As I’ve been saying, we have one more high still to go. Although I seem to be one of the only ones saying this, the wave structure simply couldn’t be clearer. The wave up is in three waves topping on March 1 (which was an Andy P. turn date). Three waves do not end a sequence unless, it’s the last wave of an ending diagonal, which it is not.
However, it looks to me like the start of an ending diagonal, because in this position, I don’t know what else it could possibly be. We have 3 waves up, three waves down, and the current set-up from Thursday Friday predicts three waves up to 2400 (C wave = 1.618 X the A wave).
We also didn’t go to a new low, or reach a double bottom with the previous 4th wave. So we’re clearly in the fifth wave position. It can’t be a triangle, so all we have left is an ending diagonal. This would make the current wave up wave 3 of the ending diagonal. Look then for a smaller wave 4 and 5 after this wave up and that may take us to the final projected top of about 2105 and we might end up there Wednesday, just in time to hear the fat lady sing.
_____________________________
Some housekeeping:
Andy Pancholi Turn Dates (March, 2017)
- SP500: M13, F17, Tu28/W29
- EURUSD: Tu21/W22
Fed Meeting Announcement: Wednesday, March 15, 2PM EST
New Free Blog Post: Relax: It Always Happens Like This
The Chart Show sign up is live for Thursday, March 16. You can sign up now in the usual spot: Webinars
________________________
Here’s a video overview of the market for Monday, March 13, 2017
Market Report for March 13, 2017  |
|
Make sure you zoom the video to full size with frame expander (arrows) in the bottom right hand corner and also set the quality to as high as your web connection allows. This is an HD quality video so the best viewing is at that level. |
_______________________________
The Longer Term Charts Going into Monday
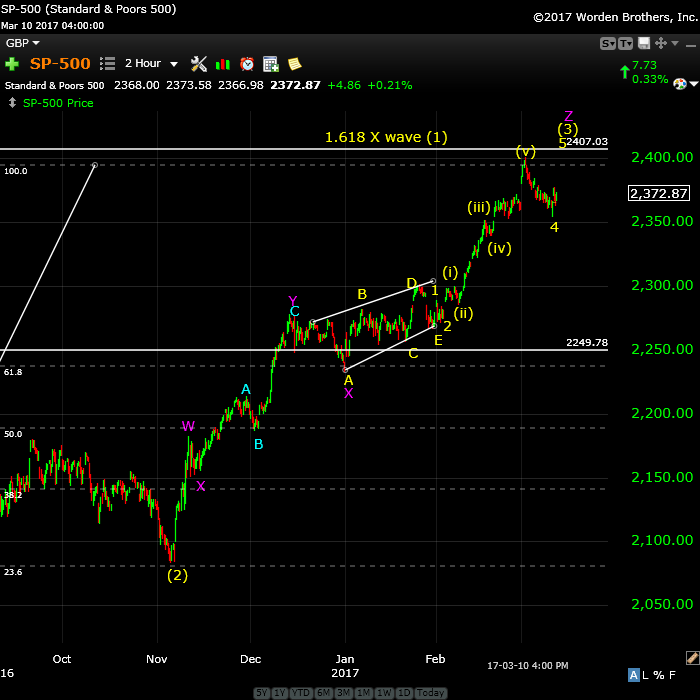
Above is the 2 hour chart of SP500. There is one more subwave up, a “5th of a 5th” still to go before this wave tops out and heads down in a larger fourth wave.
I’ve changed the numbering slightly for the subwaves in the last leg up. It doesn’t in any way change the outcome. There are a couple of counts possible here and I’ve split them between the SP500 and SPY (SPY below has a slightly different count, but same outcome).
Look for a turn down by mid-week (possibly the Fed announcement on Wednesday). My projected top here is 2407, but we could extend slightly.
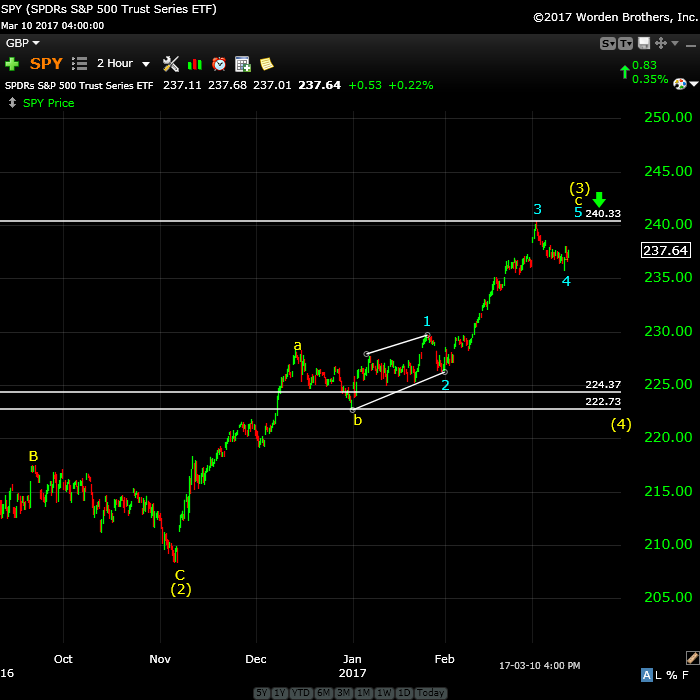
Above is the 2 hour chart of SPY showing a simple abc wave up. I’ve changed the count for the final subwave to show that between SPY and SPX, there are a couple of ways to count this last segment, both with the same outcome. My measurements for the final blue wave 5 place the top of the third wave at 240.33, so with a fifth wave, we may exceed that number. The bottom line is that we need to reach a new high.
Part of the first wave of blue wave 5 is missing so I’m unable to get an accurate measurement or determine it that wave is motive or not.
If this final wave up is the same length as the first wave of the fifth (a typical ratio), then we should see a top at about 242.60. The targets for the bottom of the fourth are preliminary and represent a range: 222.73 – 224.37.
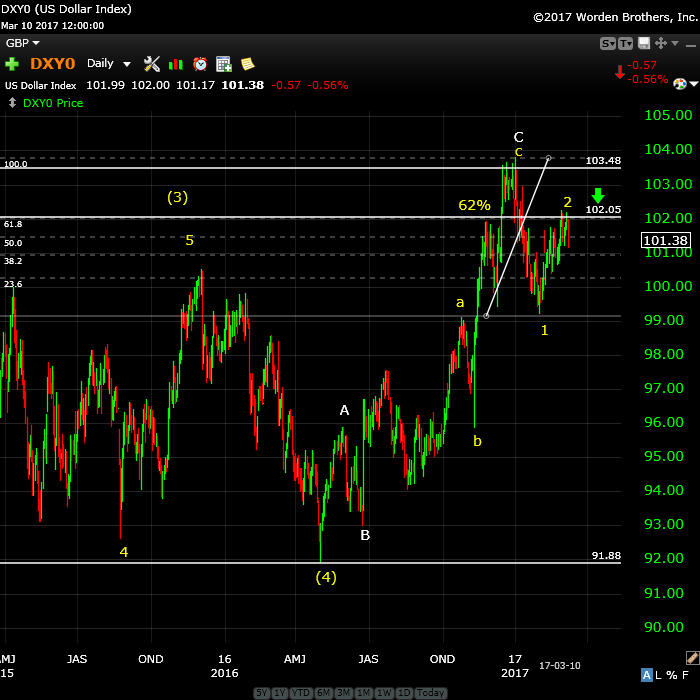
Above is the daily chart of the US Dollar. No change here.
On a near term timeline, wave 2 may be complete. We had a large turn down on Friday and we’ve retraced a little over 62%, so we’re ripe for a turn down. EURUSD also turned up sharply after a wedge shaped wave that hit my target. EURUSD is now in the final wave up, which should mirror the US dollar (chart below).
A 1.618 X the first wave, the target for this third wave is somewhere close to 94.83. The movement of the dollar determines to movement of just about everything else these days. The longer term target for this wave down is 91.88.
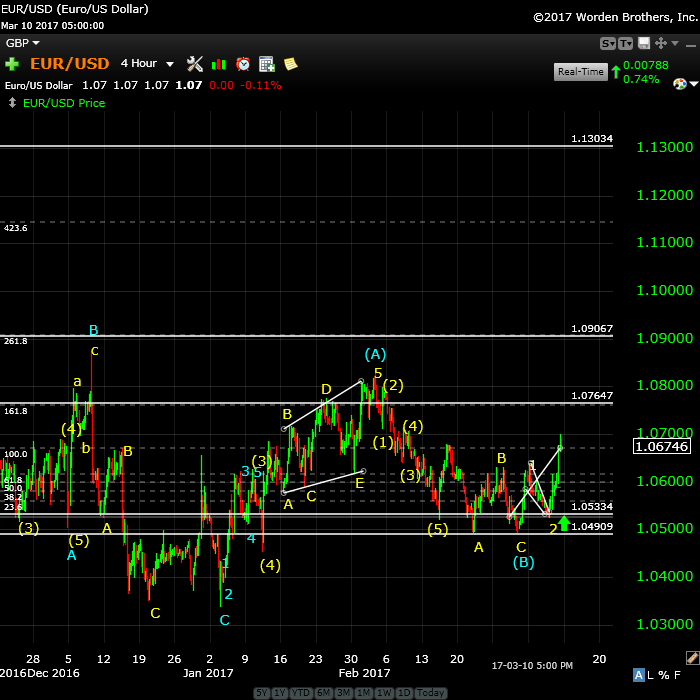
Above is the 4 hour chart of EURUSD. The bigger picture is that we’re headed up to a target of 1.13 before we get a turn down into a very large 5th wave. More in the video.
We turned up on Friday from the 62% retrace target level after a rather extraordinary wedge-shaped wave down. It was very obvious the turn was about to happen and I called it late Thursday night (I think it was). I have two probable tops for this third wave, marked with the horizontal lines. 1.618 level is 1.07647, while the 2.618 level is 1.09067.
This puts the EURUSD in its final wave. The other currency pairs seem to have a little ways left to go before they get into the same position as the EURUSD, so that’s a little unnerving, but the market always does the most obvious thing in the least obvious manner, so we’ll see what happens!
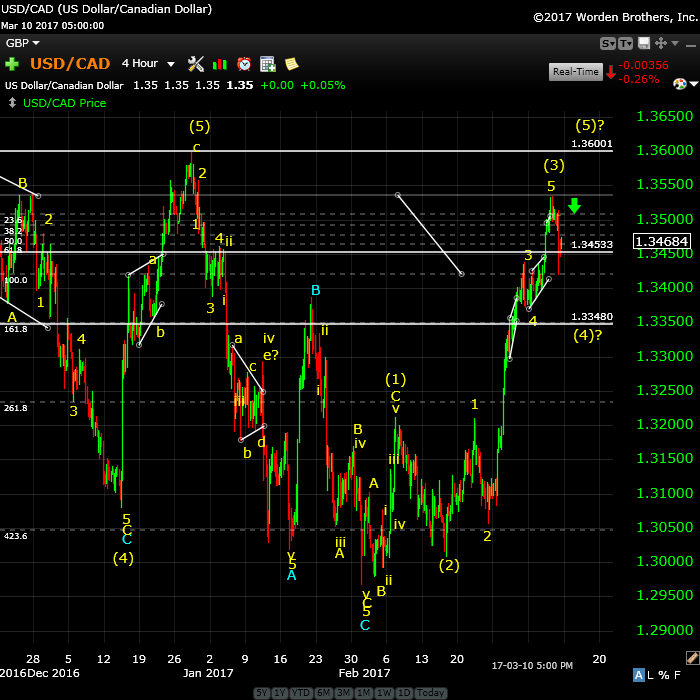
Above is the daily chart of USDCAD.
We hit the target 1.34 and then extended slightly. However, that slight extension became a problem and when we reached the 76% retrace level (the horizontal line at 1.345), it became obvious to me that we’re going to a new high at 1.36. (that 76% level is a “rule of thumb” guidance principle that rarely fails. In other words, if it exceed that level, expect the market to retrace all the way).
For the short term, I’m expecting this current wave down to drop to a measured target of 1.33480 in a fourth wave (horizontal line). Then I’m expecting a 5th wave up to the 1.36 target.
Finally, I’m expecting a C (or third) wave down now. The target on the downside is about 1.19, taking it to the area of the previous fourth wave of one lessor degree.
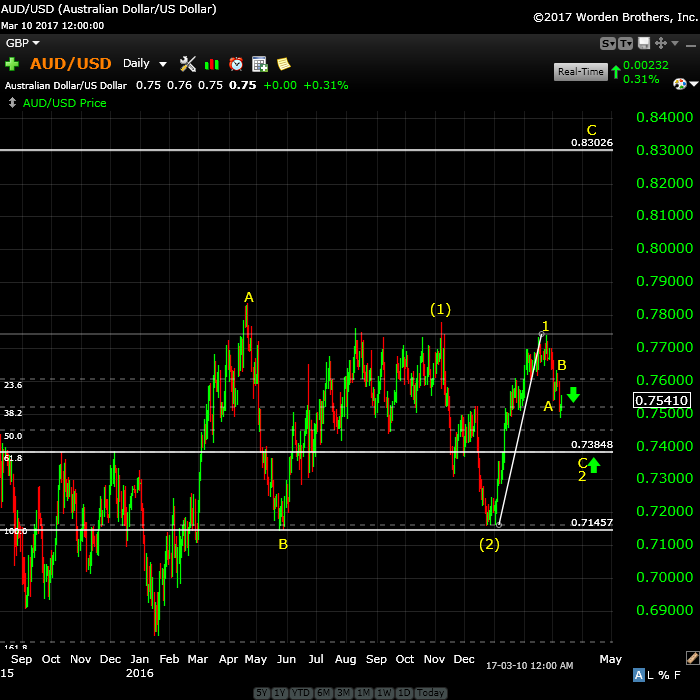
Above is the daily chart of the AUDUSD. This is the bigger picture to my short term projection in the video. No change here.
I’ve an eventual top target of .828 for this pair, which is just shy of the 38% retracement level of the entire larger wave down (from the year 2011), which would make this wave 4.
In the shorter term, we should move to the downside target in three waves to approx. .738 before turning up into the larger third wave. So far, we’ve finished the A wave and are now in the B wave. More information for the short term direction is in the video.
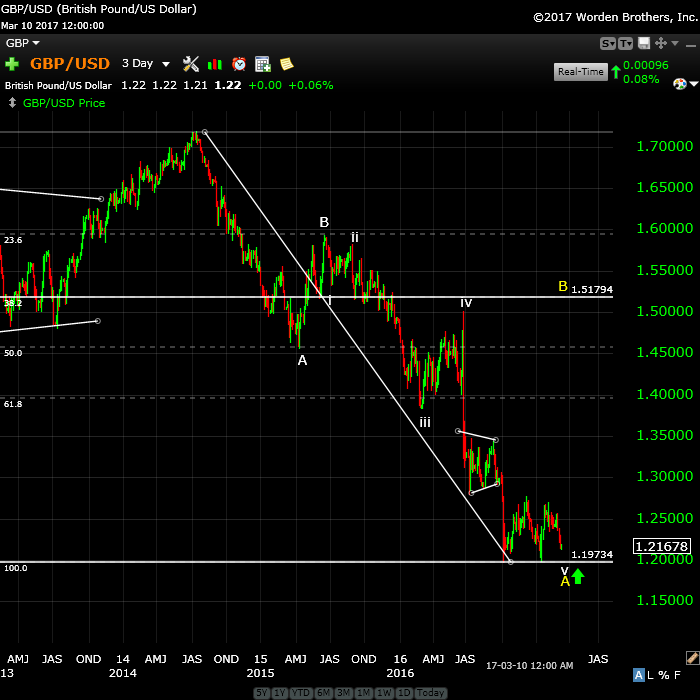
Above is the 3 day chart of GBPUSD. I was expecting this pair to eventually get back “in sync” with the EURUSD, but now I’m not as sure. No change to the short term prognosis. Expect a double bottom at around 1.21678.
This is the bigger picture (above), calling for a rise to the 1.52 level (or about 62% of the distance from the top of the wave down from about 1.7.
More information on the short term prognosis in the video.
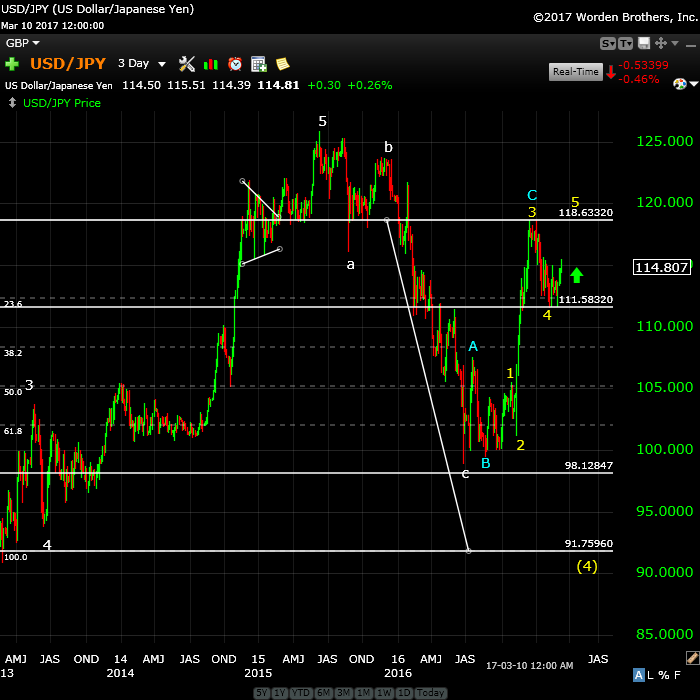
Above is the 3 day chart of USDJPY. No change here. We’re in a corrective pattern down and I’m expecting another correction up now to a target of about 118.63 (a double top). Then expect a drop down to the 91.75 area (this would achieve a C wave of the same length as the A wave down (not marked as a C wave, but it’s the one from terminates slightly above 98.12).
The 91.75 is the area of the previous 4th wave to one lessor degree, which is where we’d expect this larger bearish wave to end.
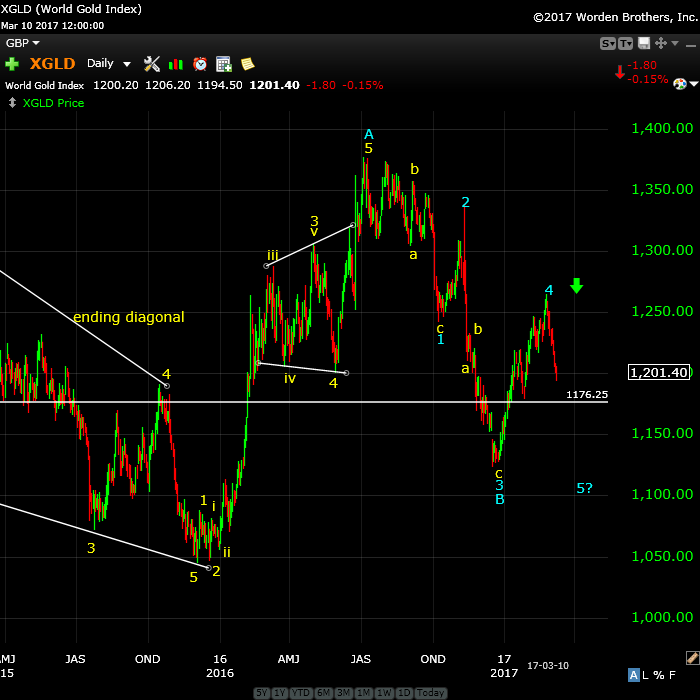
Above is the daily chart of gold. We’ve completed A wave up, but it looks to me as if it’s a wave four. It looks corrective.
I’ve been calling for a double bottom for gold and this is still my preference. The wave up in silver appears even more corrective and they tend to follow each other. The alternative would be a drop down to the 62% area around 1176 or so, but I prefer the double bottom at about 1122.
In the short term, expect a turn up, very possibly at current levels. We need to see a B wave that approaches a 62% retrace. The height of the B wave will give us a fairly accurate length of the C wave. With the strong drop in the A wave, it bolsters my prediction for an eventual double bottom.
The final upside target is around 1585.
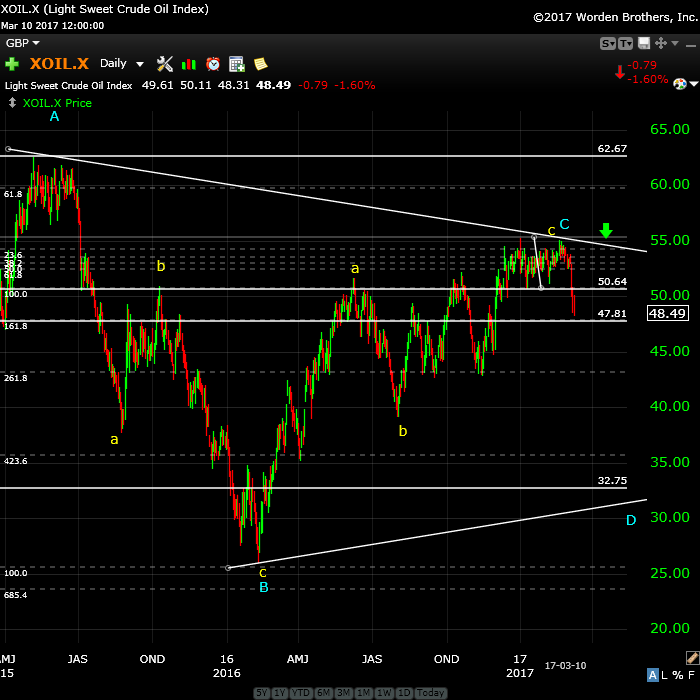
Above is the daily chart of WTI oil. We dropped like a rock from the sideways action that went on forever. I had been calling for a top.
My measurements and the underlying wave structure are suggesting this wave down will be in 5 waves (the first part of an eventual zigzag. In that case, I’m projecting a turn up here to about 50.64 (a small 4th wave), then a turn back down to about 43.00. That should end the A wave.
Then, I’d expect a turn up in a B wave to somewhere around 51.50 before a turn down in a C wave to our preliminary target of 33.00.
Finally, we should get an E wave up to the upper trendline to complete the larger pattern. That would be followed by a final 5th wave down to a new all time low.
Good trading!
_______________________


The Market Update for Tuesday is live at the top of the post.
ES this morning. The A wave = the C wave down at 2355, which is a likely reversal point for this large drop this morning.
Chart of ES at the top of the post. About 10:50 am EST
USDCAD retraced to the 62% level I outlined last night and it should head down from here. (1.349)
ES: All the waves up from the bottom at 2355 are corrective, so we’re wandering around waiting for a double bottom. Then ES should start back up again to a new high.
I’ve posted Tom’s energy chart which I find is moving in sync with ES/SPX so far.
Hi Peter,
The energy chart looks very interesting, is there somewhere you can recommend for me to go to get more information about it? Thanks.
P.S. I’m really enjoying your service….it’s very helpful and hopeful given these difficult times.
Thanks, Stewart,
Hopeful? (maybe I’m not doing my job … kidding 🙂
Tom posts them on the free blog posts area from time to time. A more recent chart of his is here:
https://s8.postimg.org/5deipwwmt/energy_chart_March_13_to_April_4th.png
You could leave a reply to a comment and ask for more info. I think he has a distribution list, but not sure about that.
Thanks Peter. I meant hopeful as in “I want to short this market’ lol!!!!
Well, I’m hopeful that will be before summer. EURUSD (and the dollar) is in the final wave. All the rest area close …
The Market Update for Wednesday is live at the top of the post.
ES: It could arguably said that we’ve eked out 5 waves up tonight, but a very strange-looking five. If that’s the case, we’ll need a 2nd wave retrace before turning around and heading up.
Until ES/SPX tops in this “forever” third wave, this is going to be a dismal market in currencies. They’re getting pushed around in a small range. AUDUSD for example, has to go up because the euro is going up, but it still has to hit its target on the downside. I don’t see that happening until we hit a 4th wave in ES. USDJPY, same thing.
It’s all out of sync at the moment.
SO ……
The BIS has come out and said Canada is the first country that’s going to head into a recession (“r” should be a “d”, of course).
http://www.zerohedge.com/news/2017-03-15/canada-flagged-recession-bis
But what’s so ludicrous, is that the BIS is the central bankster group that creates Canada’s money (out of nothing) and charges us compounded interest for the privilege, thereby creating the problem. 80% of Canada’s debt is from interest payments to these folks.
And you can’t repay the debt, because the money would disappear out of the economy, thereby creating instant depression through deflation.
As I’ve been saying. It’s an amazing world we live in. As DT would say, “SAD!”
I just posted a chart of ES showing the 5 waves up on progress.
ES on the downside. 3 potential targets: 2374.5, 2370, or 2364. The lower one is about the 62% level. A C wave up from there goes to a new high.
Don’t know which one of these will be the turn.
ES obviously retraced to the first target I provided. This wave is extending and the target on it as a third wave is now 2395, which is not quite a new high, so it will need a fourth fifth to get there. Not sure about the eventual pattern, but I’m still expecting a new high.
Currencies. EURUSD continues to move up as predicted and it’s moving the other currency pairs in the same direction as per my comment this morning.
USDCAD has reached its target and will need a retrace. If it retraces to the previous 4th (1.34), and does a 5th down, then I would have to think we’ve topped (which is the alternate count).
My concern is that all these assets are moving with the US market and we still have a 4th wave coming in the US market once it tops. It will move these pairs in the opposite direction at that time. How far is the question.
This “moving in tandem” is complicating matters and yo-yoing AUD and USDJPY around.
gold and oil are clearly in corrective moves up now.
That retrace level on CAD is 1.338 if it retraces to the previous 4th, which I expect is what will happen.
The Market Report for Thursday is live at the top of the chart. It’s a little bit longer tonight. About 20 minutes.
Looks like another great short entry for gold, wouldn’t you say Peter?
Yeah, gold is close – will go over in chart show. Silver a bit further to go, as with WTI oil.
The Chart Show is live at: https://worldcyclesinstitute.com/march-16-2017/
The Market Update for Friday is live at the top of the post.
Just a quick question on timing. Seems we still have a lot of work to do before the final top (Wave 5). We have subwaves 4 and 5 for Wave 3, then the bigger Wave 4 (down in 3) and Wave 5 (up in 5). So seems to me more like the Fall at the earliest?
This was ES/SPX ^^^
I think so. Wave 3 has been so long which given wave 4 and 5 ages to complete. Wave 4 should be pretty fast though in my opinion taking 4-6 weeks. Wave 5 could rack up 4-5 months. If wave 3 continues to extend then i would even consider 2018 for a final top. I wont be trading really until wave 4 happens and then get long and then at the final top.
Yeah I still can’t tell if we are in subwave 3 or 4 of Wave 3 looking at the count. If we get a new high then it looks to me it’s still 3 of 3. Then spx will have subwaves 4 and 5 before Wave 3 completes. That could mean maybe even another month or two just in Wave 3? Then bigger Waves 4 and 5. I agree that 2018 seems possible for the final top but still unlikely. I’m thinking late summer early fall if we can get this thing to speed up. Lol. But we all thought it had a good chance of a final top last Dec and here we are three months later and still in Wave 3. As Peter says “very frustrating market” (understatement of the year).
Peter,
on the chart show, what was th book on herbert hoover you mentioned?
Tim,
It’s “Herbert Hoover in the White House” by Charles Rappleye. An easy read, very comprehensive, and I enjoyed it thoroughly.
USDCAD.. I just happened to look at the market to see this pair hit the 38% retrace level … finally. It shows how important fibonacci levels are to the market. It should head south from here.
The wave so far had been in 3’s. Same thing in ES. The waves up were in threes so a new bottom was in the works. It should turn up from here. Everything moving in tandem.
Looks like were heading back up!
I just posted a chart and mentioned USDCAD. Look for a turn back down at 1.34. It looks like this pair is going to extend down, because this reversal is earlier than it should be.
ES hit a previous low. CAD is way below the 1.34 mark. Still think we are going to 1.34 in CAD. Thought CAD would coincide with ES seem out of sync.
No idea why CAD would stop at a 50% retrace and complete three waves down unless it was going back up. Plus the length of the wave down sets it up exactly so as wave A will equal wave C up at 1.34. My money is on 1.34.
I placed a chart of ES at the top of the post.
A new post is live at: https://worldcyclesinstitute.com/a-peaceful-queasy-feeling/
A new free blog post is live at https://worldcyclesinstitute.com/weve-been-here-before/