
The Dip — A Game-Changer for Me
“What really sets superstars apart from everyone else is the ability to escape dead ends quickly while staying focused and motivated when it really counts.” — Seth Godin
“Winners quit fast, quit often, and quit without guilt—until they commit to beating the right Dip for the right reasons. In fact, winners seek out the Dip. They realize that the bigger the barrier, the bigger the reward for getting past it. If you can become number one in your niche, you’ll get more than your fair share of profits, glory, and long-term security.”
I read this little book when I was learning the Elliott Wave Principle, which took me years to master, because of the errors and omissions in the book, and the seeming inability of the folks at Elliott Wave International to analyze waves properly (argh!). It was a frustrating time.
There were many times where I wanted to just give up. That’s “the Dip.” It’s the point in any major undertaking (usually three quarters of the way there) where psychologically, you hit a low point and are on the verge of quitting altogether.
Many never make it to their goal; it separates the “stars” from the also-rans. As they say, we don’t remember who came in second.
The “superstars,” the experts we look up to in life, got there because they powered through that “dip” in motivation and made it to the end, undergoing many frustrating challenges along the way.
We’ve had nine months in the US indices of a slowly rising B wave, but it is indeed almost over. Just a little more patience will pay off in a big way.
It’s been a frustrating wait because the rally in ES has been one that has almost died several times, but suddenly comes back to life every time. Frustrating!
But the Elliott Wave Principle, either through counting waves, or through fibonacci measurements, always alerts as to when the turn will come. Time, as I’ve said many times before, is not something EW does well. So … we wait. The signals for the coming turn are clear; however, the shorter-term wave structure in the US indices is not as clear as I’d like it to be.
In any case, other asset classes are also signalling a turn is imminent. This is going to be a major turn of just about everything. It will be worth the wait.
In terms of my work learning Elliott Wave, I found that I had to try to disprove it in order to prove it in every instance. It took me several years to go through the process, figuring out when I was wrong, why I was wrong. That process led to additional rules I discovered and guidelines in the book that I ultimately figured out were dead wrong. For example, truncations. I have not been able to find one in back-testing through a hundred years of the DOW data.
I lost a fair amount of money along the way, but I was determined to either prove it worked, or find a flaw that would cause me to abandon it. I was determined to master this particular niche. I’m still working towards that end. I say that because, with the market, there’s always some nuance or subtle pattern that you end up refining in some way. But the work I did has paid off.
I have not been able to find an example of how Elliott Wave fails to adhere to the set of rules that I’ve adapted from the Elliott Wave Principle book. Most analysts aren’t willing to put in this kind of work. I am, thanks to Seth Godin and The Dip.
______________________________
Update on NDX
NDX really didn’t advance this week; it still looks like we may have an ending diagonal in the works to finish off the 3rd wave. The measured target for the third wave to the upside is 7900, but I’m unsure if we’ll actually make it that high.
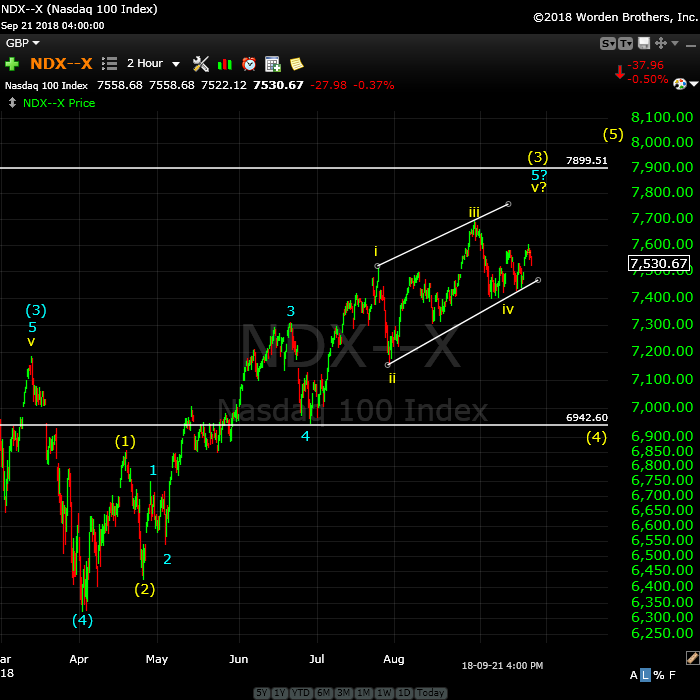
Above is the two hour chart of NDX (Nasdaq 100).
There at least a couple of ways to label this final set of waves up to the top of wave 3. With the sideways movement this past week, and the fact that NDX (and NQ) did not break below the lower trendline, leads me to label this pattern as an ending diagonal. If so, expect a final rally up to the upper trendline. We could get a “throw-over” (a spike above the upper trendline) but it’s not required to end the pattern.
On the other hand, if we break down below the lower trendline, then we’re in the fourth wave down and the third wave would likely be complete (I can also count the wave up as having traced out a full five waves of the third).
Keep in mind that at tops, often the final waves start to compress and often doing trace out their full expected lengths.
The larger fourth wave should come down to the previous fourth wave somewhere around the 6942 area. It cannot drop into the area of wave (1) or it would negate the impulsive wave and possibly lead to an ending diagonal.
The fourth wave down and then a final fifth wave to a new high are the final two waves before the top of the 500 year rally. After the final 5th wave up in NDX is complete, we’ll turn down into the bear market I’ve been talking about here for the past three years!
______________________________
Elliott Wave Basics
There are two types of Elliott wave patterns:
- Motive (or impulsive waves) which are “trend” waves.
- Corrective waves, which are “counter trend” waves.
Motive waves contain five distinct waves that move the market forward in a trend. Counter trend waves are in 3 waves and simply correct the trend.
All these patterns move at what we call multiple degrees of trend (in other words, the market is fractal, meaning there are smaller series of waves that move in the same patterns within the larger patterns). The keys to analyzing Elliott waves is being able to recognize the patterns and the “degree” of trend (or countertrend) that you’re working within.
Impulsive (motive) waves move in very distinct and reliable patterns of five waves. Subwaves of motive waves measure out to specific lengths (fibonacci ratios) very accurately. Motive waves are the easiest waves to trade. You find them in a trending market.
Waves 1, 3, and 5 of a motive wave pattern each contain 5 impulsive subwaves. Waves 2 and 4 are countertrend waves and move in 3 waves.
Countertrend waves move in 3 waves and always retrace to their start eventually. Counrtertrend (corrective waves) are typically in patterns — for example, a triangle, flat, or zigzag. Waves within those patterns can be difficult to predict, but the patterns themselves are very predictable.
Fibonacci ratios run all through the market. They determine the lengths of waves and provide entry and exit points. These measurements are really accurate in trending markets, but more difficult to identify in corrective markets (we’ve been in a corrective market in all the asset classes I cover since 2009).
To use Elliott wave analysis accurately, you must be able to recognize the difference between a trend wave (motive) and a countertrend wave (corrective). There’s very much more to proper Elliott wave analysis, but this gives you the basics.
____________________________
Registration for Commenting
Want to comment? You need to be logged in to comment. You can register here.
If you register, it protects your information. It also allows you to comment without filling in your information each time. Once you’re registered, simply go to the home page and click on the login link top right in order to log yourself in. Usually, you’ll be logged in for several days before needing to be logged in again.
______________________________
Problem receiving blog comment emails? Try whitelisting the address. More info.
______________________________
Couldn’t be happier … KK 2
Couldn’t be happier …The analysis and insight you provide is simply amazing! I’ve been trading the futures and equity markets for well over thirty years and usually average around 5% monthly. Since joining your Traders Gold Service two months ago, that number has better than doubled. I couldn’t be happier.—KK |
Rise above the rest … SM 2
Rise above the rest …I have only ever met a few people who, in their chosen fields (astrology, medicine, music, martial arts, technical analysis), rise above all the rest and you are one of them…you have ‘the gift’…and that’s why I’m a Trader’s Gold member. —SM |
Have not had a losing week RW 2
Have not had a losing week …I have been with Peter almost a year. The only thing that matters is have I made money with his service. I think I have finally turned the corner using Peter’s EW. I have not had a losing week in the last 5 months. Thanks Peter, for your amazing amount of hard work. —RW |
The best of them JL 2
The best of them …Last couple of years, I subscribed to several ‘market traders’. You are by far the best of them and the personal contact is awesome. Daily and daily updates are very well written! Besides your expertise in EW, I also like your cycles analysis. Best investment I ever made! —JL |
Tops in your field DZ 2
Tops in your field …You are tops in your field. Tried to follow Elliot Wave international for years. They were always behind the market. After discovering you, I perceive that you are an expert in reading the waves, which puts you way ahead of the rest of your peers. And you can read the Waves like you are reading tomorrow’s financial section. I pray you stay healthy. —DZ |
the real deal SM 2
The real deal …‘Educational, insightful and thorough market analysis for all levels of traders. It’s Elliott Wave at its best….Peter Temple is the real deal’ —SM |
A true expert in Elliott Wave FL 2
A true expert in Elliott Wave …You are a true expert in EW analysis. What you provide is not available anywhere and is priceless. Subscription on your services is the best thing I have ever done. Many thanks for your effort to make me a better investor. I now have more trust in my investment decisions. I hope you will continue the excellent work! —FL |
Get an upper hand … JC 2
Get an upper hand in trading …Seeing all the different currency pairs and the wave structures and hearing you explain why this has to do that on a nightly bases gives one a upper hand when trading. Elliott Wave applies to all stock and indices and can be applied to any candlestick chart. If someone ask what you want for Christmas – Tell them a membership to Peter’s “Traders Gold!”—JC |
The Market This Week
Here's the latest daily chart of ES (emini futures)
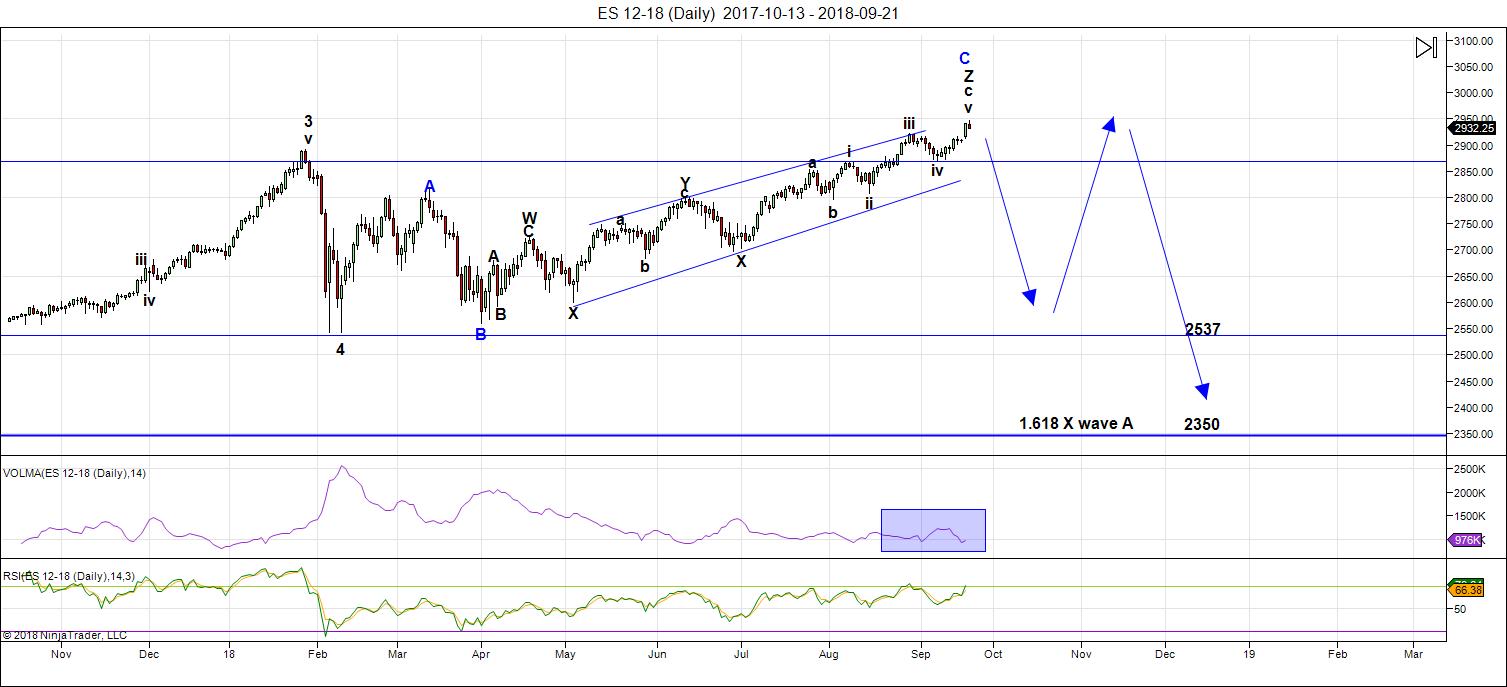
Above is the daily chart of ES (click to enlarge, as with any of my charts).
Even though we're at a new high this weekend, we're still waiting for the fifth of the fifth wave to end. It should end this week; there are signs from all the other asset classes I cover that we're going to have a major turn of just about everything.
The big change this week was the movement of the US dollar, which did not bottom as a wave in three as it threatened to do, but dropped to a new low. That sent SPX higher, in a larger wave than I expected, but still the final wave.
With all the events coming this week (full moon, Fed announcement), I would expect the turn to finally take hold. My money is on the Federal Reserve announcement, which tends to be a magnet and usually results in a turn the following day — the long-awaited C wave.
My preference is for this continuation of fourth wave pattern (down) is that of a expanded flat. However, technically, it could also be a running flat. At the present time, the B wave (that's the ABC wave up from about 2532) is longer than the A wave (marked as the 4th wave down from January 29, 2018). A regular flat registers as an expanded flat when the B wave is over 105% of the length of the A wave—ie, the B wave would need to reach above 2889, which is has done.
That means that the ES/SPX has multiple possibilities as to a target on the downside. Accuracy (in determining the most probable target) is going to depend upon both counting and measuring the waves to the downside. It's impossible to pick a downside target at this point in the process.
If we select all of wave 4 (on the chart—down from January 29) as the "A wave," then we're looking at an expanded flat. In that case, this outcome is the most probable:
- the C wave of a flat is typically 100 - 165% of the length of the A wave (so the target would be from 2532 - approx. 2360) - preliminary targets
There are other options:
- a running flat would trace out a C wave that is NOT longer than the A wave (in other words, it would not go to a new low). I regard this option as very low probability because it's extremely rare (I've only ever seen one of them). However, if NDX is tracing out a final impulsive pattern, its fourth wave should not be very deep, which may also restrict the length of the C wave in the SP500.
Volume: Volume ticked up with Wall Street back at their desks after the summer break. However, this week, it's headed back down. The lack of volume again foreshadows a turn.
Summary: We're waiting for a top in a B wave, which will result in a C wave to a new low. My preference is that this structure represents an expanded flat, but there are other options. Once the c wave (down) is complete, expect a final fifth wave to a new high. That fifth wave up to a new high will be the end of the 500 year bull market.
___________________________
Trader's Gold Subscribers get a comprehensive view of the market, including hourly (and even smaller timeframes, when appropriate) on a daily basis. They also receive updates through the comments area. I provide only the daily timeframe for the free blog, as a "snapshot" of where the market currently trades and the next move on a weekly basis.
______________________________________
Sign up for: The Chart Show
Next Date: Wednesday, October 3 at 5:00 pm EST (US market time)

The Chart Show is a one hour webinar in which Peter Temple provides the Elliott Wave analysis in real time for the US market, gold, silver, oil, major USD currency pairs, and more. You won't find a more accurate or comprehensive market prediction anywhere for this price.
Get caught up on the market from an Elliott Wave perspective. You’ll also get Andy Pancholi cycle turn dates for the SP500 for the balance of the current month. There’ll be a Q&A session during and at the end of the webinar and the possibility (depending on time) of taking requests.
All registrants will receive the video playback of the webinar, so even if you miss it, you’ll be sent the full video replay within about an hour of its conclusion.


Added to my puts on this morning’s phony ramp up and positions all nicely in the green. I am expecting a move under this morning lows and will sell as soon as we hit that target for a nice scalp.
Selling half puts DIA put for 25% gain. Holding remaining for more downside or a bankster ramp to further reduce cost basis.
Good to see we both making $..on opposite sides!
Made I should play both sides..and double my gains 😉
Selling remaining puts. Waiting for bounce to reload
Every drop..gets gobbled up!
How many HOs in a row now? Its not very reliable any more..IMO..kinda like boy who cried wolf..or a clock being right twice a day.
Gonna have to tune into SIR PETERS chart show to catch up on his outlook.
Bulls make money, bears make money….! 😊
The pattern we have consistently seen to date is post full moon strength.
I am assuming the pattern will continue with uwards movement the rest of this week.
Selling DIA Oct 12 259/260 bull put spread for 0.30. Objective is to get positioned with 259 puts at zero cost basis.
Yes imma expecting a blow off top for this B wave..with Fed getting party started tomorrow..N100 needs another 130 points..and NYSE needs over 400..i would like to see another 3-4% upside for IWM..SPY..DIA..and QQQ. Fully locked n loaded. Bulls gonna run wild tomorrow IMO.
speaking of nyse, i wish there was a way to trade it, ideally with options. the wave counts are so much cleaner and more predictable imho. ishares had an etf over a decade ago but closed it. pretty sure there is nothing else.
Dont usually short volatility over night but todays spike was too tempting not to short it.
Chris Cole’s third installment of his article on liquidity and market risk is up on Zerohedge.
It is really mind-blowing how few folk, even long time market participants, truly understand what is headed our way. Some of the comments I have been hearing from people who ought to know better sometimes literally leaves me speechless.
Frankly, after reading Chris’ article, my own suspicions about the viability of trading what is coming were substantially heightened.
A few years ago Prechter suggested the only truly safe place to be would be in cash. I am starting to see what he meant by that statement. Be careful out there!
I admit in my 40 years..i know booms and busts come and go..and we are in the late innings of a historic bull market rally..but my suspicion is we have another 18-20 months before theres really anything to worry about..the C wave in Nov..then wave 5 should last at least a year..once we get to 3500 or 4k in SPX i will be a lil more concerned. Til then..economy and stock market are humming along..U.S. markets are a nirvana..place of refuge for a little longer..imma as bullish as ive been since march 2009.
Nobody knows how long it will last. Knowing what we know about the nature of this so called bull market (the only one in history that has advanced on steadily declining volume ), the question for every intelligent market participant has to do with risk/reward analysis. It is very clear to me that the vast majority of market participants are woefully ignorant when it comes to that particular metric.
Vix still heading down. Imma doing great on these puts but not holding into fed meeting. Gonna take quick profits..Load up again on next spike!
Given how this market has refused to yield to bearish possibilities, I have to assume that wave 4 will not likely break 2790 level (maybe it pokes through for a day or two, but not by significant amount). Mid term elections lead to strong rallies in Nov to Jan period (with the exception of Nixon / watergate year). It will be difficult yo stay structurally bearish past the elections. I hope some sort of 5-7% correction happens before that !
That has been my thesis..running flat..shallow C wave to SIR PETERS 2790 or slightly below..and then back off to the races through 2019 in Wave 5. Imma target SPX at 4K as good spot for final top.
B wave should get to at least 3020 on SPX IMO
I am out of the bull put credit spread, not quite at zero cost basis but close enough.
If price continues higher, I will deploy another spread at higher strike prices.
This market remains fragile and very vulnerable to something quite ugly.
We still need a new high in N100 per SIR PETER so thats my exit signal. Everything in between is noise. Obviously..i will continue scalping..puts and calls..but my serious money is in calls for 2-5% upside.
Couldnt refuse the bullish setup on todays drop. Added some SPXL..3x bull SPX. Gonna pop IMO after Fed statement.
Good Luck!
S&P 500 Down 5 of Last 6 Fed Announcement Days according to Jeff Hirsch…
http://jeffhirsch.tumblr.com/post/178422712143/sp-500-down-5-of-last-6-fed-announcement-days
The smart way to trade FED blather is to wait for the initial market reaction and fade it, whatever the direction….the pattern is well established.
Only need a lil over 1% for new QQQ high. Yee haw..solid profits on my calls from QQQ 181 buy..up $4..and expecting another $2+..Thank you SIR PETER..traders gold!
Opening “stink bid” to buy QQQ 185 strike Oct 12 puts for 1.25
Current bid 1.97
I would think it should get there..on todays pop after Fed announcement..looking for my calls to soar..getting ready for the take off!
Be sure to take a parachute with you just in case 🙂
Will lock in some gains on pop..dontcha worry 😉
Reloading DIA Oct 12 266 strike puts for 2.40
Opened STC order for 5.00 even
Adding DIA Oct 5 262.50 puts for 0.75, 1/4 full load.
Full load at 0.72 cost basis. You’ve gotta “massage” those wily market makers! lol!
You have some mighty big cahonas shorting this market..i love your spirit..and enthusiasm though. I will join ya once N100 hits new high and Spx closer to 3k.
Bid up to 0.79.
I am a resonable man and would gladly take a Washington…you know what they say about pigs…! 😀
Charles
i do agree with your thoughts about a year 2020 bull market top
yet for much different perspectives than you ( i think anyways )
do you read martin armstrongs blog ? some of your posts make me think
you do so i ask .
based on armstrongs blogs, he says we see europe problems, then japan
and then it all comes to the united states.
we have yet to hear about the Japanese problems .
My interpretation is that money flowing around the world is just piling in
where ever it appears to be the safest . the us dollar is still the world currency
and is the only currency that can absorb the massive amount of money around the world. from a political perspective though i feel everyone is against trump because he is the outsider and is messing up the elite politicians plans and they want him out. i would not trade based on politics per say yet my thoughts are politically that the lack of confidence will begin here in the usa because of what trump is doing. it doesn’t mean he is doing anything wrong or right it just means he is disrupting the system. it can be economics or climate change etc…
he has called out the bullshit yet everyone has either been blind or brainwashed into believing our politicians have our best interest. With more and more people becoming dependent on government, they want their ” fair share ” so to speak yet anyone with half a brain knows the governments around the world are indeed broke. we now have those in power trying to protect their own pensions vs doing what is right for the average person. To add to this we have the world governments continuing their bad spending habits in a rate rising cycle. the effect on interest rates does not hurt the average person nearly as much as it effects the government debt payments. As rates rise the need for more money will force governments to create more taxes ( on the ” rich” of course ). As taxes continue to rise along with interest rates the economy will slow . This is already beginning to show up in home sales . The younger generations are already dealing with student loans debts .
When someone finally comes out and says nothing has really changed and the emperor has no clothes. the shit hits the fan and it gets ugly
just my thoughts
I have read Martin from time to time..he has some great insights too..I agree with your assessment of the political and global environment..I once heard the analogy that U.S. is the least drunk driver on the road so the capital is flowing to U.S. of A. Trump love or hate him is shaking up a system that needs to be shaken and stirred up. My economic outlook based on capital flows ties in with the 5th EW wave up. I think it should last 18-20 months based on wave lengths and time. Just my two shiny Lincolns.
The way i look at the fed meetings is you watch the dow ( my basis anyway )
10 minutes before the scheduled announcement you mark the price 100 points
above and below the market . on the announcement the initial swing is the fake out.
hence if you want to be long you buy the initial reaction approx 100 points below the market . if you want to be short you sell the initial reaction ( which would be a spike )
Verne
just a thought
the question is, was yesterdays full moon a high or a low .
i have no opinion on this im just posting it .
I always think its rather foolish..the Fed tells ya what its gonna do..they do it..and the market flips out.
Mr. Market so far seems to be ignoring Mr. Moon!
Maybe we see a ramp tomorrow but today’s attempt was weak.
BTW, exactly right about trading the announcement.
The FED is irrelevant and watching them is a complete wast of time. Rates will be set by what unfolds in the bond market and the FED will meekly follow for they have no choice. Bond defaults should commence in earnest next month as maturity dates arrive and rollover stresses issuers.
Bid up to 0.82.
Just a wee bit higher…!
Closed out yesterdays calls with 50% gain..Thank you Mr Market!!!
Looking for the calls to soar and you sold on a 2 point higher pop by SP futures? So is the soar finished?
The ones i bought yesterday expire today..imma expecting SPX to hit min of 3020 in the B wave. Holding all of my Oct and Nov SPY..QQQ..DIA..IWM.. and SPXL until N100 hits between 9700 and 9900.
My wave count from yesterday on the 60 minute dow is flawed.
it does not count as a clean 5 waves down . it does however
count math wise and time wise . i maybe missing something yet
to me this market feels bearish.
nothing solid to go on .
cash dow currently on an hourly timeline and testing the .382 price retrace
as well as the .382 time retrace.
the next timeline falls 30 minute before the close tomorrow.
im going to let the market do its thing until i have a better grasp .
that said we maybe entering a 3rd wave downward as i speak.
a C wave or 3rd anyways to the downside
I know no one believes me but this market is simply not going down until the banksters completely loose control of it, due either to some event that causes universal market panic, like a failure to deliver on PM contracts, some kind of trade blow-up like LTCM, or a massive default in the bond market. I think we are wasting our time trying to count small degree waves trying to determine if we have had a significant trend change or not. When that market turns down in earnest, EVERYONE will know what is unfolding. This kind of price action tells me the banksters are still firmly in charge and so all we can do is scalp the market ongoing whipsaws. At least that is the way I see things. If you cannot trade your opinion in my view it is not worth much…..
Verne, how did they loose control of the market for the feb corrections? thanks
They clearly did not!
They stepped in to arrest that decline and halted it in less than two weeks in spite of the volatility (more precisely liquidity ) crisis. Few traders really understand what happened during that decline and Chris Cole’s article on Zerohedge explains that it happend in the absence of a real tiggering event yet VIX set quite a few records over that period. It was a shot across the bow as vol instruments represent only about 10% of the short vol trade. The herd has absolutely on idea what is going to happen to this market, and it really is scary how clueless most people are.
there is a couple ways to show this yet this is the cleanest.
as i said there is a flaw in this count but from this view it does
come out clean. the difference is a 24 hour chart vs a market hours
only chart and this is the cash dow 24 hour chart which spaces the bars
differently .
we will see soon enough if this has merrit.
https://imgur.com/drzTiD1
im not going to agree with the comments on the fed nor mr moon.
the truth is always seen in hindsight .
wave count above paints a bearish argument .
yes a flaw since it cant be seen in a close only chart nor a mkt hours chart
with my software . yet …….. we got the fed announcement we got the initial re action and the fake out . wave count included.
right or wrong the mkt will decide
Sold 266.50 puts for 0.90. Close enough for government work, as they say.
Let’s see if we get one more phony ramp but I seriously doubt it. Things looking pretty anemic. I do hope they spike it up one more time…. 🙂
cash dow 3 minute chart
these are looking like impulsive waves down.
going to be an interesting day tomorrow .
https://imgur.com/HXXE7Uk
ive got same count as you on the spx cash. sold my calls from this am for almost a triple on the c wave spike(i mean FOMC announcement) and bought some oct 10 291 puts on the retrace(wv ii) of the first small impulse down. planning on selling them at 286 in 1 or 2 weeks depending on how fast this wave is.
im done for today.
everything appears to be working which is nice to see.
tomorrow will be an interesting day no doubt.
im seeing 5 wave declines and the doubts keep being confirming.
3 minute chart mind you yet the hourly fits aswell
https://imgur.com/AL4YVJm
im thinking the decline has begun.
expect more downside pressure and expect it to increase
Hi Joe..I have the same for the count..2(c) finished…after fed. ..I agree about tmo…
I have been making quite a bit off dust..and tbt don’t know if you guys trade those..
im working 2 bearish wave counts now.
ill follow them both over the rest of the week.
both imply more downside , one more bearish than the other
yet the math is working on both .
we have at a minimum a short term top in place.
thank you Mr Moon 🙂
Ringing the register on IWM puts….’bout time!!!! 🙂
Glad I sold many of my calls today..and was outta my vix puts..but wow..still got my clock cleaned..good news..i lived to tell about it..and get to fight another day..back to the grind tomorrow!
The more bearish count implies a gap down on the open tomorrow
on the cash dow , a perfect scenerio would have the cash dow
open down around 80 points at 26311-26304 . if that actually happens
it implies we are in a minor wave 3 of 3 .
it does not significantly change the wave counts im looking at .
im having an issue with the ” flaw ”
we may have seen wave 1 and 2 yesterday which means today’s high
was the high of wave 2 of wave 3. a gap down open as noted above
will imply more waves to the downside in a further developing wave count
before its completion .
not sure i said all that correctly yet thats my thoughts as of the close.
26304.91 will become a short term pivot tomorrow . a poke through it is fine
yet the level stands as tomorrows pivot.
26208 to 26168 are the next lower levels.
i dont see anything at this point below those lower levels .
Gaps down are caused by aggressive short selling, especially of leveraged positions.
This market is falling under its own weight as there are no sellers left! The gaps will come later….with the fear…!
Lastly
the bullish count .
watch the cash dow around 730 am ( just after the first hour of trading )
look for a bullish set up . go long ?
no comment on details.
1 2 3 a b c 1 2 3 does equal A B C .
not my preference yet …….. not larger 5 wave decline at this point despite
the minor short term waves
tomorrow is another day
I think the metals are gearing up for the final wave down. I will be closing my SLV short calls the next few days.
https://www.youtube.com/watch?v=PRCc4xFRWrw
Randy’s update. Worth a look
Hey man, we all take our lumps every now and then…😇
verne
you may be correct on SLV
my bias is longer term up yet so far no proof of a bottom at this point
Joe, the dumping of naked short contracts in the Gold and Silver futures markets is one of the most powerful bottoming signals I have ever seen. You end up, on a fifth wave down, with Commercials holding their biggest long position, at the lowest price. It happens every time! Amazing traders don’t anticipate this….!
I know some folk who do not believe in price manipulation consider this “capitulation selling”, but retail investors do not dump naked short contracts into the futures markets by the thousands! DUH! 🙂
Peter T
Not sure if this article helps you with your book yet just throwing it out there.
it is from 1989 and its about how some countries could be flooded and gone
by the year 2000 do to of course ” global warming ”
https://www.apnews.com/bd45c372caf118ec99964ea547880cd0
And to think it was really Trump who caused these storms ?
https://www.washingtonpost.com/news/opinions/wp/2018/09/11/yes-you-can-blame-president-trump-for-hurricane-florence/?noredirect=on&utm_term=.f343ed551e8c
You cant make this stuff up
There’s an awful lot of b.s. out there … lol.
Verne
The banksters have never had control of these markets : )
The real fear though will come when they realize they have no control
Ya..that will be a good day..The Fed has to be one of the biggest scams going.
I giess we ate not looking at the same charts Joe.
Thst is a pretty incredible statement to make considering how easy it is to overlay an SPX price chart with the Q.E
svhedule of the last ten years, an exercise done by numerous chartists over the years.
You’ve gotta be kidding me!!!!! 😉
BTW, tell that to folk trying to short this market the last ten years. If they failed to recognize the banksters were firmly in control, they are broke! Where do you think the phrase the “Bernane Put” came from.
But don’t you worry. They will not be in control forever.
I was in stitches over a headline on ZH that said:
“The FED always raises rates until they break something!” 😀
The only thing that can overwhelm CB buying power is the bond market and that is where the carnage will begin. Stand by!
Verne – Do you mean the treasury market or credit market when you say bonds ? I think the last market to top out will be the treasury market. Given that other CBs have tried it, the FED will take treasury yields negative. Only in a 3 of 3 down do I see treasury markets breaking down. We don’t even have a 1 of 1 yet. Most treasury bears will likely loose their shirts. There is a reason shorting Govt bonds has been called the widow maker. That’s the market where a CB has the most power. If I had to guess, US debt to GDP will be about 3-3.5 and rates would be -0.25 to -0.75 before there is any pressure on the CB. Just look at BoJ – they can fund the whole government as long as inflation is low. Its when inflation gets out of hand that the CB looses.
Primarily the dollar denominated bonds of foreign countries, especially so-called emerging markets, and corporate bonds. The defaults on both fronts are going to be massive.
Short term treasuries are going to be one of the safest places, other than cash, to be for at least a few years.
Imma back to call buying..snagged the SPY 291s at open for next breakout.
N100 needs less than 1% to new high..only bout 70 points.
Now just 50 points for N100. Woo hoo! Thank you Kindly..SIR PETER..Traders Gold..for great trade idea!
Out of my 291 calls for 75% gain..Not too shabby for 30 min of work 😉
In at 44 pennies..and out at 77 pennies..could held for double but wait for next buying opportunity..have learned..dont get greedy!
Filled on QQQ “stink bid” for October 12 185.00 strike puts.
I know these banksters SO well!!!! 🙂
Even after we have a confirmed trend change, the strategy of buying sever declines will continue to return quick profits for at least two reasons.
First, the banksters will continue to try and arrest market declines, hoping to maintain bullish sentiment.
In bear markets there are always those who buy the dip until the very end! 🙂
“Slope of Hope!” 🙂
N100 got close to a new high today..as they say..we not far away! Though SIR PETER said N100 could get to 7900 and thats almost 5% higher..that could get SPX to my 3020 target!
Still about 125% long..QQQ..SPY..DIA..SPXL..IWM..LABU..and about 50-60 stocks. Still looking like a Nov trend change IMO. Will be long til Nov or confirmed trend change.
Yep. It does not look to me like we have a turn. That wave dow yesterday is not what I expect of a turn at this degree. I think the full moon was a bust! Selling puts to make bull put spread. Looks like higher prices ahead mateys.
😊
Same thoughts this morning as the other day
cash dow
26304.91 will become a short term pivot . a poke through it is fine
yet the level stands as the pivot.
26208 to 26168 are the next lower levels.
i have no intra day time lines today . i can only project time using clean 5 wave movements. its great when they work yet i have nothing intraday at this point
to go with.
Verne
if you look back in history of usa debt vs the economy you
will also notice that when the united states is in debt the economy tends to boom.
when those debts get cut back the economy suffers.
going into the 2000 top the news was we had a balanced budget : )
then we went into recession and bush 2 increased the debt more then all previous presidents combined. it lasted for a bit . then came the bailouts
tarp qe etc….. and Obama did the same as bush 2 and increased the debt more then all the previous presidents combined and yippee happy days were here again.
the we had negative rates and qe from the ECB
also japan came to the same decision and went further into debt.
we can go back to 1980 and say the Reagan began this debt cycle
At some point in the not to distant future all governments will be competing
for money to keep themselves afloat .
you are correct when you wrote :
Primarily the dollar denominated bonds of foreign countries, especially so-called emerging markets, and corporate bonds. The defaults on both fronts are going to be massive.
The safest place to be ????
i don’t think any place will be safe unless maybe just being short
the market .
Short term treasuries maybe safest as you say yet that doesn’t mean
you will actually get your money back when you hope to. to me that
is not safe at all .
All governments eventually default
This website is for educational purposes relating to Elliott Wave, natural cycles, and the Quantum Revolution (Great Awakening). I welcome questions or comments about any of these subjects. Due to a heavy schedule, I may not have the time to answer questions that relate to my area of expertise.
I reserve the right to remove any comment that is deemed negative, is unhelpful, or off-topic. Such comments may be removed.
Want to comment? You need to be logged in to comment. You can register here.