
Market Update for Friday, April 28, 2017
Short tonight, for a change. The Chart Show was extensive.
Market Update for April 28, 2017  |
 |
Make sure you zoom the video to full size with frame expander (arrows) in the bottom right hand corner and also set the quality to as high as your web connection allows. This is an HD quality video so the best viewing is at that level. |
_______________________________
Market Update for Thursday, April 27, 2017
CHART SHOW signup for Thursday
A bit longer tonight AGAIN) … about 17 minutes. I put in a short lesson on flats.
Market Update for April 27, 2017  |
|
Make sure you zoom the video to full size with frame expander (arrows) in the bottom right hand corner and also set the quality to as high as your web connection allows. This is an HD quality video so the best viewing is at that level. |
_______________________________
Market Update for Wednesday, April 26, 2017
A bit longer tonight … about 17 minutes. Today was a big change in the market and took some working through.
Market Update for April 26, 2017  |
|
Make sure you zoom the video to full size with frame expander (arrows) in the bottom right hand corner and also set the quality to as high as your web connection allows. This is an HD quality video so the best viewing is at that level. |
_______________________________
Update: Tuesday, April 25, 8:50am EST
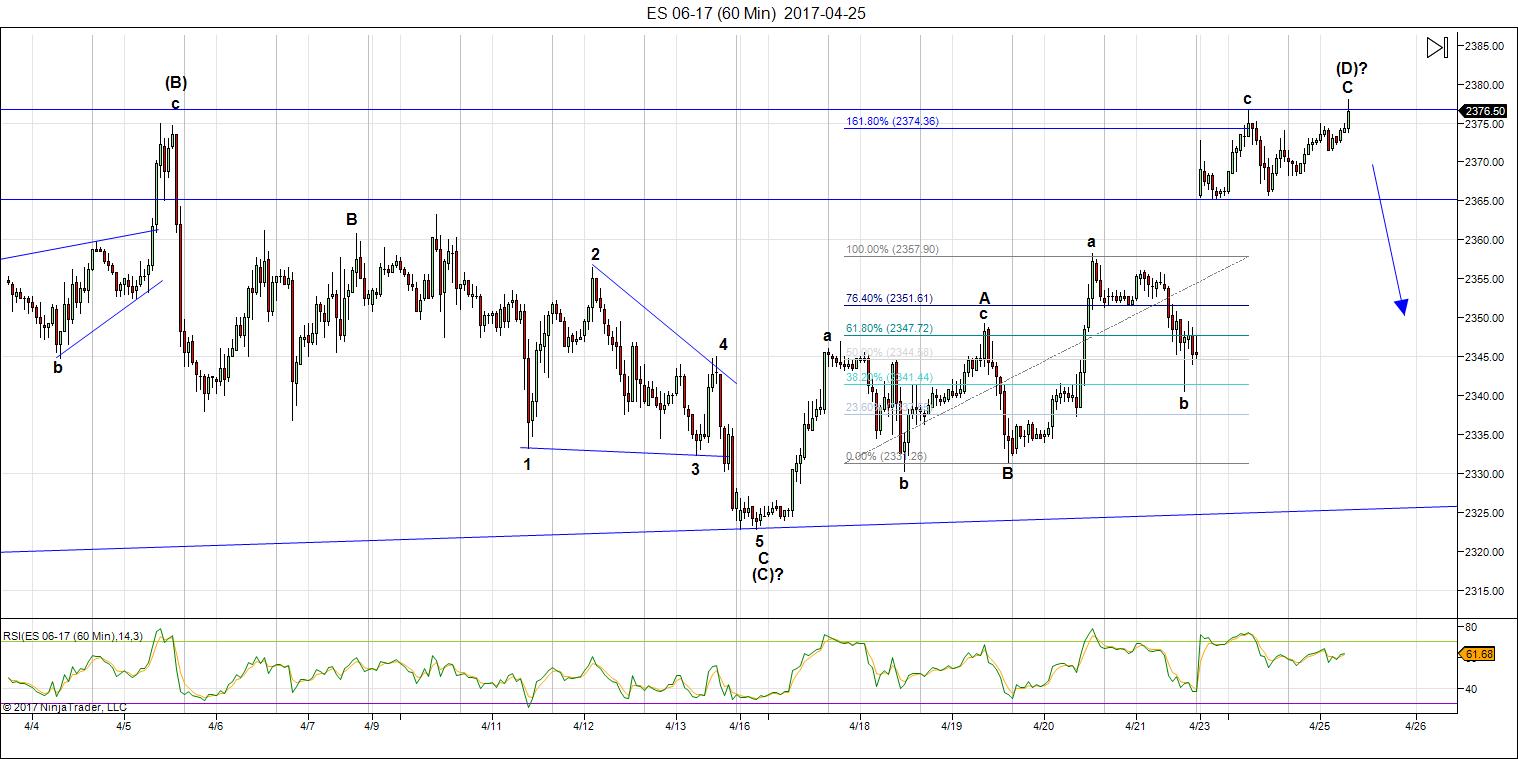
Above is the 60 minute chart of ES. We have what’s shaping up to be a double top this morning and I expect something similar in SPX at or shortly after the open. This may result in an expanded flat, which simply means that the top of the C wave (where we are) is higher than the A wave. The wave down from here should be in 5 waves and should go to a new low.
I think the triangle idea is out, certainly if SPX opens at at new high.
USDCAD has hit its target at 1.36 and I’m expecting a reversal there, as well, but if you’re going to play either one, be careful with your entry. Safest to wait for one wave of 5 down to a previous 4th wave and then a second wave up in 3 waves.
___________________________
Market Update for Tuesday, April 25, 2017
Market Update for April 25, 2017  |
|
Make sure you zoom the video to full size with frame expander (arrows) in the bottom right hand corner and also set the quality to as high as your web connection allows. This is an HD quality video so the best viewing is at that level. |
_______________________________
Update: Monday, April 24, 2017, ~9:40am EST

More surprises! Above is the 60 minute chart of ES, showing the bullish jump to the 2377 area, a result of the French preliminary vote. We seem to have morphed into a barrier triangle … s0 far. The next move should be down into the E wave—the wave up is certainly in three waves.
I want to see what happens to the SP500 pattern before I absolutely confirm the barrier triangle. In this index, we haven’t quite tested the previous high, which we’d have to do for barrier pattern. At the moment I can’t think what else could be taking place. If this is indeed still a triangle, the target for the E wave bottom in ES would be around 2327.
Currency pairs jumped a bit, but as I mentioned in a comment right after the open, they all appear to have traced out 3 wavers before the jump, so I expect them all to slowly come back down as the E wave unfolds in the US indices. It looks to me as though that will set everything up for a potential turn into the 5th wave in the US indices and the C wave in USD currency pairs at the same time.
EURUSD has dropped to the 38% retrace level of the move up today in what looks to me like 5 waves, and we look to have a second wave retrace, but it needs to start coming down, which will help confirm the move in ES. It it does exactly that, the fibonacci ratio lines hit 1.049 exactly, which is the larger 62% retrace target which has been my preferred target all along. We’ll see what happens.
I was long ES over the weekend. I reversed to a short at about 2371 just after the market opened.
My predictions for gold and silver remain intact—they moved slightly but not enough to change the picture.
__________________________
 |
Interview Playback: |
Last weekend here, I wrote a post on combination waves. I’ve also written about how much I dislike fourth waves for the very reason that (at this high degree of trend) they are made up of multiple patterns. The challenge becomes figuring out the patterns early enough to take advantage of them. It can often be difficult.
My top level “guess” based on what I was seeing, was that this second pattern would turn out to be a contracting triangle (info below). Although technically we can’t absolutely confirm the triangle until the D wave is in place, at this point, there’s really no other pattern it could be. This gives us some high probability trades before it’s complete.
I’ve fleshed out the contracting triangle pattern in more depth below.
Currencies are relatively quiet at the moment. The next major move for them will be the final wave to the longer terms targets that I have mentioned in previous posts and videos. Nothing has changed in that regard. They may make that turn at slightly different times. I will try to keep on top of them for you. I’m expecting a transition into the final 5th wave in the US indices later this week.
Gold, silver, and oil are all heading down.
______________________________
Contracting Triangles
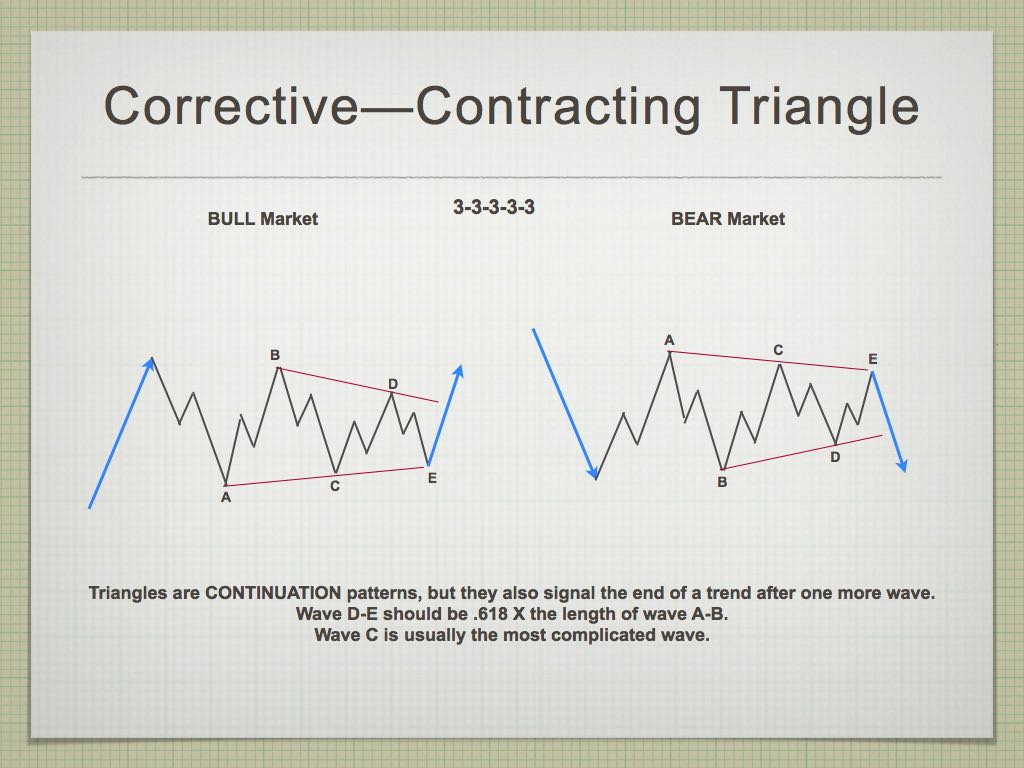 Contracting triangles are the most common type of triangle. When they’re in the fourth wave position, they predict an end to the entire trend with one more wave (fifth wave).
Rules (these are “hard” rules; they cannot be broken):
- A triangle always subdivides into five waves.
- At least four waves among waves A, B, C, D, and E each subdivide into a zigzag or zigzag combination.
- Wave C never moves beyond the end of wave B, wave D never moves beyond the end of wave C, and wave E never moves beyond the end of wave D.
- A triangle never has more than one complex subwave, in which case it is always a zigzag combination.
Guidelines (guidelines can be broken but it’s rare that they are):
- Usually, wave C subdivides into a zigzag combination that is longer lasting and contains deeper percentage retracements than each of the other subwaves.
- Sometimes, wave D subdivides into a zigzag combination that is longer lasting and contains deeper percentage retracements than each of the other subwaves.
- Sometimes one of the waves. usually wave C, D, or E, subdivides into a contracting triangle. Often the effect is as if the entire triangle consisted of nine zigzags.
- About 60 percent of the time, wave B does not end beyond the start of wave A. When it does, the triangle is called a running triangle.
- Sometimes. either waves A and C, or B and D will end at almost exactly the same level. When the flat line is on the top, it is called an ascending triangle; when it is on the bottom, it is called a descending triangle (both of these are barrier triangles).
- When wave 5 follows a triangle, it is typically either a brief, rapid movement, or an exceptionally long extension.
Opportunities this Week
There are opportunities this week:
- ES/SPX (up in D wave and then down in E wave)
- AUDUSD (short)
- Gold/silver (short – watch video)
______________________________
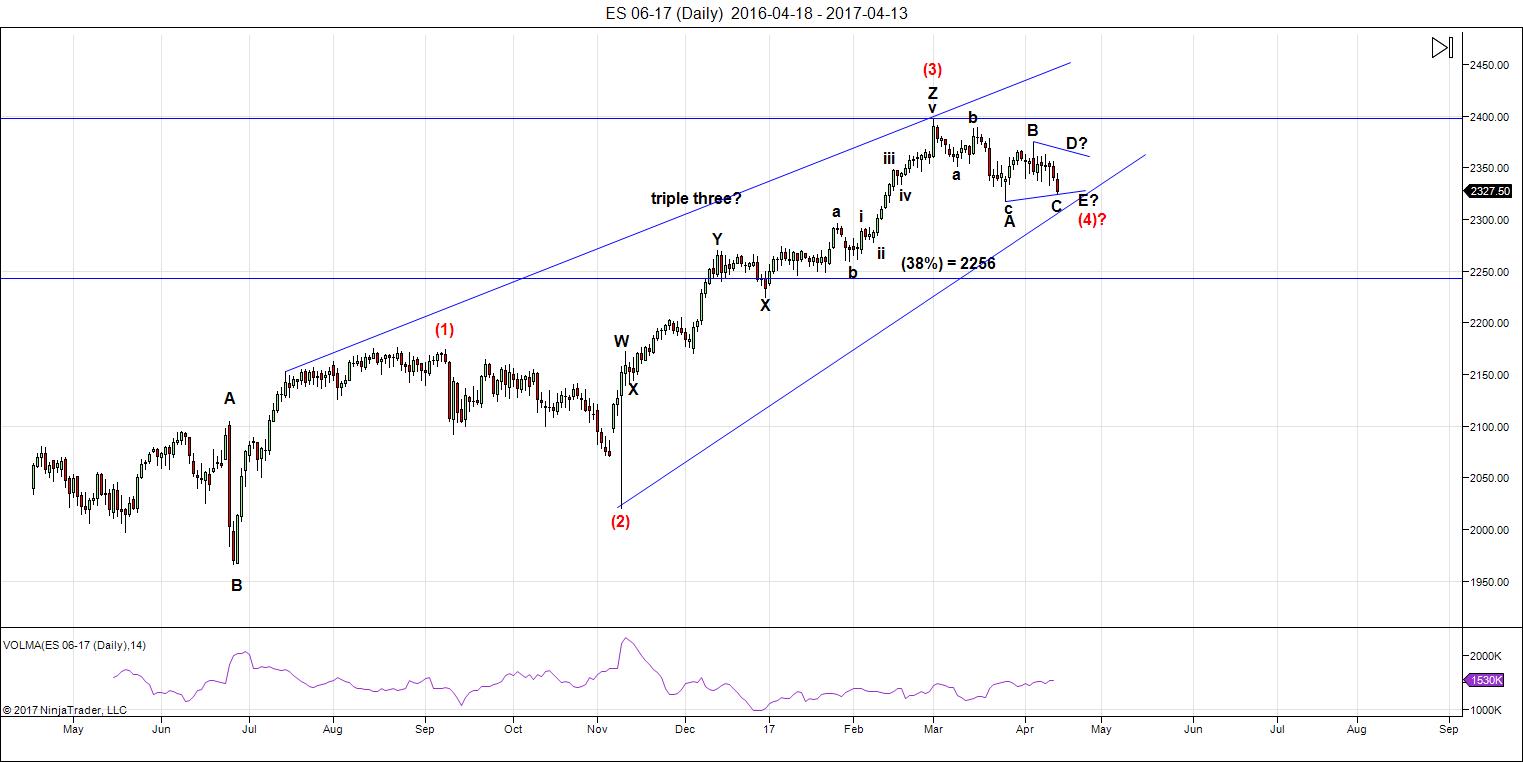
Here’s the latest daily chart of ES (emini futures)
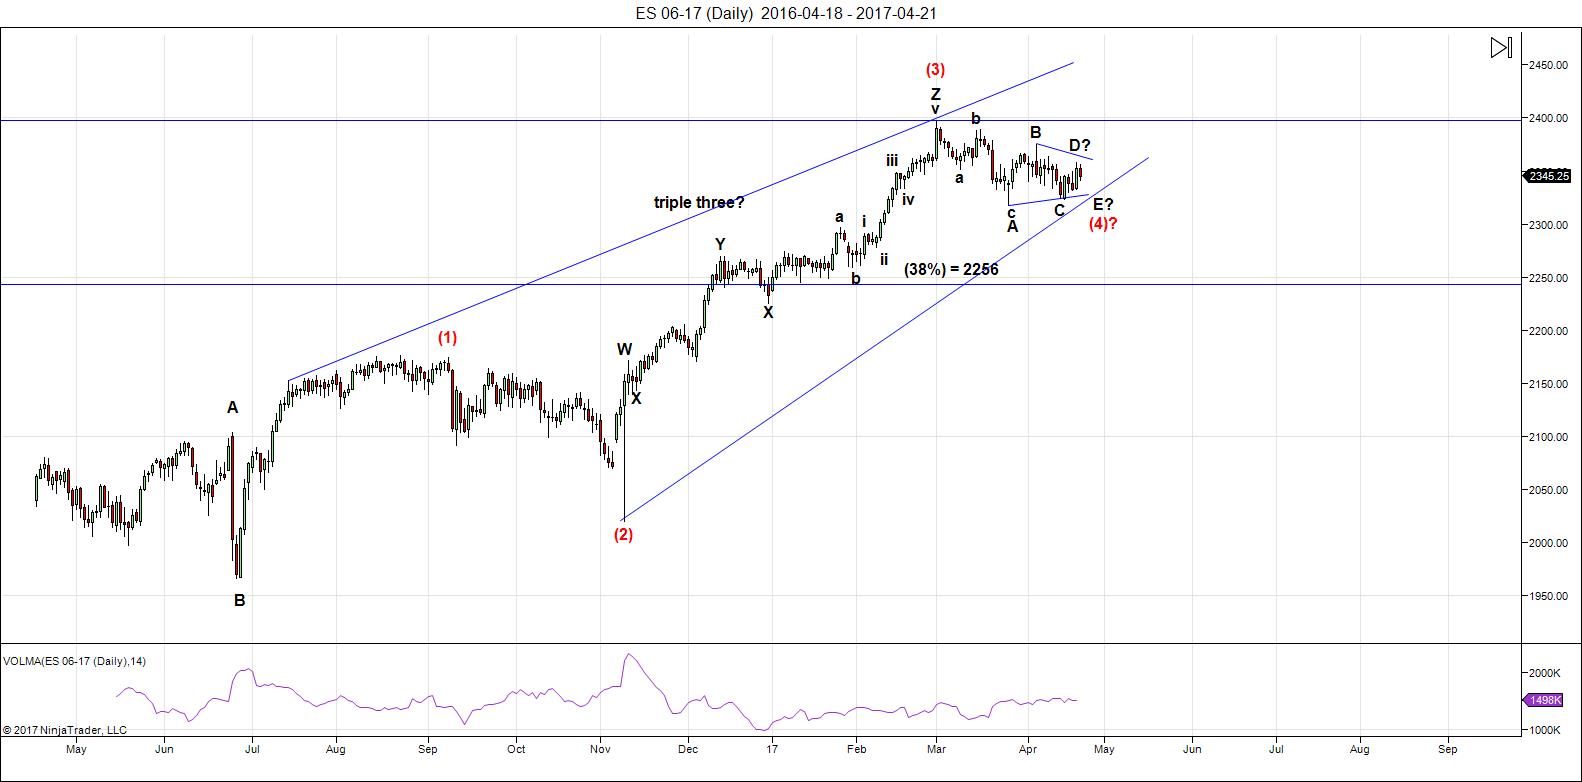
Above is the daily chart of ES (click to enlarge, as with any of my charts). We continue up in a very volatile D wave of a contracting triangle, which should be the last pattern of this fourth wave combination, and lead to the final fifth wave up.
Triangles in fourth wave combinations are “terminal” patterns—there will not be another pattern following it within the combination. While some combinations contain three patterns, when you see a triangle, you know you’re in the final pattern. The triangle will play out in 5 waves (of three waves each). On this one, we entered from the bottom (the fourth wave low) and so we’ll exit from the top.
I’m looking ahead to the area of April 26-27 for a possible turn up into wave 5 (April 25 is an Andy Pancholi turn date for SPX and there are other asset turn date clustered about the 25-27 timeframe).
Summary: We’re in the final pattern an ABC 4th wave correction. We’re in the D wave of a triangle. The target for the top of D is 2370 (possibly reaching that target on Monday, April 22) and the E wave still has to play out.
After completing the larger fourth wave, we’ll have one more wave to go, which could be an ending diagonal as a fifth wave. The long awaited bear market is getting closer.
_______________________
Here’s the latest HOURLY chart of ES (emini futures):
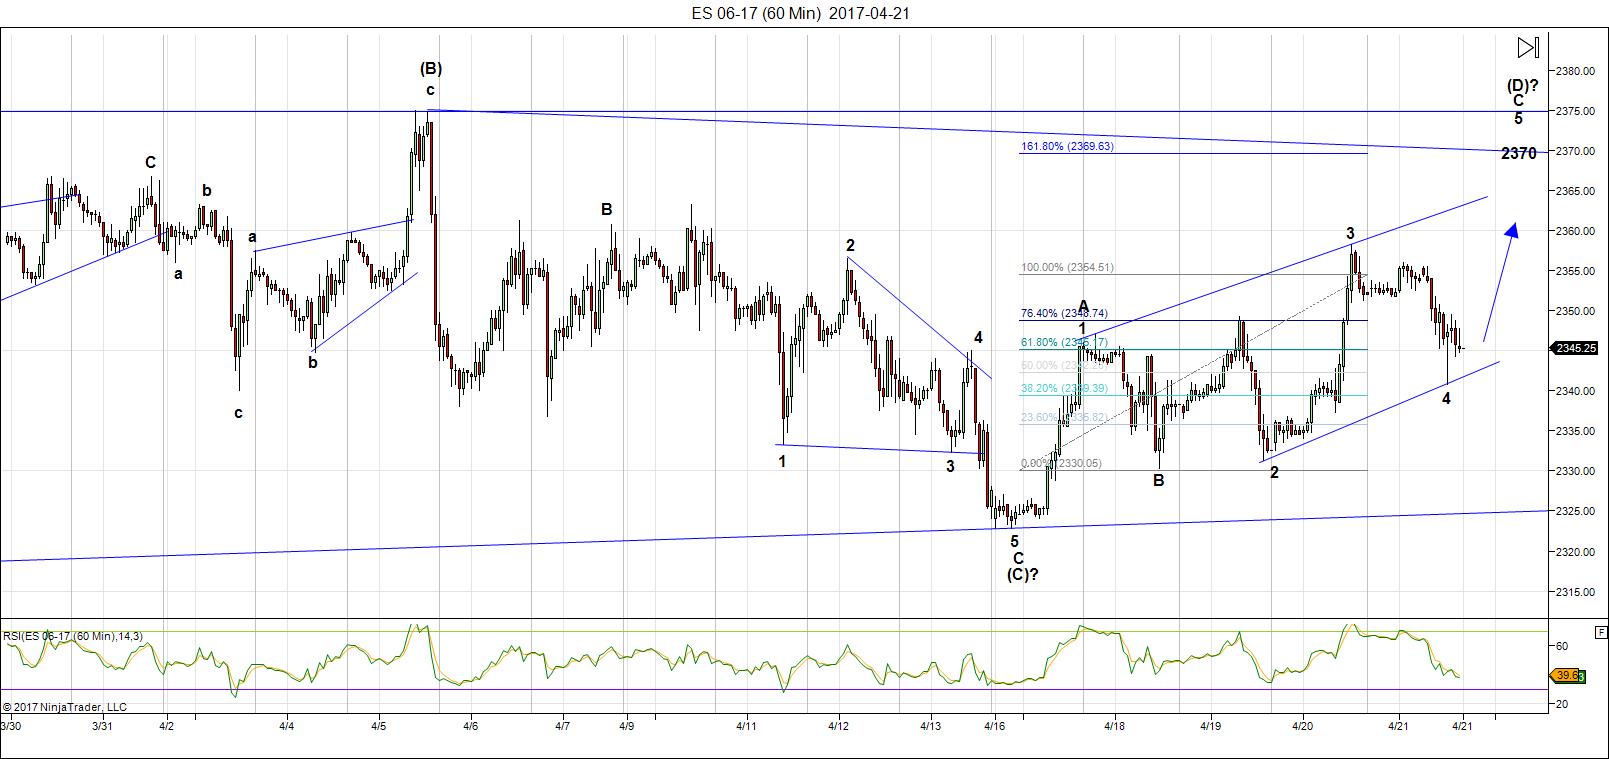
Above is the 60 minute chart of ES (click to enlarge). Please watch the video to get the full story on what’s happening short term.
This chart shows what appears to be an unfolding contracting triangle. We’re in the (D) wave on the chart. I put the target at 2370—1.618 X the A wave from the bottom of the triangle (marked (C)).
The final set of waves up in the past week looks like an ending diagonal, but the trendlines don’t seem to be converging, so I’m more inclined to just call it a channel. You can see the five marked waves in the chart above—I’m expecting a wave 5 up starting on Sunday to the target.
So, look for a continuation up on Sunday through Monday perhaps.
_____________________________
Some housekeeping:
Andy Pancholi Turn Dates (April, 2017)
- SP500: Tu25
- EURUSD: F21, Th27
New Free Blog Post: Elliott Waves and Probability
The CHART SHOW signup is live for Thursday, April 27. You can sign up now in the usual spot: webinars
________________________
Here’s a video overview of the market for Monday, April 24, 2017
Market Report for April 24, 2017  |
|
Make sure you zoom the video to full size with frame expander (arrows) in the bottom right hand corner and also set the quality to as high as your web connection allows. This is an HD quality video so the best viewing is at that level. |
_______________________________
Charts Going into Monday
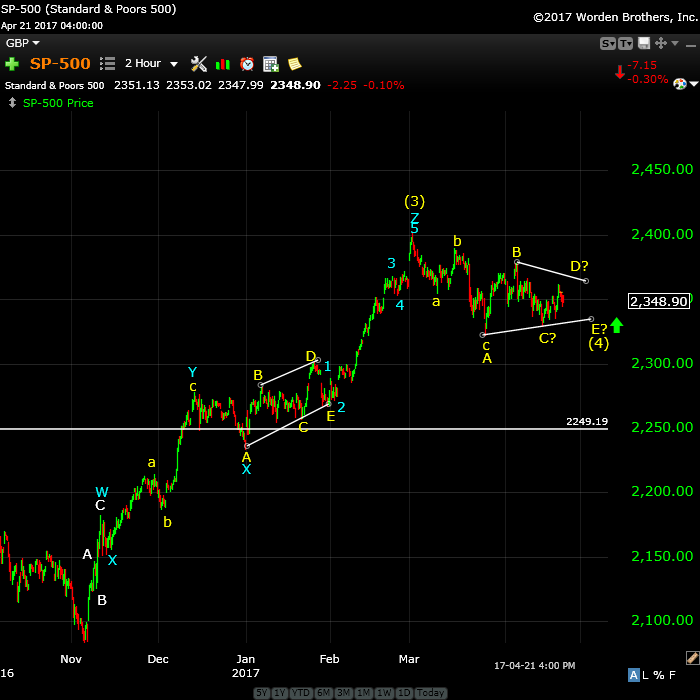
Above is the 2 hour chart of SP500. As with ES, we are continuing up in the D wave of a triangle. The target for SPX is ~2366 (the C wave of this move at 1.618 X the length of the A wave up—not shown here, but are in the video).
The final fifth wave will begin after the fourth wave ends (at E) of this triangle plays out.

Above is the daily chart of the US Dollar. No change here in terms of my long term prediction—we’re heading down to the 91.88 low.
On a near term basis, the retrace up that I predicted may may have ended. We’ve passed the 62% retrace level, so we could continue down from here, but as with EURUSD, there’s the option of one more leg in this wave ii before we turn down in the larger wave 3 (opposite direction, of course for EURUSD).
Longer term, once we continue back down, 1.618 X the first wave, (the target for the third wave) is somewhere close to 94.83. The movement of the dollar determines to movement of just about everything else these days. The longer term target for this wave down is 91.88.

Above is the daily chart of EURUSD. The bigger picture is that we’re headed up towards a target of 1.16 (and change) before we get a really major turn down (a fifth wave).
On a short term basis, the predicted turn down is still in progress. From the top of wave 1, we’ve traced out an a and b wave. We should have one more wave down to a target of 1.05-1.0437 (the two horizontal lines on the chart).
If it drops to that level, it would be an excellent entry for a multi-month rise to 1.16. However, that 1.04369 level must hold.
More in the video, of course.
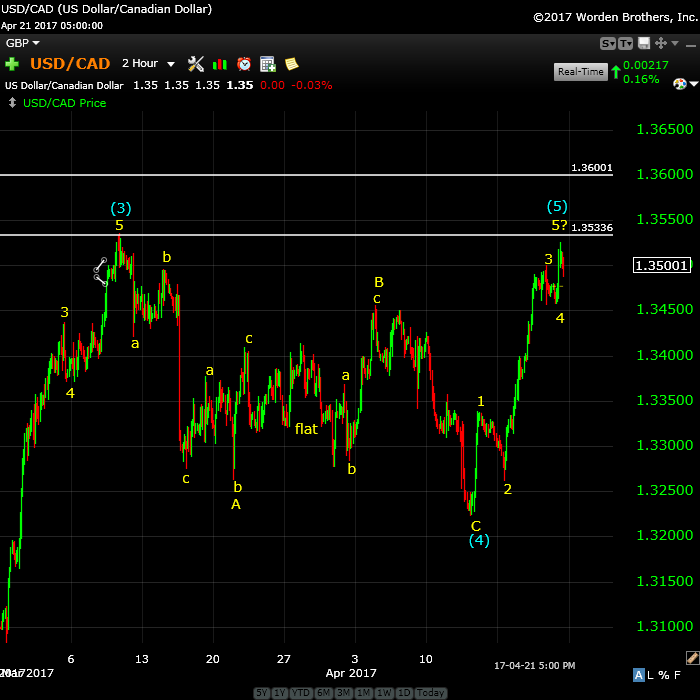
Above is the 2 hour chart of USDCAD. Well … we’re getting close to a turn-down. The RSI indicator has a large divergence in just about every timeframe.
Looking at the subwaves, I’m torn between a top at 1.3536 (the previous wave blue (3) high or a final push to 1.36, the larger B wave high. One of these will lead to a multi-month wave to 1.19. I would expect the turn to coincided with that of AUDUSD, as they usually move together. It may also coincide with the end of the triangle in the US market.
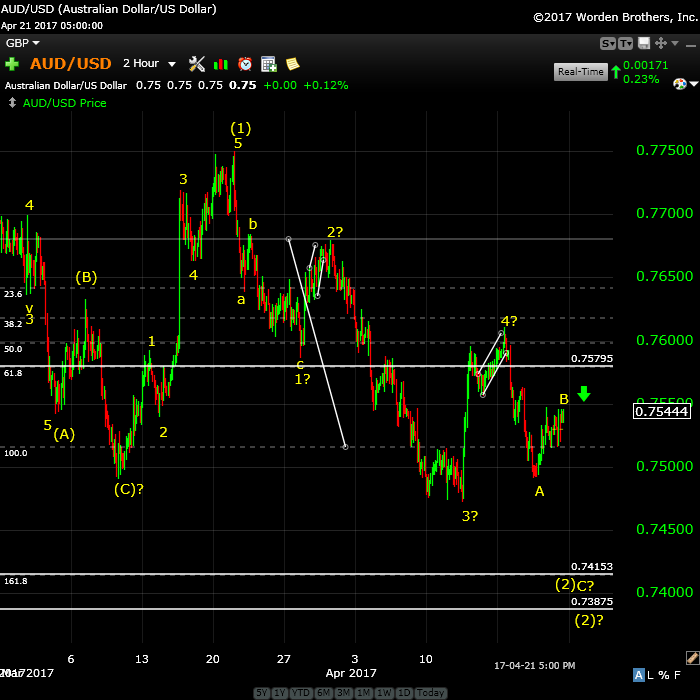
Opportunity. Above is the 2 hour chart of the AUDUSD. This week we retraced to a level that suggests another “B wave” or our journey down to the target..
We’re continuing down to one of two targets. The first on (.7413) is the point where the C wave is 1.618 X the A wave. the lower horizontal line(.73876) is the 62% retrace level.
One of these will form a bottom, which will be a perfect set-up for a long entry for the final wave up to the eventual target.
I’ve an eventual top target of .828 for this pair, which is just shy of the 38% retracement level of the entire larger wave down (from the year 2011), which would make this wave 4.
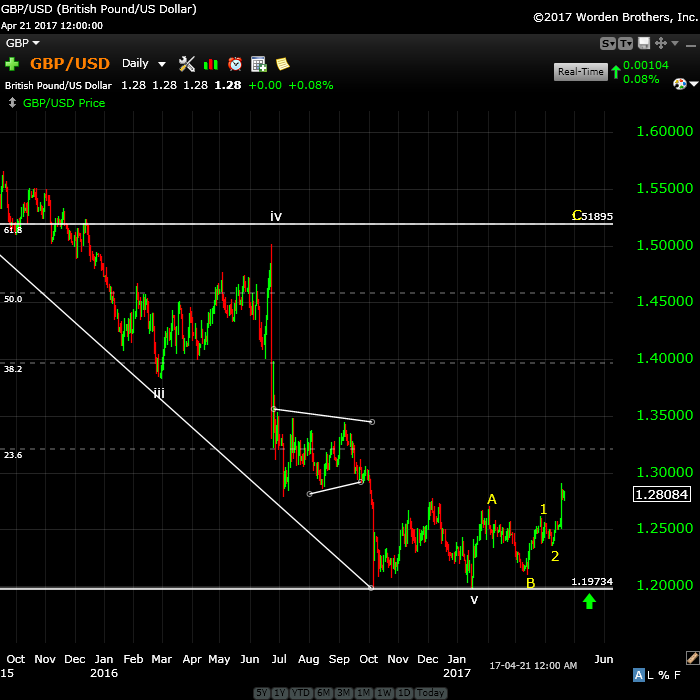
Above is the daily chart of GBPUSD. This week, we moved up to a new high. This confirms wave 1 (the motive-looking wave that I was concerned about) and gets rid of the uncertainty about medium term direction.
The second wave in this case did not retrace 62%, which is not necessarily unusual because this is a corrective set of waves, but it obviously makes analysis more difficult and I’m not about to make a call on anything that I’m not sure about. I’m sure now, and the direction is up. The question becomes, “What is a safe place to get on board.” That depends upon your comfort with risk. The less risky spot would be after a g0od-sized retrace (in the neighborhood of 62%).
More information on the short term prognosis in the video.
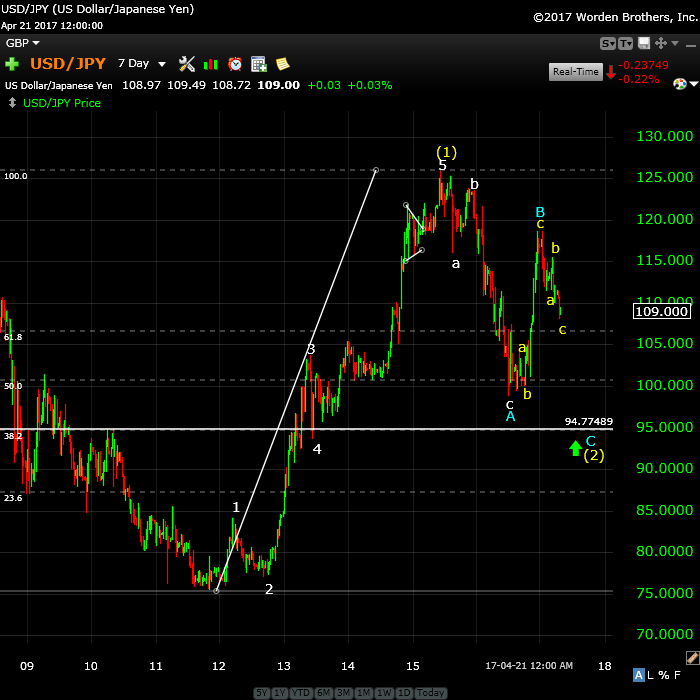
Above is the 7 day chart of USDJPY. I have changed my perspective on this currency pair after zooming out to a 7 day chart to see what was going on at a much higher timeframe. USDJPY has not provided the setup I expected and so it needed a rethink.
From 2012, we traced out a five wave motive pattern to about 126.00. We’ve retraced back down in three waves to complete blue A wave. However, this wave did not travel the expected distance of 62% of the motive wave up. All the waves in this retrace pattern are corrective, so it’s difficult to tell where it’s going next. We need to wait and watch to see happens. There’s no reliable set up, at the moment.
The blue B wave up is in three waves, so it should retrace. I would like to see a drop to the 62% level. How we’re going to get there is the question.

Opportunity. Above is the daily chart of gold. No real change here since last weekend. We reached up beyond expectations, but the structure up looks to be in three waves (as is silver). Silver is weaker and has only managed a double top. I expect a drop to at least a new low. More info and a chart of the subwaves are in this weekend’s video.
I’ll communicate a target once we see an A wave (or first wave) down.
When we reach our target, we’ll turn back up. The final upside target is around 1585.
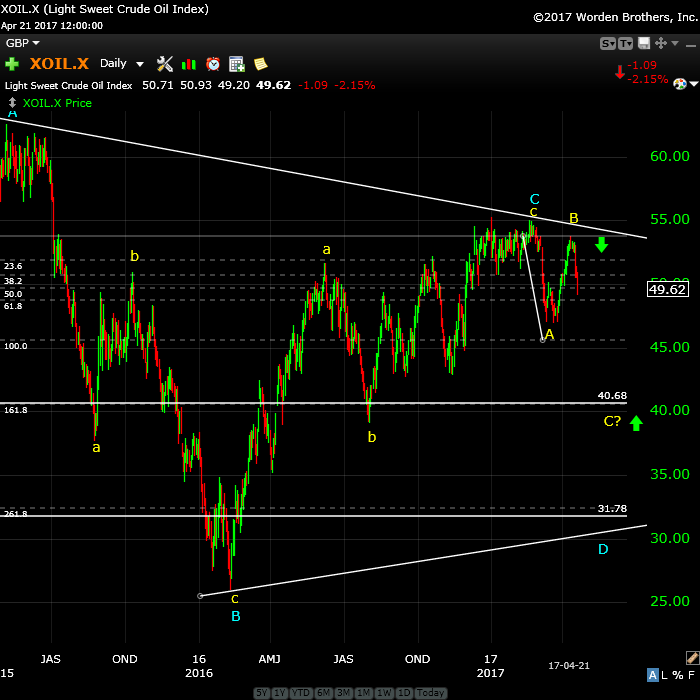
Above is the daily chart of WTI oil. Oil has dropped nicely into the start of the C wave and I expect it to continue down. We may get a smaller b wave along the way, but the target for the present time is ~40.68.
The longer-term target is around 33.00.
Finally, we should get an E wave up to the upper trendline to complete the larger pattern. That would be followed by a final 5th wave down to a new all time low.
Good trading!
_______________________


There’s a big reaction to the vote in the currencies, most notably EURUSD. However, all these waves up are corrective, so I’m unconvinced that we’re going to stay where we opened. I think this move is more likely to retrace.
Looking like we are finally onto wave 5 in ES/Spx!
No we are wave 4 as per Peters triangle. So we should head right back down and then wave 5. If t breaks the triangle top then potentially we are in wave 5
I’ve updated the chart at the top of the post. So far this morning, ES looks to be in a barrier triangle, but I need SPX to confirm this with a double top, which we don’t have yet. The waves up everywhere look corrective (currencies, too), so I can’t see a continuation up at the moment.
Just let me know when its time to short the es
No idea what’s going on at the moment. I would like to see a good-sized bounce or a break down below 2365. I’d prefer the bounce at this point. I may be in and out for the second part of this session. I got out of ES due to the indecision and the fact that we have a wave down to the previous 4th and it looks like it needs to bounce.
I’d like to see this bounce up to around 2372 because it looks like we have 5 waves down to a previous fourth. That would be a likely short.
I have a stop for entry short at 2372. Watch for a double top in SPX.
So are you back short now or did it not hit 2372? I’m short FTSE as it’s pretty much at the 62% retrace of the drop from 7400 and also short ES.
I got short at 2372. I would bet we have some bad news coming in terms of earnings. This may be a flat unfolding, what flavour, don’t know yet.
With the most recent action today, there is also the possibility that we’re tracing out another flat. With 5 waves down, the flat is more likely, but it depends on what happens with this wave up in the SP500. Both scenarios require another large wave down, but the targets will change. A flat will take us to a new low while the triangle won’t.
USDCAD looks like it’s getting close to a top.
The Market Update for Tuesday is live at the top of the post.
Hi Peter
anything getting close to get into today.
I just sent an email blast. Chart of ES is at the top of the post.
what time frame in minutes are you looking at for a 1 wave down for usd/can
5 minute chart ?
1-5, somewhere in that range.
First wave should come down to somewhere around 1.3542.
sorry peter
i just dont read these graphs as well as you
are we on the third wave up for usd/can
We would be finishing the fifth wave of a B wave.
Both ES and SPX are at the previous flat highs, which would be a good place to turn over, which would mean this entire fourth wave so far is a gigantic flat. The wave down will be a big one, if that’s the case.
Isn’t it looking more like Wave 5 as Nasdaq is now at all-time highs?
Should be clearer in the next few days. I personally think this wave 4 has been too short so could still have a leg to the lows. I can’t see wave 5 lasting till September to be honest if it has already started.
I’m still long SPX from 2325 and using that as my stop. I’m expecting 2450+ next. That’s how I’ve been trading at least.
NQ et al are at the top of 3, as I’ve been saying. No change there as far as I can see. Looking for a fourth.
By the action on EURUSD, there’s a good possibility it’s bottomed and is heading up longer term.
This may be a major turn and currency pairs do not seem to make their targets these days, so be careful if you’re in this market. It’s become a rather dangerous (not that it wasn’t before!)
Currency pairs are moving against each other in a rather unintuitive manner.
Does this comment on Eur/used mean short term still heading down to 1.05 or so but may not make it and then heading up long term As stated in video last night.
Heading up. I don’t think we’ll see a new low. This wave up in EURUSD today looks motive.
GBPUSD is also heading up (but we know that). These currency pairs are all turning one by one. But they’re not doing it in a way that makes it easy to pick entries, and they tend to turn rather dramatically.
Today is also Andy’s turn date for the S&P
John,
There are a slew of turns over the next couple of days, so I expect a process. Takes some patience, for sure.
I’m still looking for a turn down at today’s highs, which are also the tops of the previous flat, which would make this a regular flat and head to a new low.
It’s a process, but we’re close to a turn.
I’m expecting to see double tops at today’s highs.
In ES, a turn at this level and a wave down which is 1.618 X the length of the A wave down from the top of (3) would take us to 2256, which is exactly the 38% retrace level of the waves up from ~2021 by my quick calculations.
Peter
Any thoughts on how long it will take to 2256 days weeks months?
Darin,
I’m not saying it will get there. The C wave of a flat doesn’t usually reach that distance, but it may get close. No, I don’t have a projection in time because I haven’t yet thought about it. There’s no guarantee that I’m right because we haven’t yet seen the top. So I’ll look at it when that happens.
I would think in weeks … but I haven’t looked at the times for the A and B waves yet.
That’s looking more like a top for USDCAD. Now we need a retrace, but the first wave will likely hit 1.355 or so.
Hi Peter
do you think silver will retrace 62% from here before the next big drop
Honestly hard to say at the moment. I’d have to get in and do some measuring, which I will attempt to do tonight.
I’m short ES at 2386.5
Peter
where is your stop?
thanks
Tim,
The current high at 2388, which I think is also the previous high of the first flat (or pretty darned close). Although I don’t have a hard stop, just a mental one. And I’m very early in, but i’m looking at a number of charts and I like what I’m seeing. We’re either topped or extremely close.
Actually, the previous high (flat) was 2389 now that I roll back and look. For a regular flat, that’s the point we want to turn at. Any higher becomes an issue.
what is your down target number
I have to work that out. It will be range.
I don’t have a lot on that—we’ll go to a new low for sure (if I’m right) but after that, there are few guidelines. It will be a case of counting waves and measuring them.
The Market Update for Wednesday is live at the top of the post.
Looking like we could possibly hit a new all-time high in SPX/ES today. If that occurs will that change the current projection at all? It’s just 10 points or so away.
I’m now long ES and DOW. I cant waste time grabbing a few points on the downside when the major market move will be to the upside. I reckon wave 4 is already in but we do have a large gap to close. Wave 5 should be explosive to the upside.
That’s what I’m seeing too. Nasdaq is usually ahead of SPX, leading the up and down moves. With NQ hitting new all-time highs, I would expect ES/SPX to do the same but we shall see. I’ve stayed long as I expected wave 4 to be very shallow and so far it has.
Peters scenario can still play out but id be looking for that as a place to add to longs. I’m comfortable with a 5% drawdown from here.
I see the wave structure supports Peter’s scenario but the bullish market sentiment seems to be keeping this afloat. The trend is still up. I’ve raised my stop to 2350 (just in case).
I used to have a VERY bad habit of buying tops and selling bottoms (still guilty on occasion), so even though you may be correct, I’ll go with the downside & a tight stop, buy a pullback, or sit on the sidelines.
I follow another well respected EW who reckons wave 4 low is in
The only thing I can come up with for this move (it’s one heck of a wedge-shape) is that possibly we’re in wave 4 of 3 in SPX/ES. NQ has not budged and badly needs a fourth wave.
All the waves up in ES and SPX are corrective (in 3’s) and that doesn’t predict a lasting bullish scenario. I would think there’s a rather bearish scenario ahead if we touch the previous high.
Peter that was what I had thrown out before as a possibility:
3 of 3 topped at 2401
4 of 3 down to 2322
now 5 of 3 up to a new high
That would appear to line up with NQ, which always seems to be ahead of ES/SPX (not behind it) as tech/biotech tends to lead rallies and corrections.
The rest of the market appears to be in a holding position.
HI Peter
has the usd/cdn hit its top
is it time to short
No and no. Maybe tomorrow.
yea, something seems funky. It came down slightly below your first target at 1.35454. I closed 80% of my position there and was going to add back on a 61.8% retracement, but it went all the way back to the top, and then some. Now this thing looks like it wants to retracement the whole monthly move of 61.8%. Will reevaluate after your analysis and see where it’s at when AUD gets down further.
The Market Update for Thursday is live at the top of the post.
btw, I’m short ES. Got in on the turn down near the end of the day (running out the door, so I don’t have the number at the moment).
I’m stalking USDCAD.
USDCAD. Haha … eventually, the signal shows itself. Big drop tonight, I have no idea why. Wait for it to retrace 62% and that should be a the entry. Wait for the turn, of course.
USDCAD could also just retrace 38% if the drop is just part of the first wave. Unfortunately, the subwaves are impossible to read.
Peter
Once we hit 62% retrace that is the entry point. If it doesn’t double top then we should pile on when it goes below a new low which would be 1.353 or so? Is that second entry point correct?
Thanks for the heads up.
Yeah, a new low confirms the turn. It’s looking good at the moment for a turn here at the 62% level.
I don’t like what CAD is doing. The problem with CAD is that “down” right now is in the opposite direction of the US market finishing a fourth wave. CAD should be coming down when we’re in the US indices fifth wave. Also AUD is travelling in the opposite direction of CAD. So my sense is that we’re going to get a double top from CAD and that may be the end of the fourth wave in the US indices.
Gonna give it a little more breathing room. It looks like we are at a previous 4th right now. Keeping it on a tight leash. We have seen ES & CAD move in the same direction before causing this confusion, and I’m fairly confident you’re ES analysis is correct.
Mike,
It’s a really wicked market right now. We’re getting ready to “round-the-turn” into the fifth in the US market sometime soon (not today) but I wouldn’t give it long, with all these turn dates right now. AUD is almost at the target. USDJPY is almost as the higher target I identified. EURUSD is coming down as expected (but it’s a correction). Scary stuff to be trading in.
Gold & Silver aren’t helping the cause either, but Silver just double bottom. See if it gives us a bounce and reverses USD. We do have an AP turn date for both EU & Dollar Index today (but then another one tomorrow).
Yeah, expecting a bounce in them. NQ just went to a double top and that’s been keeping ES from going south. I’m betting on the running flat in ES, which doesn’t provide a downside target. It’s like “everything it can throw at you to make life miserable” kinda stuff … 🙂
I’m out of the market. NQ at a new high (I wasn’t sure my count was correct there, but this should be the final wave in it). I’m not going to play in this market. I’ll wait until it settles down … concentrate on the fifth wave coming.
CAD looks like we’re going into some type of ending expanding diagonal. The recent waves are in 3’s and we’re in the final 5th by my count. Wild. Anyway, I have chart show to get ready so I’ll be gone for awhile.
I lied, actually. I got sucked back into ES just after I left that previous comment. I’m short. After I saw NQ topping, I figured it would head down and down we go. Stop in place. Will just leave it.
I’m still in ES.
Looking at the monthly chart and doing some fibs, if SPX/ES come down to a new low, and the rate UCAD is going, you see any possibility of it hitting the 61.8% level at 1.38296? It’s already crossed the 50 mark.
It’s certainly been in the back of my mind.
Not to mention, AU & WTI still have room to go to hit targets. WTI usually moves inverse to CAD.
So Peter you are saying that the es may be up from here into the 5th?
Did you watch the video from last night? I spent a long time on that.
I’m going to cover off flats in the chart show again today. I think we’re very close to entering a fifth wave and until we do, things are going to be a struggle. This market is crap until then.
Today’s Chart Show is live at: https://worldcyclesinstitute.com/april-27-2017/
I keep forgetting to record my entries. I got short morning ES an hour before the open at ~2388.
I also took a tiny position short in USDCAD with a stop just above the high.
I want to see ES below 2378.75 to confirm this drop.
Peter,
This is very helpful to me as a double check/confirmation. It really helps, thanks.
Steve
Well, don’t do the CAD thing. It’s totally counter-intuitive (and it was literally one unit). I stopped out. We’re not quite done in the CAD department.
USD/CAD 1.383 here we come?
Well, we’ll see. Can’t count it out.
We now have a good old run of the mill ending diagonal in ES, so there’ll likely be a spike to end it off. I don’t think it’ll be done until the bottom of this wave in ES. AUD turn then, too, likely.
No, with all the other distractions I have (work), it’s all I can do to stay focused on ES.
Pretty boring day watching the omnipotent bulls kill any drop with a BTFD flurry.
Still sitting long on ES and DOW with small stakes looking to add on a drop or move to a new ATH
Long AUD now too. I think we are close enough to the bottom now
I just got out of ES. Very frustrating. NQ has 3 waves down and this all leads me to think we need a double top.
I don’t see 5 waves down in ES.
AUD up in 3 waves, so it should come down, CAD down in 3, so it should go up. It supports a drop in ES but it won’t drop.
OPEX Magic!
Amazing how they can pin an index of 500 stocks to 238 (or pick any number that will screw the most people on expiry date) exactly.
Gonna stay in ES. With a short this close to the top, I can’t see exiting the trade unless there is some reason you think it will blow past a double top and hit new highs.
Forgot to mention, I’ve been playing DAX and FTSE on the downside calls much better. They seem to be more adherent to rules and fib levels. FTSE retraced exactly 62% and has been trending in the correct direction for days.
Good for you! DAX looks corrective on the downside, but FTSE, the first wave was down in 5. However, it’s come down to a previous 4th at 7100, so if the current waves bottoms at 62% from the top of 7300, or does a double bottom at 7100, it’s likely headed back up.
Closed 80% of all three index positions with a stop at BE for the rest of it. ES back up & down seems highly likely. That would erode SPY/SPX premium on both sides before it can decide. They’ve already screwed most of the put holders from last Friday, this Friday/Monday morning, seems to be eroding 2400 call side.
The best way to make money in options in a market like this is selling slightly out of the money puts/calls at our targets. I won’t do it though, since the rewards are limited.
Mike,
I should have a post out by 3pm EST latest. It won’t have many surprises.
NQ is heading back up and it looks like ES will follow reluctantly. I think ES will implode at some point, but we’re usually positive on Sunday, so it may be a Monday top somewhere along the line. I’m not sure ES has the strength to get back up to 2395. These small waves up are corrective.
I don’t see a road to a new high. It doesn’t make sense to me. I’m watching NQ which looks to have topped but the wave looks like it has to test the top. So that may be the plan for ES, as they more or less move together.
A new weekend post is live: https://worldcyclesinstitute.com/the-flat-family/