

It’s amazing to me that there seems to be a consensus that economic growth is perpetual—that the economy will grow forever, no matter the external forces. There’s this belief that companies will just keep growing and expanding which will, of course, lead to the stock market going up forever. History tells us it’s not likely to happen unless “this time is different.”
You get this kind of thinking at the top of a bubble. At the top of a financial bubble, everyone who’s invested in the market to date is pretty happy with the outcome. On paper, they’re richer than they were before. In this current market, much richer. Euphoria seems to take over the mind as all rational thought “leaves the building.” The well known adage of “buy low, sell high” is forgotten, as greed gets the upper hand.
History has shown again and again that this kind of thinking is inconsistent with reality. Bubbles burst. There has never been one that hasn’t.
| “At the extremes, the herd is always wrong. One should not under estimate its capacity for stupidity.” |
| The Secret Life of Real Estate, Phil Anderson, p 329 |
Nothing moves in a straight line. It doesn’t matter what it is: climate, the economy, wealth inequality, socialism and capitalism, even population. Everything runs in cycles. If people understood this, we might, as a society, be able to plan for the bad times and save in the good times. But we don’t. In fact, by manipulating the market in an attempt to break the natural cycle, we make the following negative cycle far worse that it otherwise might have been. History is very clear on this.
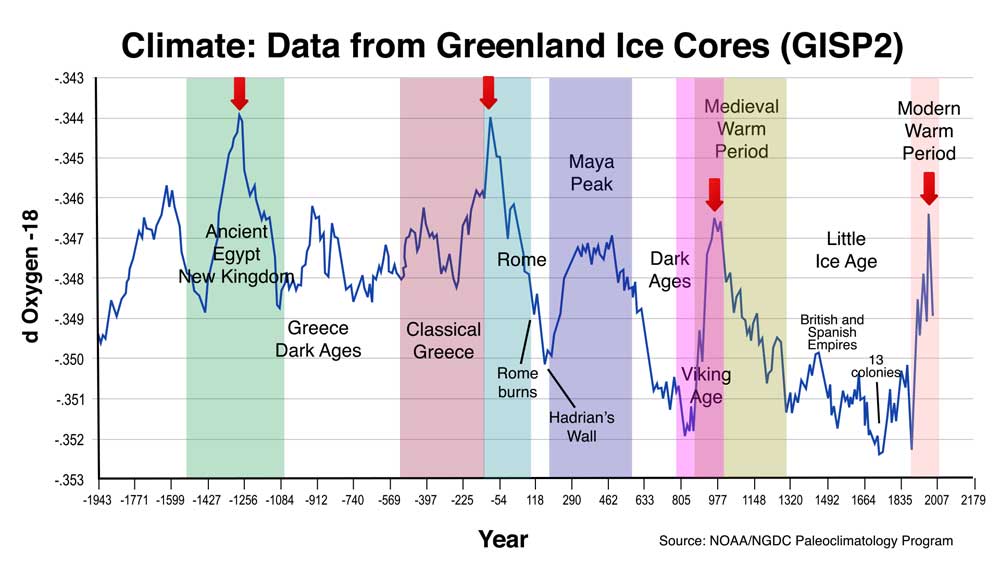
Above is a representation of relative temperature highs and lows (climate cycles) and how they correspond with the rise and fall of civilizations. This data on temperature comes from the Greenland Ice Sheet Project, funded by Denmark, Switzerland, and the United States in the 1970s and 80s. It fully reinforces the work of Dr. Raymond Wheeler in that his original findings (in the 1940s) are virtually the same as these findings fifty years later using different processes.
The red arrows in the chart above denote the 500 year cycles tops, which are marked by high temperatures and warn of an impending temperature downturn. In the past, these downturns have heralded the slow demise of the empire in power (there’s usually one country that’s considered the reigning world power, as the United States has been over the past hundred or so years).
We’re currently at a cycle top now (the Modern Warm Period on the above chart) and the expectation is that we’re beginning a long slide into colder temperatures, civil war, more authoritarian governments, a general loss of freedom, major migrations, along with fraud and intrigue in governments around the world. We’re also on the cusp of a major financial collapse, followed by a deflationary economic environment. (originally written in Sept, 2019)
These cycles always follow the same pattern, are highly predictable, and have happened like clockwork over and over again throughout recorded history.
Dr. Wheeler’s Work
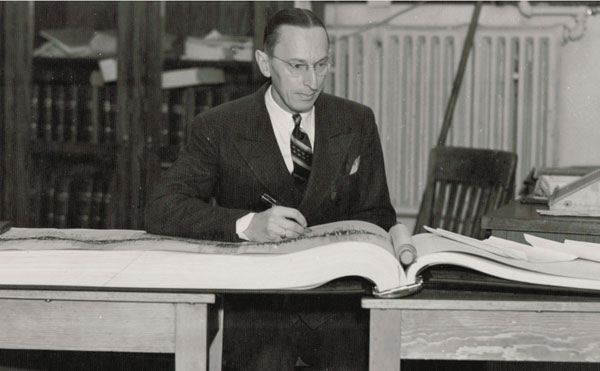 Dr. Raymond Wheeler, PhD spent a good portion of this life (along with 200 employees) documenting the cycles of history going back to the year 600 B.C. Dr. Wheeler created the Drought Clock, which showed the periodicity of these recurring cycles in a manner that shows their predictability, verifiable through observation, and supported by data from a variety of independent sources.
I’ve been working over the past fifteen years to understand in more detail the patterns of the longer worldwide cycles of 172 and 516 years as identified by Dr. Raymond H. Wheeler and Stephen Puetz. Dr. Wheeler identified the cycle lengths for climate of 25, 100, 170, and 500 years, while Stephen Puetz has done the work to prove their veracity, shifting the 170 cycle, for example, to a more accurate 172 years, and addressing the probability factor surrounding major harmonic cycles going back to the formation of the Earth.
In 2009, Stephen Puetz published The Unified Cycle Theory, which identified these cycles more precisely. In fact, he found that using Wheeler’s vast amount of data, along with the work of Edward Dewey and others, he was able to shift cycle dates slightly to end up with a harmonic relationship between the major cycles, which gave him a probability of or more than 98% when matching major financial collapses with major theoretical cycle turns.
A Red Flag Raised About Fertility
 I noticed another article this week (there have been a number of them over the past few years) raising a big red flag about fertility rates across the globe. In support of this work, I’m going to combine some science and history to show that ups and downs of this nature are predictable, and have further ramifications that affect us in other ways. See the original article here.
Here’s a key summarizing paragraph from the article: “Population growth is responsible for the majority of GDP growth…so a downturn in population growth matters…particularly when population growth shifts from wealthy or developing nations to the poorest. I’m not describing something that may happen in the future…I’m describing what has already happened and is continuing to send progressively larger tsunamis swamping the world economy. It has central bankers doing everything and anything to try to sustain the unsustainable.”
Fertility at the Top of a Warm Cycle
At the time of the Great Depression, the climate around the world was on a bit of a roller-coaster ride. In 1929, it suddenly turned quite cold, but over the next couple of years, temperatures reversed to the point where the 30s were known as the “dustbowl years”—hot an dry.
“During the 1920s and 1930s, the whole world experienced high temperatures. In the 1930s, long-time records were broken in many places. In 1934, the Midwest recorded six weeks of excessive temperatures with the high over 100°F (38° C) nearly every day. For two weeks in Kansas, temperatures of over 110° (43° C) were experienced with a 118° (48° C) maximum. During same two weeks, the thermometer failed to drop below 100° at night. Bed sheets were too hot to sleep on without being sprinkled with water; people lived in their basements; horses died in the fields.
During the excessive heat of the 1930s, the birth rate declined everywhere. In normal times, the birth rate is higher than the death rate, but during this period, the death rate increased while the birth rate decreased over much of the Earth. Totalitarian nations became alarmed and tried various methods to increase the birthrate. In Germany even single girls were exhorted to bear children ”for the Fuhrer.” According to the testimony of German physicians, even these extreme efforts failed to lift the birthrate to where they thought it belonged.” — Climate: The Key to Understanding Business Cycles, Raymond H. Wheeler
In the U.S., the tremendous increase in childless marriages led to a wave of adoptions. The decline in new births became so acute that there simply weren’t enough adoptable children to meet the demand. In parts of California, the birth rate dropped so much that it was estimated that if the trend continued at that level, the entire population would have disappeared within a hundred years.
Throughout history, during a 500 year cycle trough, populations have declined dramatically, for a whole host of reasons. Pandemics, a result of colder climate, are the main culprits.
Disease takes it toll in a colder climate due to the weaker state of mankind’s immune system. The science tells us that we’re much more at risk heading into colder climate, particularly when there’s a financial collapse underway. Hard times weigh on people psychologically and physically. It’s the psychological impact that impacts our immune system and makes us more prone to disease.
It wasn’t until recently that we’ve had the ability to measure sperm counts. But, we have done experiments that lead to similar conclusions: that this is a natural cycle. It happens worldwide at the same time and can have a tremendously negative effect on economies for hundreds of years.
Experiments with White Rats

At the University of Kansas, researchers performed a series of experiments on white rats*. From a large number of litters born at about the same time, three groups were formed. The first group was put in a cold room where temperature was kept at a constant level of 55° F (13° C) around the clock. A second group was placed in a hot room, where the temperature was set at 90° F (32° C). A third “control” group was set up in a room where the temperature ranged from 85° (29.5° C) in summer and 75° (24° C) in winter (normal temperatures). All the groups received the same food and could eat as much as they wanted.
When the rats reached the age of 10 weeks, they were deprived of food for 24 hours. A simple maze was placed in each of the rooms. At one end of the maze were the rats. At the other end was food. The object of the experiment was to see how many tries it would take the rats to figure out the path to the food. There was one direct route to the food in the maze and six dead ends.
Results of the White Rat Experiments (first generation rats)
| Room temperature | Hot | Control | Cold |
|---|---|---|---|
| Attempts before success (avg.) | 56 | 31 | 21 |
One rat in the cold room learned the maze in 13 tries. However, the average was 21 attempts. At the other end of the spectrum were the “hot room” rats, who took on average 56 tries learning the same maze. The control room rats averaged 31 attempts in normal temperatures.
NOTE: There were several rats from the hot room that failed in 100 trials and were eliminated from the experiment because no one had time to bother with them any longer. Therefore, the actual difference in performance between hot room and control rats was far greater than the apparent difference of 56 verses 31 trials.
* As a minimum requirement, mice used in experiments must be of the same purebred species. Rodents are used as models in medical testing because their genetic, biological and behavior characteristics closely resemble those of humans, and many symptoms of human conditions can be replicated in mice and rats.
The same experiment was set up with the second generation of rats, each born in the environment of their master group. The results of the same experiment varied markedly in the hot room: The average number of tries for the second generation rats came to 76. The cold room results remained about the same.
Hot room rats also had trouble remembering the correct path. Towards the latter part of the experiment, the hot-room rats would make one perfect run, only to forget the path the next time.
There were other differences between the generations. The second generation rats in the hot room weighed half as much as the second generation rats born in the cold room. The second generation cold room rats were the heaviest and healthiest of the lot. Their bodies seemed to adapt to the climate.
Behavioral Patterns
The most striking difference between the groups was in the demeanor of the rats. The results have huge implications in terms of what’s happening today with humans right round the world.
“The behavior of the hot-room rats was abnormal as compared to that of the cold-room rats. The cold-room rats were tame and docile and not seriously upset when placed in the maze. They accepted the situation as a matter of course and went about their business of searching until they found the food. If it took them a long time at first, they were none the worse for their frustration. The case of the hot-room rats was strikingly different. They were touchy and irritable; in humans we might call such behavior “hot tempered” or emotionally unstable.
Their behavior in the maze was extremely erratic. They were much more disturbed and frequently they would dash about the maze as if badly frightened. At other times, they would sit in a corner motionless for several minutes unless prodded to move on. On the whole, they showed great lethargy. Obviously they lacked ”push” as compared with the cold-room rats, which were seldom still in the maze.
In their cages, the behavior of the two groups was also strikingly different. The cold-room rats were much more active, more frequently engaging in play or climbing about the cage. They frequently would wrestle with one another in what was apparently a playful mood. The hot-room rats, until excited by one cause or another, moved more slowly and spent much of their time lying about the cage, apparently in an effort to keep as cool as possible.” — Climate: The Key to Understanding Business Cycles, Raymond H. Wheeler
Neurotic tendencies
“In general, the hot-room rats revealed many ”neurotic” tendencies. They were far less docile than the cold-room rats and objected to being handled. Frequently they bit their keeper, something the cold-room rats never did unless handled too roughly. When placed in the maze, the hot-room rats were frequently upset, and their frustration resulted in many ”fits” or “tantrums.” The hot-room rats, especially the males, exhibited a good deal of superficial sexual behavior, yet they were less prompt when the female was ready for conception. In the cold room, none of this superficial behavior was noticed.” — Climate: The Key to Understanding Business Cycles, Raymond H. Wheeler
Now, think about what’s happening in the world today. We’re at the top of a warm-dry cycle. Humans today are exhibiting some of the same traits as the hot-room rats. There seems to be an anger right across the world today, with conflicts between nations flaring up on a near regular basis. In many countries, riots are erupting and turning violent. Murders in the US have hit all time highs in some cities.
Their are many more traits that Dr. Wheeler attributed to a warm-dry period. The top of the current cycle warm-dry cycle was in 2007. A financial crash is always part of the transition from the warm-dry climate to a cold-dry climate. As the climate cools, expect the crash to take hold.
There are many causes of our precarious financial situation. We’re at the top of a debt bubble. Inflation over the past 100 years has devalued western currencies to a point that they’re worth less than 4% of their original value. Many homeowners now are underwater financially. Mortgages have been approved for thousands who can’t afford them at a time when interest rates have nowhere to go but up.
But underlying all of this is the reduction in population, which obviously contributes greatly to a financial crash. After all, the article I cited above draws the conclusion that lower fertility rates cause a reduction in the GDP (gross national product) and once this happens, we typically devolve into a deflationary environment.
In a nutshell, that’s the history and science as it relates to the ups and downs of population.


Curious, do the underlying lengths/durations of these various cycles periods correlate in any way to the Fibonacci sequence and Golden Mean theory. New to this science but find it very interesting. Thanks.
The Weston Price foundation has info that shows birth rates are also the result of manufacturing of non nutritional products. 1)Canada oil—CANOLA—which becomes bad when heated. 2)good fats—–bacon and lard——-versus vegetable oils and CRISCO (cotton seed oil). Western civilization wants to kill themselves for corporate profit.
Possibly your best write ever.
I do have some questions to get with you on.
Thanks.
Yes we are hearing about RATS and their behaviour
It reminds me of democRATS and their behavour
haha. Well, I wrote this post last year, but I’m trying to finish one on testosterone, which ties into the birth rate. And for my new service, i’m going to expose the Deep State, which is deeper than many think, going back to the days of Cecil Rhodes and the Round Table: The central bankers and elite of Britain, who have ideas of ruling the world and having one currency (you can include the DemocRATS, and the media, who are, for the most part, owned by the Rothschilds). The Donald kinda got in the way … (and he knows it).
If you understand this, you understand the bigger picture. “The bigger the lie …”