
“The market will do the obvious thing in the most un-obvious way.” I learned that little “truism” a few years back and it certainly hasn’t disappointed. The last couple of days in a low volume market has been a bit of a challenge in terms of figuring out the next move. But sooner or later, the market sends a signal. It’s best not to be in it until you get that signal.
In today’s post, I’ll tell you what I think is going to happen next and why. We’ll look at all the major US indices. Tomorrow (Friday) the US markets are closed and Sunday is the Greek referendum, which should give the market an excuse for the next move …
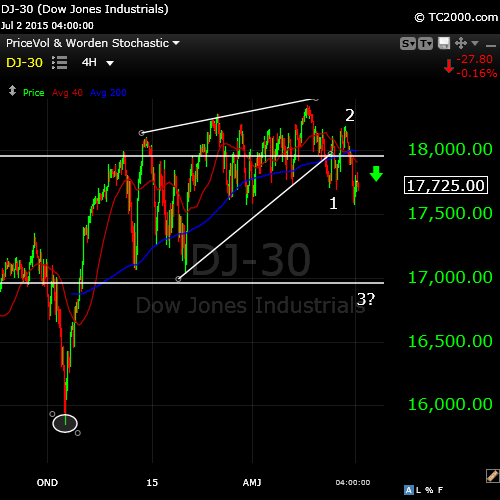
We’ll start with the four hour chart of the DOW (above) to give us a look at the big picture. Most of the indices finished an ending diagonal (or wedge) on May 20 or so. After completing an ending diagonal, the market will typically retrace to the beginning of the pattern relatively quickly. I’ve circled the beginning of the pattern here, just below $16,000 (cycles analysis suggests somewhere around the end of the first week of August). That’s the ultimate target for this first set of five waves down. How we get there is the question.
So far, we’ve completed a first wave down in the DOW, followed by a second wave and what I’m considering to be the first wave of the third. In the zoomed in charts below, I’ll take you through what I think the path will be.
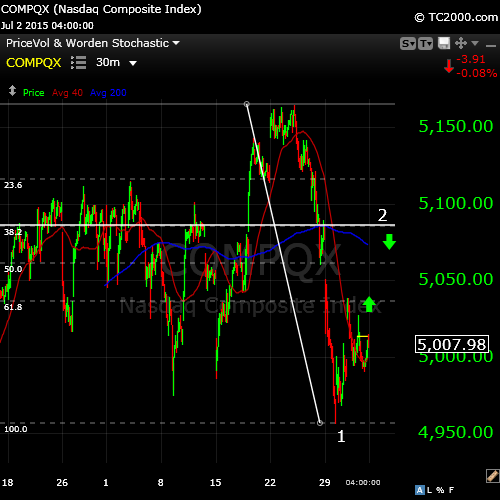
There are a few “tells” and here is the first (above). The Nasdaq has now done a first wave down. I can easily count five waves. That suggests it’s in the midst of retracing 62% (the horizontal line). After that, it will head down in a third wave, which will also put it back in sync with the DOW, NYSE, and SP500, which are all in a third wave at the moment. The move up will likely coincide with the “hopium” flying around Sunday and Monday leading up to an possibly including the Greek vote.

Above is a zoomed out chart (4 hour) of the Nasdaq showing the bigger picture. It has a long way down to get to the beginning of the ending diagonal pattern. I’ve circled the ultimate target around $4100. Wave 3 will get part-way there, then there’ll be a higher degree fourth wave bounce, which should retrace 38% and then down into a fifth wave to the target.
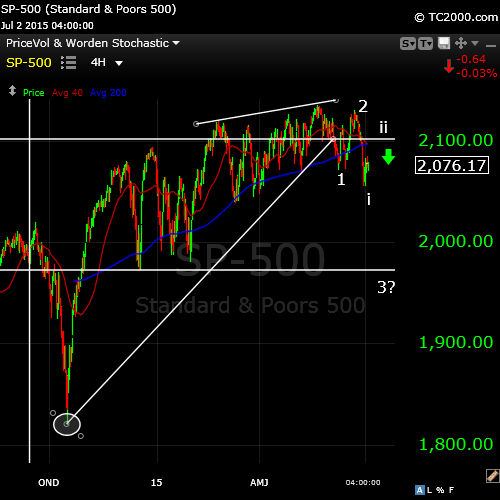
The SP500 above is in the same situation as the DOW and NYSE. It’s eventually got to get to the beginning of the ending diagonal pattern, which I’ve circled just above $1800. I’m expecting a small bounce to a second wave and then we head down.
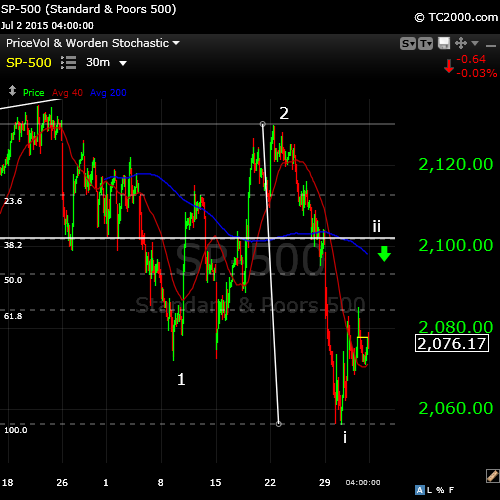
Let’s zoom in to get a closer look at the pattern. In the past couple of days, I was expecting this most recent countertrend move to be a fourth wave, but it’s far bigger than any of the sub waves in wave i down, so it really has to be part of a second wave forming. This is the second “tell”—the size of this current countertrend move. It’s too big for a fourth wave, so we must be retracing higher, which would put it in parallel with the expected move in the Nasdaq.
This suggests the third wave down will subdivide into five distinct waves. So, Sunday/Monday expect a short move up to the 62% mark (horizontal line) and then a turn down into the third of the third, which should come straight down (a nowhere-to-hide wave).
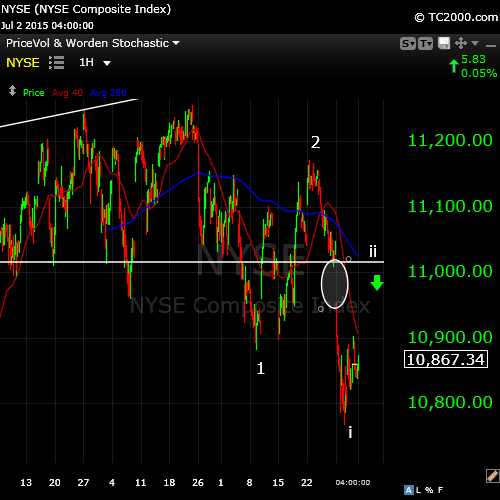
Finally, let’s look at the NYSE, which always seems to have the clearest pattern. There’s a third “tell” here. The market doesn’t like to have open gaps. They’re almost always filled. I’ve circled the gap in the chart. This suggests the current countertrend wave will retrace to the 62% mark (horizontal line) and then turn down into the third of the third. This coincides with the moves I’ve suggested for all the other indices above.
That’s my take on the current situation in the major US indices. They all seem to be saying the same thing in one way or another.


Peter… I believe you’re right on target with your well articulated analysis. I appreciate how you compare the counts of various sectors of the market to help confirm your price targets.
Like you, I think that stocks topped in May… this would line up nicely with a bigger downside over the next couple weeks… and for Gold to bottom within the next week or two.
As I wrote earlier today at our discussion group… at prior major lows, Gold’s bottoms have coincided with or occured after stocks broke down big. A significant correction in stocks should be the catalyst for the market to change their opinions about Fed rate hikes. Stock investors would quickly change from: “How soon and how much is the Fed going to raise rates?” to “How soon and how much money is the Fed going to print?”
That’s really interesting, Joel—not that intuitive to someone less versed in the movements of gold. I was wondering why gold was not moving as the market topped and headed south … and then there’s oil. I was expecting it to hit the previous 4th wave. As I look at USO, it hasn’t … do you think it’s done? Are we into the 5th wave down? What are you expecting?
Peter,
You may recall that a while ago I said the 19 year Dewey algorithm gave july 6th as a target date. Could it be the market wants to bring a good bye kiss to this date?
Gann gives a potential panic window 49 – 55 days after a major high. If May 20th was that high, this window opens up july 8th.
Mastertiming (square of nine technique) on the significant march 2000 high gives july 8th.
So I think you are right ;-). The market wants to test a priceline (elliot wave) and a date.
Next week should be fun.
Cool. Then just about everything seems to confirm the count … so far. Yes, in that case, next week should be fun!
Peter,
I also had a feeling yesterday that we will take a move higher first some how things will turn bright monday and certainly here in Europe we can see a big move up if things turn out well with Greece on sunday.
The bradley has an other turn date on July 13-15th and it looks like an inversion from the top.
John,
There are so many elements now pointing to the period around July 15. I would guess that’s going to be the bottom of wave three for the US indices. We still have waves 2, 3, 4, and 5 to go of the third. Then we’ll have a slightly larger bounce (higher degree wave 4) and the larger wave 5 which should take us into the beginning of August.
I totally agree with this:
http://www.zerohedge.com/news/2015-07-02/martin-armstrong-troika-maneuvering-rig-greek-referendum
Thank you Peter and Andre, Looks right Nick
Some further analysis makes me think that after the august 10 low, we get a retrace abc up into September 21-24 when the sun is conjunct the north node (worst moon wobble thinkable) and the heliocentric Jupiter-Saturn square that is know to cause mega Tsunamies,nuclear disasters and other misfortune. September 21-24 is also the anniversary of the September 2014 high. So the real panic may still have to come. The high for 2015 has been set.
We are only in w1 down with 3 of 1 to start in september. The 3 of 3 will come in 2016.
Andre,
Yes, I totally agree. It matches our prognosis. And a very nice, succinct summary of where we’re at the road ahead. I would only suggest that it’s wave 3 (not 3 of 1) that will start in September. We’re arguably in 3 of 1 now and should head down to complete the first wave through August.
You are far more advanced in this theory than I am so I’ll leave the wave counting to you. My main point is that I am certain now the bear market is already with us, but some people are still in denial. And I am pleased we share the same vision. First time to experience this. That will make me come back regularly.
I see some short term support to maintain a consolidating market into July 15/16. But the consolidation will be more volatile. So the first bit of fun will come in the second half of this month.
I really appreciate this conversation. Thanks a lot.
Understood. The support you’re seeing is likely the expected larger degree fourth wave at about $16K on the DOW. We’ll see how accurate we all are in our forecasts …
Peter,
My thoughts on the markets
I think we will go down this comming week after that I also see a consolidation with some recovery after the 15th till July 23-26.
After that we will see a the first big breakdown into august
Hi Peter,
Do you already have a new vision on the market July-August..
It looks like Andre is right so far we still see a consolidation going on from beginning July till now.. In Europe we have our Greek party… but the U.S. is not realy participating?
Nice Weekend.
John,
Nothing has changed. Until we get out of this consolidation going on, there’s no point posting anything, although I may do a short one tomorrow. I still think we have to put in a second wave, which means the SP500 needs to backtrack to about 2094 and the DOW to about 17,900 before heading down in the third of third.
Oke thanks,
Well the upturn in your chart arround July 8th was a hit in Europe if I read your chart well the real breakdown will come arround July 23…
I think le Quatorze Juillet will be an important turn and the end of W2 where we are waiting for. The jerky upmove from July 8th is a typical counter trend move you see when the market senses a major turn. The Vix is headed down to test the lower band in the BB for a jump up out of the upper band.
Juli 15th squares the 2014 October low.
And I have a ton of other indicators that all say the same : volatility will rise sharply next week, gold will rally and markets will surrender.
Tuesday will show the report on retail spending, just before b2c companies will report q2 results. This will likely be the trigger. The jobless claims last Thursday were a big disappointment. As was the first indication of retail spending yesterday,
Still, would really like to see Peter’s short update tomorrow.
New post out, Andre.
We’re on the same page.