Update: Thursday, April 13, 7:30am EST
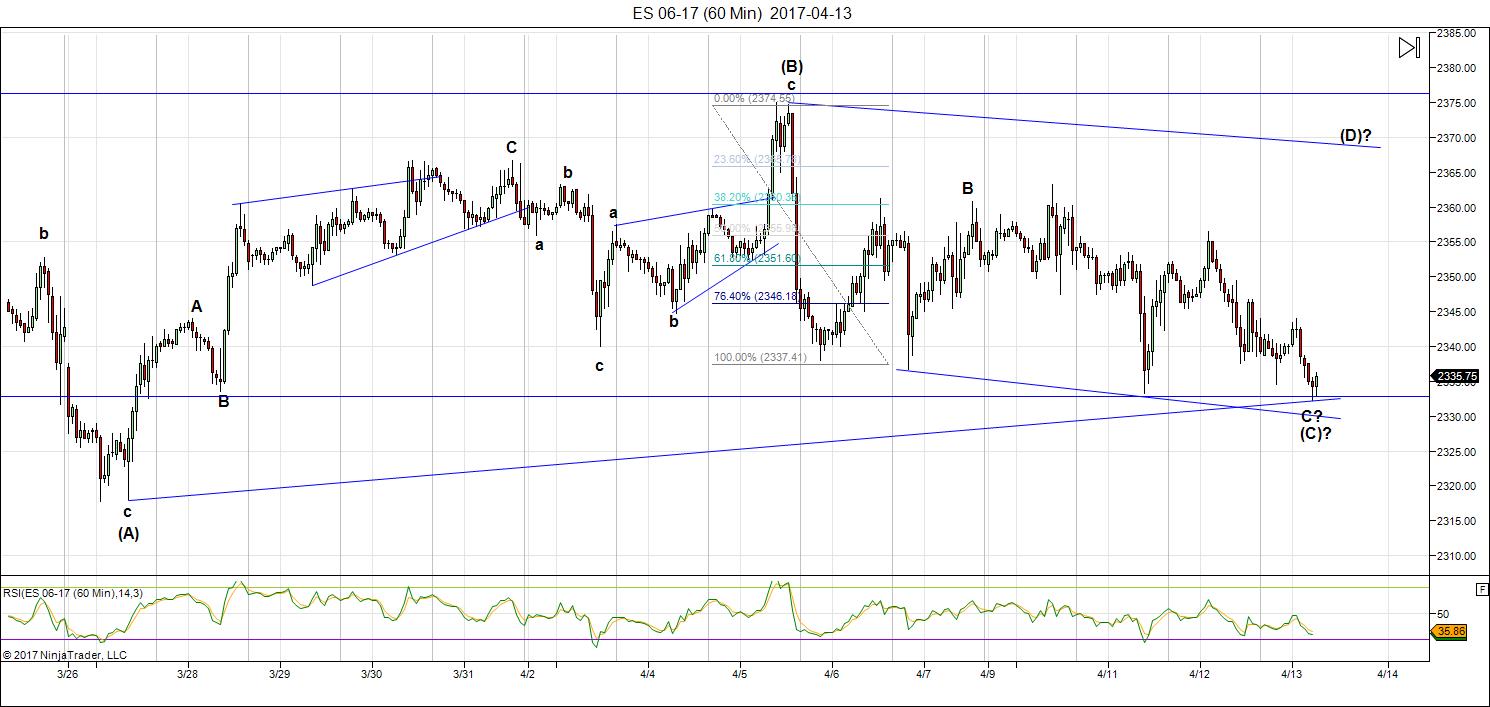
Above is the 60 minute chart of ES. Still mixed signals. It looks like a triangle forming, but until we get a leg up in a (D) wave, we can’t be certain. We came down a little bit lower last night (we’re still defining the lower trendline, if this is a triangle).
This second pattern doesn’t look right for a zigzag at the moment and it’s not a flat. So we wait and see. We’re waiting for a turn up in 5 waves to a previous 4th and then 3 waves back down. If a triangle, this would be the lowest point before a fifth wave, so it would be a good long-term entry if it pans out.
I’m seeing currency pairs in potential turns. USDCAD has turned into the final wave, but looks to need a large retrace. GBP may have turned (looks like 5 waves up). If so, it missed the retrace target. If this is the case, look for a turn up after a 62% retrace to the 1.245 area.
The euro looks to be in a C wave now after a B wave up but caution on this one. AUD looks like a zigzag up and I’m expecting this to retrace back down to the target.
USDJPY may be at a bottom. Looking for 5 up, three down here. These turns in currencies are suggesting a turn in the US market, but we’re yet to see it. The open is more probable time, of course.
NQ is also at a double bottom as I write this, which also suggests a turn for ES is eminent.
A really mixed market and dangerous right now as we try to find our way.
_______________________
Market Update for Thursday, April 13, 2017
Market Update for April 13, 2017 |
_______________________________
Update: Wed, April 12, 5:20am EST
Two weekends ago, I wrote a post about how much I dislike fourth waves. Now you’re about to find out why!
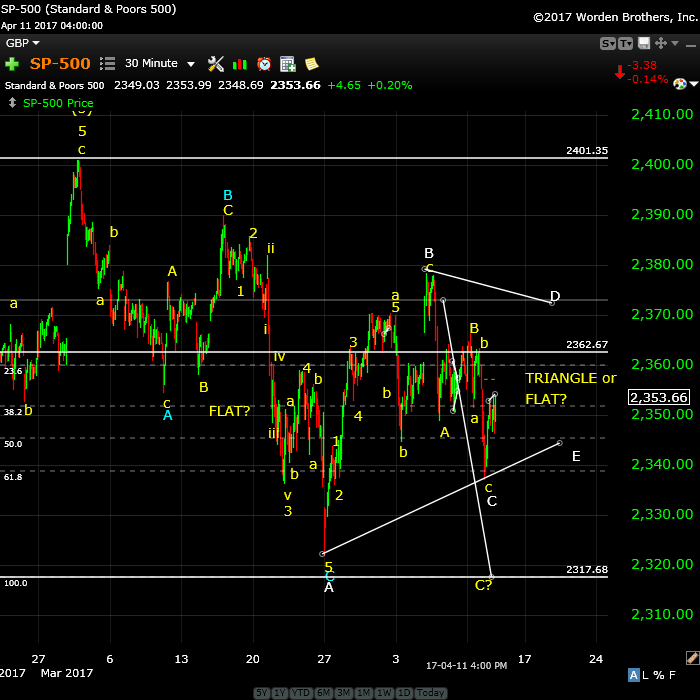
Above is the 30 minute chart of SP500—the fourth wave so far, albeit a complicated chart. I’ve talked a lot about this being a combination wave. The challenge is figuring out the patterns and tonight, everything has become somewhat muddy.
We’ve had a flat for the first pattern (3-3-5). The second pattern is the one that’s muddy tonight. I didn’t expect the rise we have tonight in ES and this brings the possibility that we have a triangle unfolding as the second pattern. It could also be the beginning of another flat (which I was leaning towards). This morning, I’m on the fence.
If at the open, SPX heads up above about 2362, then I would lean towards the triangle. A triangle would be the final pattern and means that after a wave up, and another one down, we’d head into the fifth wave. It would make for a rather shallow fourth wave.
If we have a flat unfolding, I would expect a smaller rise to about 2363 or so and a failure at that point, with a strong move to the downside.
I don’t at this point know what will happen.
However, with the currency pairs where they are (getting close to their end targets), I’m getting the feeling that this fourth wave will not be very deep and a triangle is certainly within the realm of possibility. A shallow triangle would also seem to fall in line with the prognosis for gold and oil. Even we don’t head down sharply in ES/SPX, I would expect gold and oil to hover a bit longer (while the triangle finishes up) and then head down as we go into the fifth wave.
A triangle now may take another week to play out. A drop would likely cause oil and gold to spike a little higher. The big picture (with everything interacting like this) seems to me to favour the triangle.
Above is a large 60 minute chart of ES. It’s the same situation here. The 62% retrace level is at 2359 in this case. This might be the level for a failure and a strong drop into another flat. On the other hand, surging past this point would likely mean we’re going to complete a triangle.
Completing a triangle will likely be another week of mostly sideways.
Right now, it’s very much up in the air.
______________________
Market Update for Wednesday, April 12, 2017
Market Update for April 12, 2017 |
_______________________________
Update: Tuesday, April 11, ~11am EST
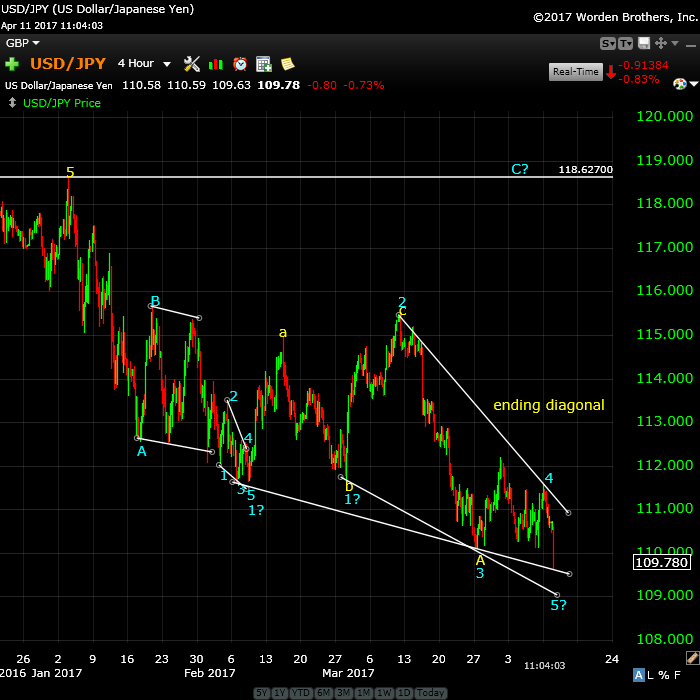
Above is the 4 hour chart of USDJPY. I’m seeing a very large ending diagonal. There are two possible versions of it and I don’t know which one is the active one. At some point, it should reverse, but picking a bottom on these things is suicide. You want to see a higher low eventually.
The entire structure is corrective, so it’s just a matter of time …
__________________________
Market Update for Tuesday, April 11, 2017
Market Update for April 11,2017 |
_______________________________
Update: Sunday, April 9, ~10:30pm EST
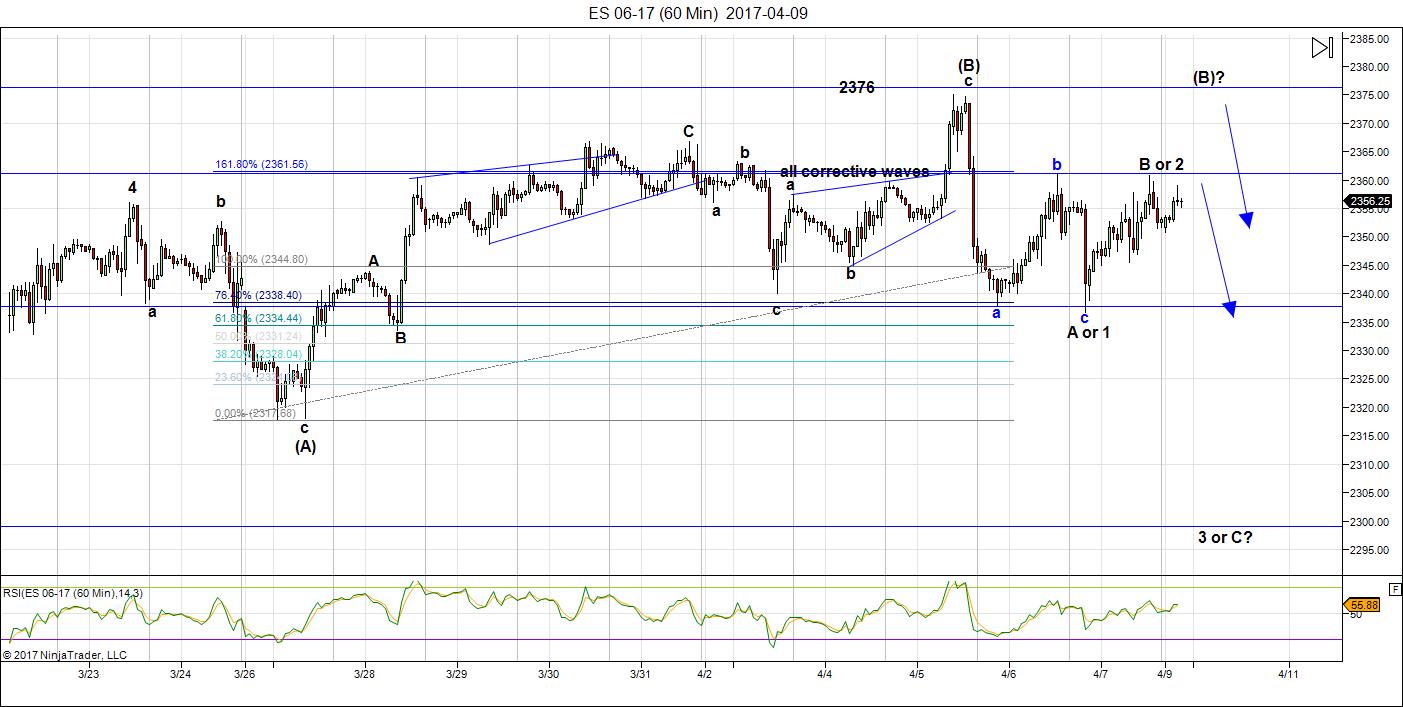
Above is the 60 minute chart of ES. I’m not enthralled with what I’m seeing overall tonight (with currencies particularly) and want to alert to an alternate high in ES.
There’s an option for the corrective wave to extend back up to 2276 before turning down again. The dollar has headed up tonight and looks like it’s setting up for a B wave in the opposite direction, which I think will send ES up and the currencies pairs for the most part up in B waves. So we may get an up day on Monday and come down on Tuesday. This is an alternate scenario to what I’ve laid out in the weekend video.
If ES rises about the 2361 level, the 2276 level will be in play. The larger direction is down. ES may not have topped in the C leg. I also wary of the spiked top (and we have 3 waves down), so it leaves open the two options for a high … either 2361 or 2376.
________________________
Last weekend here, I confirmed the larger fourth wave. We’ve completed the A and B leg and are just starting the C wave. If you like to trade ES/SPX or any US equity indexes, you’ll want to be short for the next couple of weeks. The ES trade is worth at least $5,000 (over 100 points X 4 X $12.00).
If the C wave down is the same length as the A wave, the bottom should be around April 26, by my calculations. April 25 is an Andy Pancholi turn date, btw. You’ll find the price points on the daily chart below.
I suspect we’ll drop in either a larger expanded flat, or a zigzag (or two). This will finish the combination wave that I described in last weekend’s post. We’ve completed a first wave down of C, by the looks of it. I think we’ll hover over the weekend and start down Monday. I explain more about this in this weekend’s video.
Gold and silver finally “cracked” on Friday. This should be the start of a solid leg down to a new low. Crude oil looks to have topped and, as I write this, may be in a fourth wave. It could go up or down, but the up direction will only lead to a double top to the 52.94 high.
Currencies area relatively quiet at the moment. The next major move for them will be the final wave to the longer terms targets that I have mentioned in previous posts and videos. Nothing has changed in that regard.
Changes to the Free Blog
Last week, I ran a bit of an experiment in the free blog area. I shared the prediction specifics for ES, complete with entry and exit points. I alerted this group to the potential for a rise to the 2276 area with a CAUTION comment, and I posted the “Timing the Top” video, predicting the ultimate top.
The response I got was less than desirable. They’re all off in their own little worlds, imho. As it takes me an average of five hours to create a blog post there, I’ve decided it’s not a good use of my time.
As a result, I’m going to radically reduce my footprint in that area. Articles I write will now go on the main landing page, I’ll get back to creating more video on the main page, and I’ll post past wins to the free blog area, as more of a promotional thrust for this service.
The free blog area I find hugely distracting and, in fact, my post there today talks about the “noise” (the comments and musings in multiple directions) and the detrimental effect it has on trading.
I’ve personally given up the attempt to help these people see the benefits of Elliott waves, the fact that as price cycles, they work much more effectively than time cycles. Used together, they’re highly predictive.
My key trading principles tend to be these:
- Trade what you see, not what you think.
- Know when to be out of the market (usually more often than in)
- Have an exit point
- Risk based on probability (and volatility)
- Limit external “noise”
As a result, for the most part, I stay away from fundamentals, or trying to guess causes of market moves; I try not to mix news with technical analysis. In my world, there is little correlation.
I don’t look at other people’s charts (or counts). I have no interest in discussions about what might happen “here” due to something happening “over there.” Staying as objective as possible has served me well. It’s the times that I allow outside influences to affect my thinking about an Elliott wave count that I get into trouble.
I’m not trying to be anti-social; I’m just trying to explain my philosophy and how it affects my decision to limit my exposure to what I consider”noise.” It has made me a much better trader and analyst.
At the same time, I’m committed to making your experience here the best I can, to try to teach what I know, and answer any questions that I have the knowledge to adequately address, along the way.
Changes to the Trader’s Gold Service
Firstly, I heard from a number of you this week when I asked whether you’d like emails for updates and/or alerts. I think the consensus is that an email on important alerts would be appreciated.
As a result, when I upload an important chart to the top of the post that denotes a change in the market or an opportunity, I will send out an email. It will have the words “ALERT – Traders Gold” in the subject line, so if you don’t want to receive these, you can flag them in your email client and send me to the trash.
I don’t do this more than once of twice a week typically, so I don’t expect it to increase your email traffic substantially.
Secondly, I’ve been asked whether I will share some of my trading entries and how I trade, which I’m more than willing to do. I will post as comments my entries and exits. In the past three weeks, my account is up 42% and I expect it to be up over 100% by the bottom of the fourth wave.
When markets warrant, I tend to get aggressive (for example the ES trade will be aggressive). When they’re questionable, I try very hard to sit on my hands.
In the final wave of currencies (I’m focused on USDCAD as the best opportunity of all of them), I expect to triple my principle. When the US market eventually tops and heads down, the sky’s the limit. If there’s anything I can share to help you be more successful in your trading, I’ll try my best to provide it.
I’m certainly not perfect, but I’ve lost a lot of money in the markets learning to do this. That was my education. Now I plan on reaping the rewards.
There are few things that make me happier than beating the market. 🙂
Thirdly, I’m going to work on expanding the service and promoting it (something I have been reluctant to do until I was more confident I had most of the “kinks” ironed out). There’s more to do here, of course, and one of the changes I’m making is to concentrate more on specific chart opportunities, rather than covering everything all the time. I’m going to tell you more and more what I see as the best opportunities, rather than just providing direction and counts for everything that I cover.
To that end, if you feel compelled at some point to send me a short little two sentence testimonial I can use on the Trader’s Gold signup page and to otherwise promote the service, that would be very much appreciated. I will only use the first and last letter of your name, as I’m adamant that your security must not be compromised at any time. Please send my email: peter@worldcyclesinstitute.com
To summarize: We’re approaching the final leg of this journey to the largest bear market in history. I expect the major concern once we reach the top will be security of funds, market interruptions, bank failures, and general security (including physical). I’m starting to gear up mentally for that challenge. It’s going to be a ride for the history books.
______________________________
Opportunities this Week
There are opportunities this week:
- ES/SPX (short)
- USDJPY (long – watch the video)
- WTI Oil (short – watch the video)
- Gold/silver (short)
Patience will be key as we wait for the rest to US market to show its hand.
The Longer Term Picture
During the week, I created a short video on the path to the top in the dollar and EURUSD. If you missed it, you’ll find it here.
______________________________
Here’s the latest daily chart of ES (emini futures)
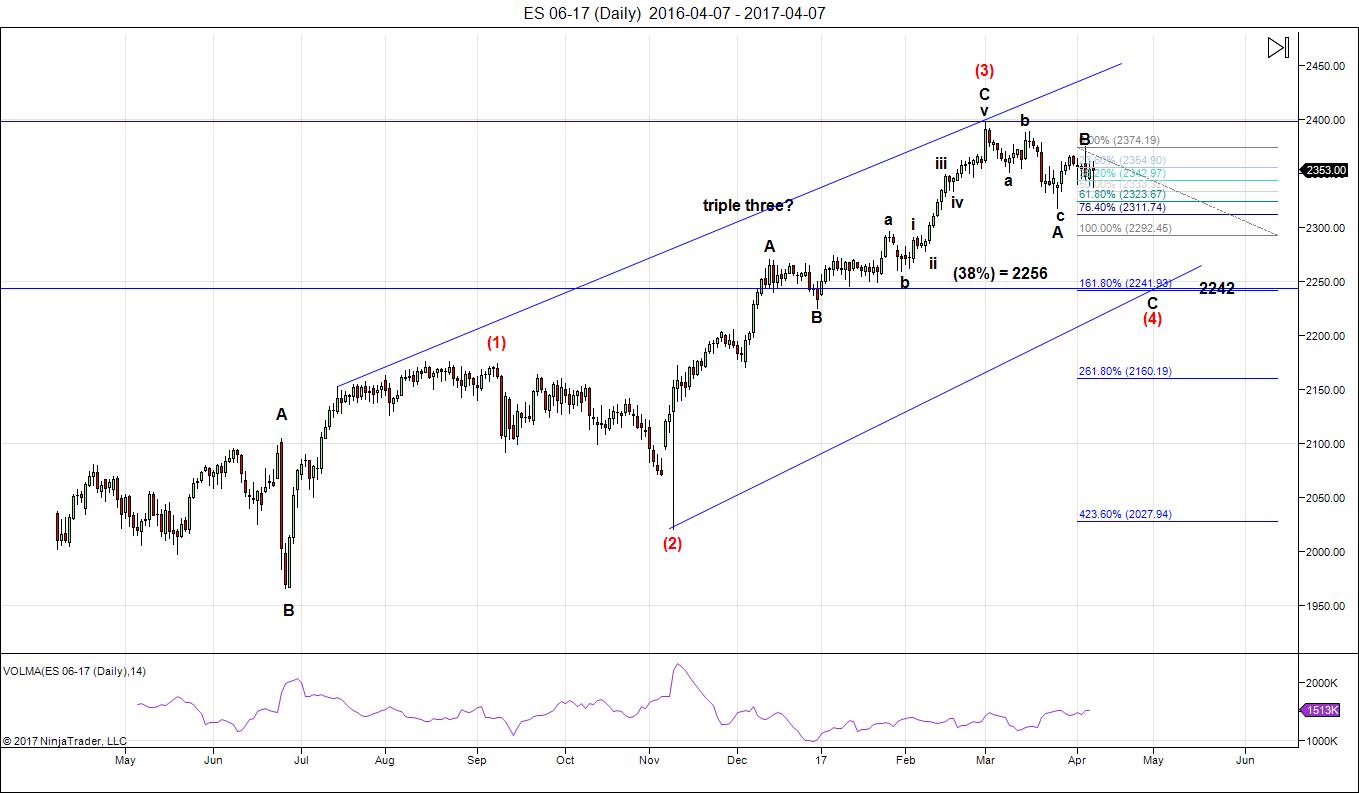
Above is the daily chart of ES (click to enlarge, as with any of my charts). We’ve completed the A wave down (a flat) and the B wave up to slightly above the 62% retrace from the bottom of the A wave. We first reached the 62% area (2367) and then dropped overnight (I predicted this top within a point. As you know, I issued the caution earlier this week when we had a three wave move to the downside. That confirmed we were headed up to my alternate high prediction of 2376. Well, I missed that prediction by within one point, as well. The direction is now down.
I’m expecting the 4th wave overall to be sharp and deep, based on the rule of alternation, which states that if the second wave (going back to October, 2016) is shallow, the fourth wave will be sharp and deep, and vice versa. The second wave was indeed shallow, moving mostly sideways, over an extended period of time.
The A wave down took 3 three weeks. If the C wave takes the same amount of time (typical), then we should bottom around April 26 (April 25 is an Andy Pancholi turn date for SPX).
My projection for a target is 2241 now. The 38% retrace level is 2256 and if we get a flat, it may change the exit target slightly. We’ll need to be on alert near the bottom, as I wouldn’t be surprised by a quick reversal into the fifth wave when we’re in the area of these targets and near the turn date.
Summary: We’re at the top of the B wave of an ABC 4th wave correction. The C wave down will most likely be 1.618 times the length of the A wave down. That provides a preliminary target of 2241, although this is a rough estimate.
After completing the larger fourth wave, we’ll have one more wave to go, which could be an ending diagonal as a fifth wave. The long awaited bear market is getting closer.
_______________________
Here’s the latest HOURLY chart of ES (emini futures):
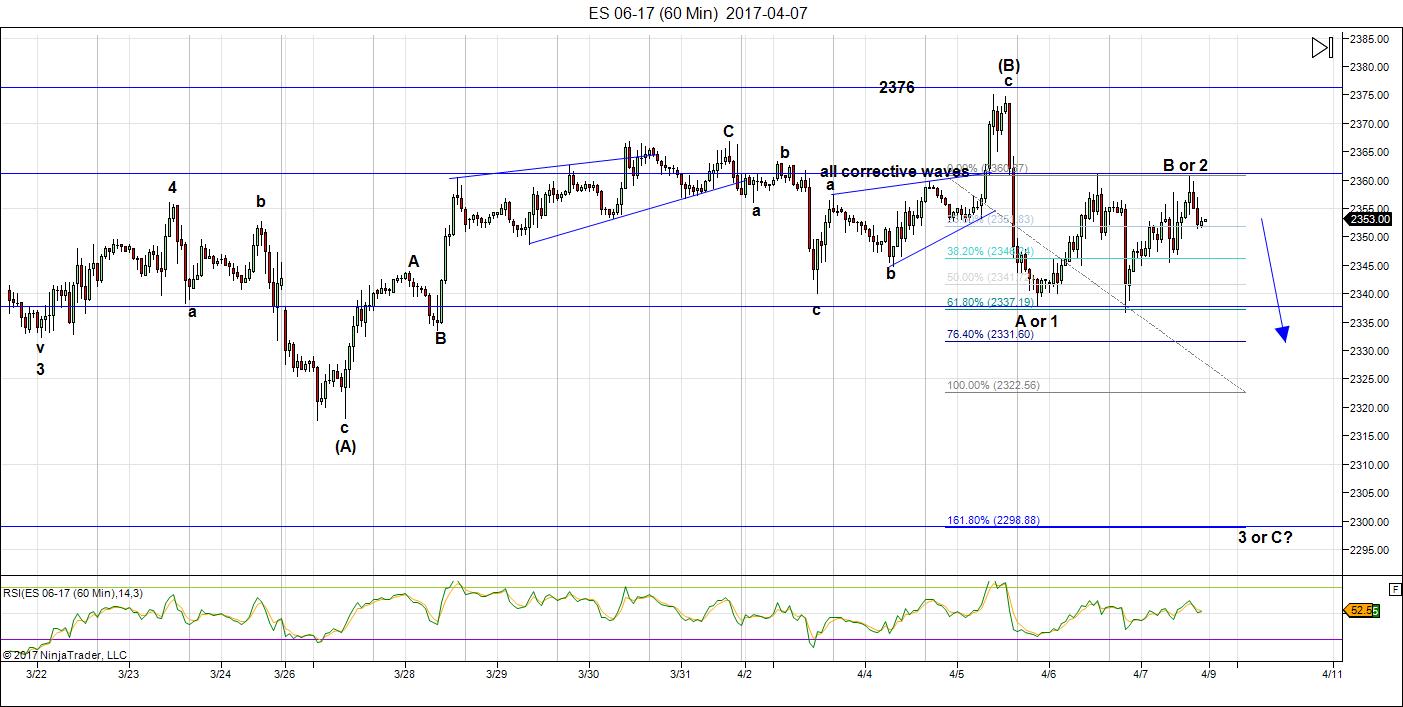
Above is the 60 minute chart of ES (click to enlarge). Please watch the video to get the full story on what’s happening short term.
We’ve completed a first and second wave (retrace to 62% again) of the C wave. The small wave down from 2361 looks to be in 3 waves so far, and the SP500, ES, and NQ missed the double top by a hair, so I suspect we’ll hover here and head back up to 2361 for a reversal down on Monday morning (Sundays are usually bullish). However, keep in mind that we could head straight down from here.
I’ve covered off my expectations for the eventual target in the daily chart above this one, and the expected timing for the drop.
This is a great opportunity for you to recoup your subscription a few times over. 🙂
_____________________________
Some housekeeping:
Andy Pancholi Turn Dates (April, 2017)
- SP500: 3, 17, 25
- EURUSD: 3, 10, 21, 27
New Free Blog Post: Market Noise
The Chart Show sign up is live for Thursday, April 13. You can sign up now in the usual spot: Webinars
________________________
Here’s a video overview of the market for Monday, April 10, 2017
Market Report for April 10, 2017 |
_______________________________
Charts Going into Monday
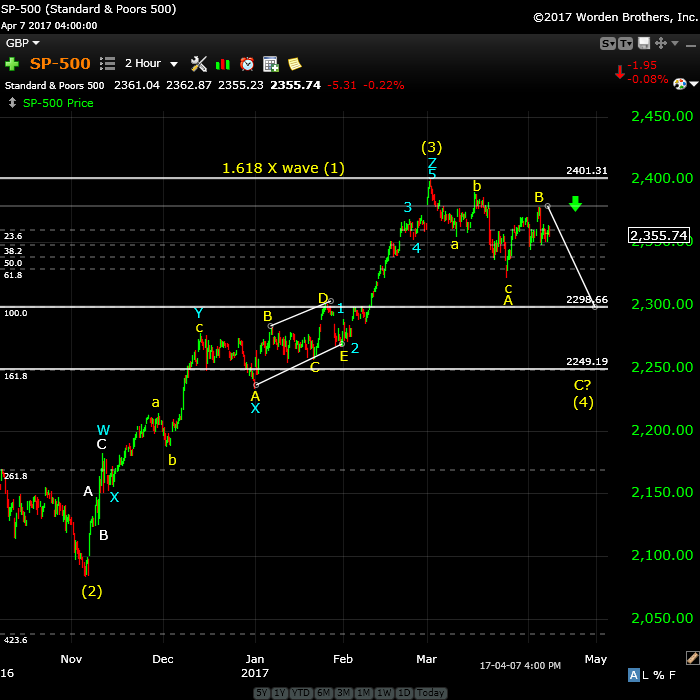
Above is the 2 hour chart of SP500. As with ES, we’re starting the C wave down of the 4th wave. I project a target here of 2249 or so. Note that it targets what (in a motive wave) would normally be identified as the previous 4th wave (where the blue X is located on the chart).
There’s an alternate target of 2296 (where the C wave would equal the length of the A wave, but this would seem too short for a valid 4th wave.
The final fifth wave will begin after the fourth wave bottoms.
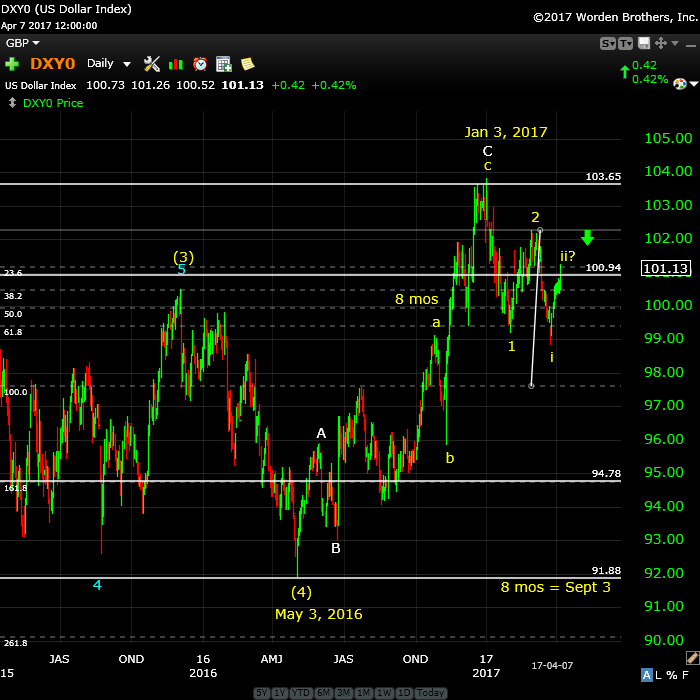
Above is the daily chart of the US Dollar. No change here in terms of my long term prediction—we’re heading down to the 91.88 low.
On a near term basis, the retrace up that I predicted last week is still in progress. We’ve passed the 62% retrace level, so we could turn down from here, but as with EURUSD, I’m more expecting a double top second wave at ~102.30.
Longer term, once we turn back down, 1.618 X the first wave, (the target for the third wave) is somewhere close to 94.83. The movement of the dollar determines to movement of just about everything else these days. The longer term target for this wave down is 91.88.
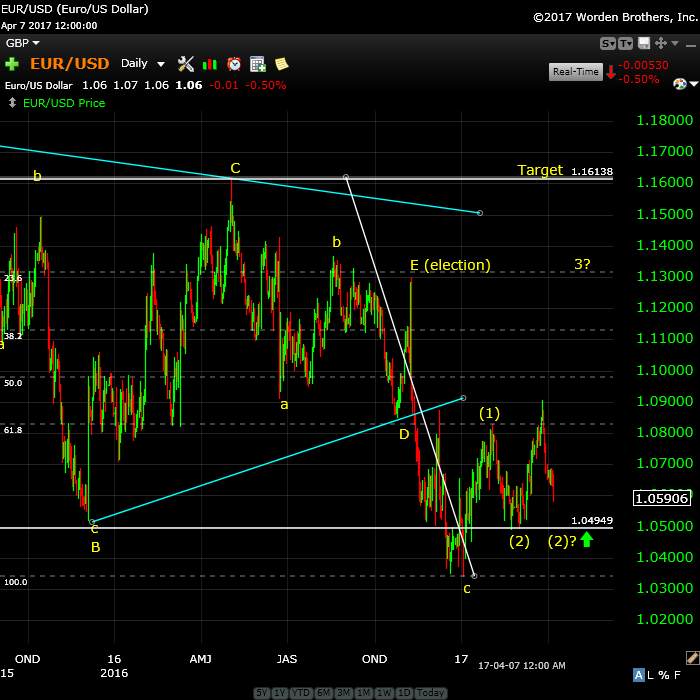
Above is the daily chart of EURUSD. The bigger picture is that we’re headed up towards a target of 1.16 (and change) before we get a really major turn down (a fifth wave).
On a short term basis, the predicted turn down is still in progress. It now looks to be tracing out 5 waves and this suggests we’ll get a double bottom at about 1.05 to complete the second wave.
If it drops to that level, it would be an excellent entry for a multi-month rise to 1.16. However, that 1.05 level must hold.
More in the video, of course.
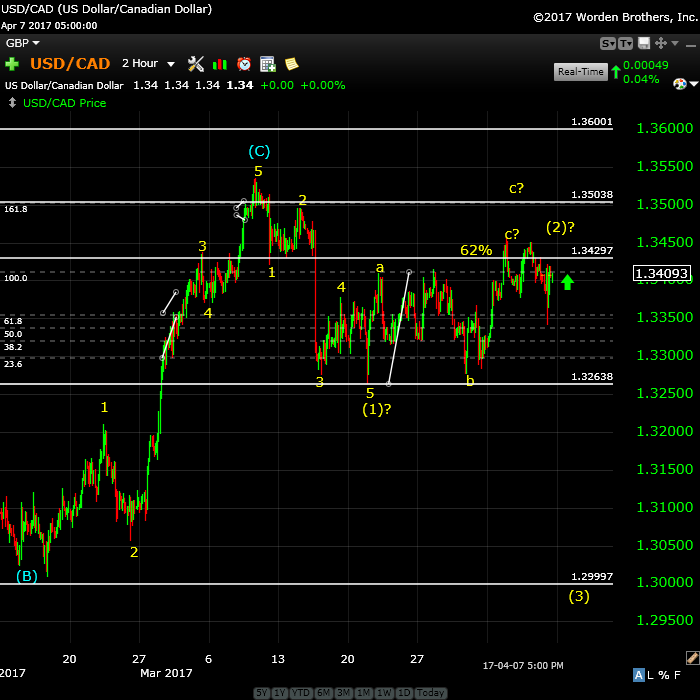
Above is the 2 hour chart of USDCAD. This is a fairly messy chart now—an extremely corrective wave hovering as the US market indices drop in their fourth waves.
The target on the upside is still in doubt so I’d stay away from this one until the SP500 fourth wave bottoms or we hit a new high at 1.36. There at least a couple of targets on the upside for a turn, but at the moment, what this pair will do is in question.
The longer term target is 1.19. This is the best long-term set-up I see anywhere, but we’re not quite at the entry level. We’re marking time until the US indices finish their 4th wave, I think. It may take a while for this setup to occur.
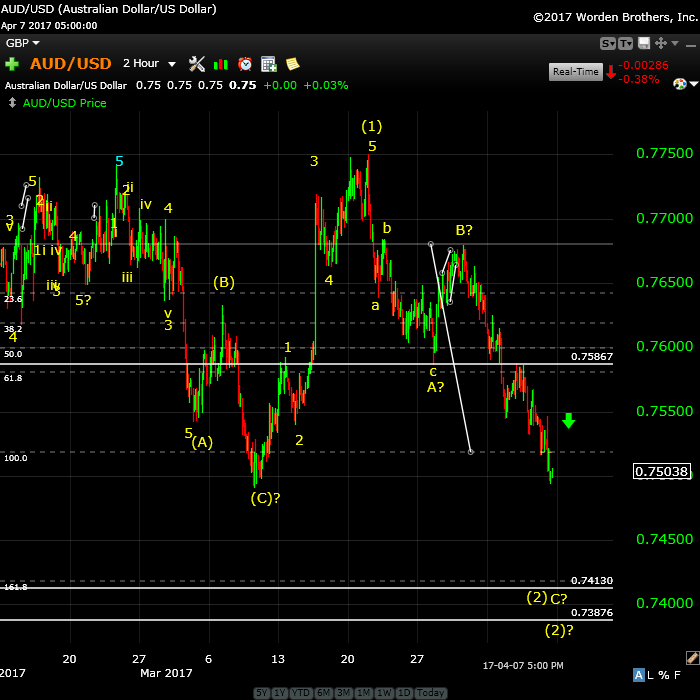
Above is the 2 hour chart of the AUDUSD. We’re continuing down to one of two targets. The first on (.7413) is the point where the C wave is 1.618 X the A wave. the lower horizontal line(.73876) is the 62% retrace level.
One of these will form a bottom, which will be a perfect set-up for a long entry for the final wave up to the eventual target.
I’ve an eventual top target of .828 for this pair, which is just shy of the 38% retracement level of the entire larger wave down (from the year 2011), which would make this wave 4.
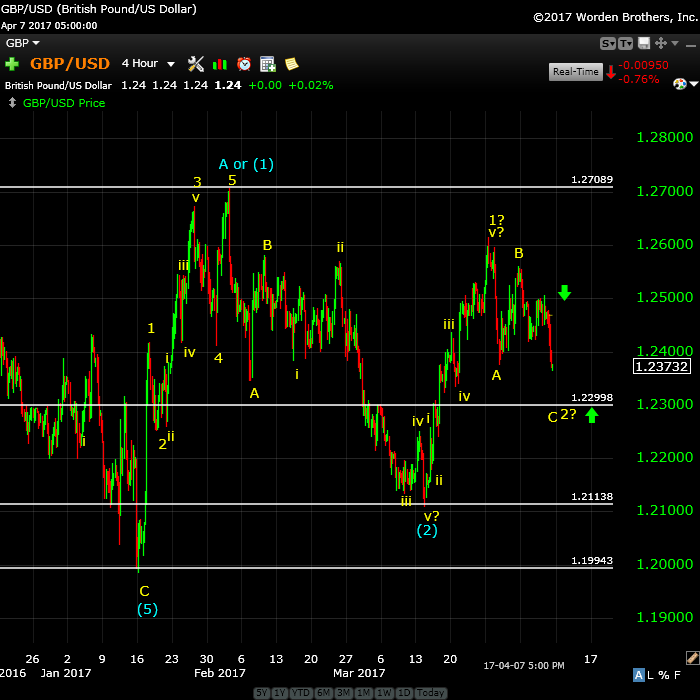
Above is the 4 hour chart of GBPUSD. I can count 5 waves up in this pair but because the wave did not reach the previous 4th wave at 1.27089 or so, I have my doubts that the current wave down will remain above the 62% retrace level (1.23). So, we could drop down to the 1.21138 area. Either level, as long as it holds, will be a very good entry point for the final wave up to the eventual target of 1.52.
More information on the short term prognosis in the video.
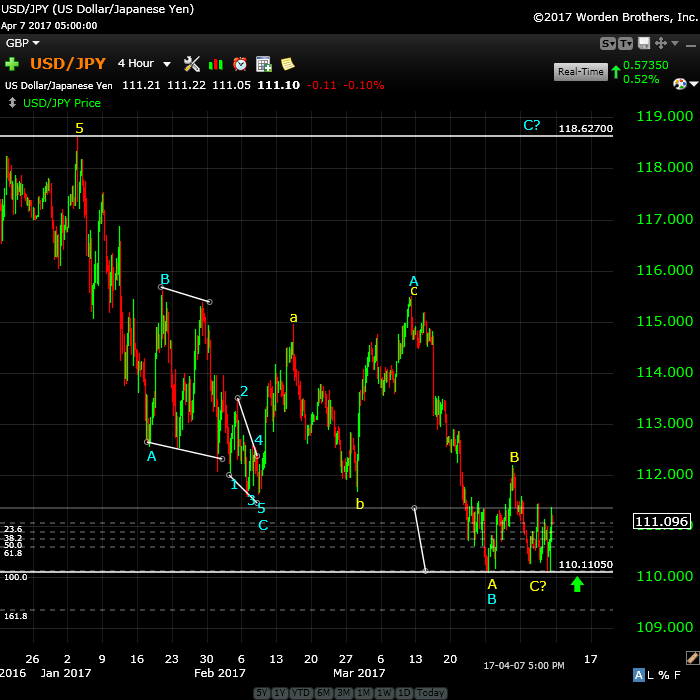
Opportunity. Above is the 4 hour chart of USDJPY. We finally have a strong double bottom here and we’ve completed a small degree wave up to a previous 4th wave top. I would be looking for a retrace to 62% (~110.60) and a turn up at that point.
The target for the wave up is the previous high at 118.627. A turn there would start a very long wave down (but we’ll get to that after we’ve reached this first target).
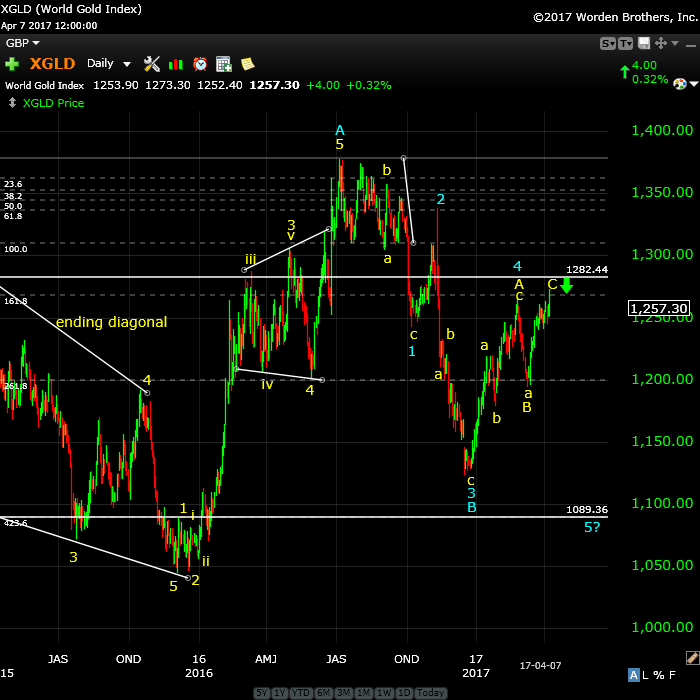
Opportunity. Above is the daily chart of gold. We reached the double top (and a little bit more on Thursday/Friday) and then had an extremely strong reversal. The structure is now clearly three waves. Expect a drop to at least a new low.
I have measured a potential bottom of 1089.36, which would be a measurement of the a wave at the very top of the wave structure (you can se my fib tool in place).
Silver dropped even further. If you missed the entry, I would wait for a 62% retrace before going short.
I’ll refine the target once we see an A wave (or first wave) down.
When we reach our target, we’ll turn back up. The final upside target is around 1585.
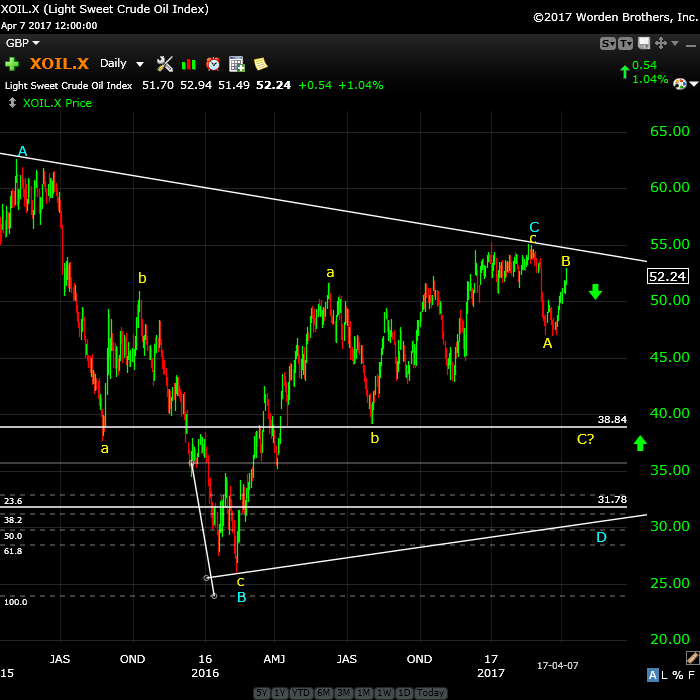
Opportunity. Above is the daily chart of WTI oil. I have a count that suggests we’ve done the first 3 waves down of 5, which when complete, will form the a wave at about 42.78. We’ve rallied to the previous fourth and that’s where we sit now. I’d be looking for a short entry right here.
Once we hit the a wave target at about 42.78, expect a turn up in a B wave to somewhere around 51.50 before a turn down in a C wave to our preliminary target of 33.00.
Finally, we should get an E wave up to the upper trendline to complete the larger pattern. That would be followed by a final 5th wave down to a new all time low.
Good trading!
_______________________





Mr. Temple,
You are tops in your field. Tried to follow Elliot Wave international for years. They were always behind the market. After discovering you, I perceive that you are an expert in reading the waves, which puts you way ahead of the rest of your peers. It is important for followers to read and understand the entire website in order comprehend exactly why Elliot Waves accurate. And you can read the Waves like you are reading tomorrows financial section. I pray you stay healthy. Don
Don,
Mr. Temple was my father (lol), but other than that, many, many thanks for your comment!
And I agree on EWI. I have a friend who lets me view their service through his subscription. I often joke that if I have the same count as them, I get very nervous … I lost quite a bit of money listening to them in the early days before I decided I was going to be better than them. But in all fairness, they turned me on to Mr. Elliott, so without their work, I would not be doing this.
I don’t wander in their very often, but enough to know they haven’t improved much.
In the speaking business, we often say, “Speak about what makes you crazy!” I think that also works in business to some extent, too.
Thanks Peter for making these changes!! I didn’t get a chance to respond to your email for feedback but I do remember thinking “he’s giving too much away in the free blog!” last week with your generous offering. I also appreciate you being willing to share some entries and exits. I have not as yet stepped into the world of currencies or futures, but would like to learn more. I am already in some inverse funds for the current ride down. Thanks!
Thanks, Ellen. I do entries and exits through fibonacci levels and often print the numbers. However, this is a swing-trading site where entries are not always a specific number, and I expect experienced traders to do stop-losses. With the extraordinary time I put into charting and analysis, I simply couldn’t afford the time to do all that additional work. It would be overwhelming on so many assets (particularly currencies). Emini futures are much easier and so I try to be fairly accurate there.
But I try to give as much guidance as I can.
Agree Peter. I have found the free blog area distracting. I think providing your entries, exits and stop losses would compliment your service very well and I look forward to that as sometimes I don’t have time to read comments during the day and a simple trade entry or exit would be more useful.
Qwertyqwer26,
As per my comment to Ellen, doing much more than I do now would be overwhelming, and I do provide fib levels in the charts (as well as in the videos). Those are entries and exits. But I hear you.
Hi peter
In the gold I think you meant to say 1089.36 bottom not 1189.36
Also what do youth ink is the mini bottom before retracing 62%
Thanks
Kurt,
imho, 62% isn’t an issue anymore because we definitely have 3 waves up so this structure has to retrace the full length. But if you want a number from the low to the current top (where we are), it’s 1180.
Thanks for the comment on my flub. I hope everyone else “got it.” I’ll go check the chart, as well.
Oh, it was the chart you were referring to: Fixed it. Thanks again.
Peter, you already provide guidelines for entry and exit. Providing exact entry and exit is another thing all together. But even your guidelines on today’s posting for USD/JPY guideline for entry after the triple bottom was plenty helpful to me. On another note, Andy has a turn date for April 10th for EUR USD. Though you have it potentially continuing to 1.049, I wouldn’t be surprised if it turned up tonight. After all, he did just missed the April 3rd turn date by 2 days. But I guess it could also turn up after hitting 1.049 in the next couple of hours 🙂
EURUSD could turn up here, but it will only be a 4th or a B wave. It still has further down to go. It won’t turn up in what I call “the middle of nowhere” – there’ll have to be a fib ratio of previous low to set a bottom.
Let me just add, that I expect to see corrective bounces on Sunday. That’s generally what happens. I also see a potential one in other currency pairs, but as everything is moving in tandem, it won’t last.
So you are saying it’s a short to 1180 from here
That’s what I would expect.
Actually, about 1124 is the low in Gold. I’m now at my office computer.
The new free blog post is live: https://worldcyclesinstitute.com/market-noise/
I’ve also made the link live to the Webinar area, so you can now sign up for the Thursday webinar. I’ve decided to wait a week for the new platform. (Too much on my plate).
My oil shorts are burning a hole in my account so think I’ll have to close them and wait for the picture to get clearer. I think this oil rally has gone too far to fit with the current EW labels.
At the moment, it looks like ES will just hit the 2361/2 target and head down. We’ll see. It’s struggling. It also looks to be doing a fourth wave.
It also appears that the SP500 has not reached 62% (it’s close) and that’s also holding up the turn down.
62% for the SP500 is 2367.20
USDJPY is retracing in a second wave. The 62% level is at 110.70. the opportunity is long at that level.
es….looks like 5 down on 3 min charts…..is short a 62% retrace …your thoughts
Not quite. It will need to hit one of the previous lows to get a bounce. My quick measurements suggest 2348 might get a bounce.
Looks like you were right. We look like we’re heading up in a second or fourth wave, on or the other.
The larger wave is a third wave and should bottom around 2319, by my measurements. Much more down to go after that.
Robert,
I think I’m still in my vent mood (grrr).
I was “thinking out loud” when I replied to your comment. The thing I should have done was applaud you for the 5 waves comment, because I want everyone to be able to differentiate between a 5 and a 3. These are not motive waves, so my comment about the length didn’t really relate. In corrective waves, the length will be whatever it wants to be.
But the five waves means we’re going lower after a retrace of somewhere between 38 and 62% (in a corrective market), but most of the time it’s 62%,
The wave up in ES looks like an A wave. It’s not in 3, so I’m not sure if we’re going to turn down after a double top or go back up to test today’s high.
Still a very difficult market.
The Market Update for Tuesday is live at the top of the post.
I’m seeing moves in just about everything to the downside tonight. Nice moves in ES and NQ.
So I’d call this a good call by Andy P.
USDJPY appears to be in an ending diagonal, but should reverse right about now (somewhere near 110.53).
Be careful with gold. Don’t ride it past your stop. So far, it’s a corrective wave up, but it could double top or worse. We’re becoming quite volatile.
I’d call USDJPY off-limits at the moment. It didn’t set up.
I’m not sure what it’s doing. It looks like a great big ending diagonal, but picking a bottom is suicide in those things.
I place a chart of USDJPY at the top of the post showing what I’m seeing as an ending diagonal. No action until there’s a reversal.
The wave up in ES/SPX (5 min chart) is in three waves. When it’s done, it will head down to a new low.
USDJPY seems to be bottoming. I’m not suggesting action yet, just something to watch. More in tonight’s video.
Looks like Andy was spot on with Apr 10 turn date for EUR US on the daily chart
Yeah, although as I mentioned last night, not a major turn, I don’t think. I still see more euro downside.
The Market Update for Wednesday is live at the top of the post.
Morning Peter
I’ve been meaning to ask, do you have a ball park date for the release of your Elliott Wave course.
Thanks
Michael C
Not right at the moment. But when I have it, I’ll let everyone know.
USDCAD has just broken the previous low, so I’d consider it now in the third wave.
Does this mean we should get in now or wait for a 62% retrace. What’s the entry point.
I would wait to see what happens. The best thing is to wait for a retrace of some sort. But I would think the next major move is down as it broke that barrier. To me, that would fit with a move up in ES. This is one crazy market and it’s difficult to figure out what’s going on today.
I feel OK that I can’t figure out where the US market is going … it can’t figure out where it’s going! What a mess this morning. Nice market to stay away from until it decides where it’s going.
looks like its heading down now though
toms energy chart also suggests drop into end of today and rise tomorrow with a hard down into the rest of thursday. Ive been short today and bank some gains. will reshort if it rises tomorrow and close out end of thursday.
From my perspective there are too many options to be able to make a call with any conviction. I count 5 waves down in ES (almost), but it we take out the low, then we’re likely still going to go down. But I this looks more like triangle action to me.
It looks as if we’re close to a bottom in ES/SPX.
Market Update for Thursday is almost live at the top of the post – give it until 7:40pm EST and it should be there. Still uploading.
I place a chart at the top of the post (ES).
ES/SPX appear to be on the way and the USD currencies also appear to be turning. Oil close to the retracement target and gold and silver slightly off the highs.
In ES, if this is a triangle, which is looking more and more likely, I put the upside target at about 2367.50.
I get that by measuring the height of the AB wave. The CD wave is typically. .618 X that height.
I got long ES at 2344. I was short AUDUSD but got out as I think it has to test the top. However, if it makes a low below .75725, I’ll be back in short.
The target for USDCAD on this retrace should be 1.3367, which will be an excellent place to get short. It should head up in 3 waves.
Sorry, that was 2334 that I got in. It was the 62% retrace level. I’ll also talk about this in the chart show.
A note about USDJPY which I’ll talk about in the chart show. It’s either not bottomed or this this is not an ending diagonal. If it’s an ending diagonal and it’s done, it should shoot up out of gate. But it’s not.
So I’d be super-cautious.
ES. I just got out. I don’t like what it’s doing. We only have 3 waves up and this wave down has extended beyond the 62% retracement level. There’s a Pancholi turn date on Monday, so we may have to wait until then for the turn up.
So …. caution here.
Hi Peter
Andy has a turn date of the 17th for the S&P. Do you think this is a “downturn”?
I believe the markets are closed tomorrow and deciding if I should get in today
Thanks
And just as the chart show ends, we blow below 2336 & get a new low in ES. Are we looking at a “Do Over” scenario?
The USD pairs still aren’t finished retracing yet.
Looks like we morphed into an ending diagonal. I have 2325 as a major inflection point, so we’ll have to see what happens on the weekend. The triangle is still an option but we’d really have to turn up here. The other option is some sort of zigzag, but it doesn’t look like that.
The Chart Show is live at: https://worldcyclesinstitute.com/april-13-2017/
There will be no Market Update video tonight as the markets are closed tomorrow.
A new blog post is live at: https://worldcyclesinstitute.com/fifth-waves-corrective-or-not/