
Changes to the Free Blog
Last week, I ran a bit of an experiment in the free blog area. I shared the prediction specifics for ES, complete with entry and exit points. I alerted this group to the potential for a rise to either the 2266 or 2276 area with a subsequent CAUTION alert when it became clear the higher target was in play. I also posted the “Timing the Top” video, predicting the ultimate top.
The response I got was less than desirable (from my standpoint). As it takes me an average of five hours to create a blog post here, I’ve decided posting this level of detail, along with extensively research articles is not a good use of my time, not in this venue, at least.
The free blog area seems to be an area for people to communicate about the market, and that what I post here is of much less interest. That’s fine; it “is what it is” and far be it for me to mess with the interests of an audience.
Time is primarily the issue. My time spent here reduces my writing time, analysis, work on my EW course, and of course the book that I’ve been attempting to finish.
The other issue is trading. These are difficult markets, illustrated by the fact that so many hedge funds are going under or simply ceasing operations. I’ve learned to stay away from markets with no clear direction or at times when my concentration is not at its best.
However, after returning to trading three weeks ago, my account is up 42% using EW analysis (price cycles). I expect it to reach 100% by the end of wave four in the US indices. I trade with confidence in markets that EW analysis tells me will be lucrative. I try to stay out of the others.
I’ve attempted over the past year and half or more to help show the benefits of Elliott wave analysis here, but feel it’s being, for the most part, ignored, perhaps because it’s not understood well, or not communicated in full but, on the other hand, the tools to learn are nearby.
A good deal of what goes on in the free blog area of this site is what I refer to as “market noise.” Many years ago, when I started trading, I followed news and other events, thinking that it would enhance my trading. However, as I’ve said many times, the direction of the market is not based on news; it’s based on the mood of “the herd,” and that herd is comprised of traders and investors worldwide.
As a result, the market will only turn when the worldwide mood has shifted to the negative side. It happens in five waves, and it’s a process. Every trend happens in five waves, market-related, or not. Humans worldwide do not change their mood in a single day; the waves reflect that slow turn in the perception of market participants.
There will be no turn in this market until the balance of the mood of the market participants has turned more than fifty percent to the negative side. My little Mensa mind simply cannot fathom any other way the market will turn; it’s simply illogical that it will turn on a dime. And hence, the proven concept of five waves in any trend will not be broken. This time is not different. Thinking otherwise is “herd thinking”; it’s not contrarian thinking. And as professional traders know, contrarian thinking is what you need to have to beat the market.
About fifty years ago, when I was eighteen, I went through a battery of tests to measure personality traits, intelligence, and a host of other psychological factors. (My English, rather conservative father thought I was “nuts” because I had no interest in being a doctor or lawyer, and quit the University of Toronto after a year. I’d also spent half a year in hospital with Crohn’s disease, but that’s a much longer story for another time … lol).
I learned through those tests that my ability to mentally manipulate three dimensional objects in space (spatial awareness) was “off the charts.” A subset of this ability is pattern recognition, moreover the ability to see similarities in multiple patterns.
It’s considered such as important ability that this ability is a good part of the Mensa exam, and of course, I searched all those questions out and completed them first when I took the exam much more recently. It’s also the core of Elliott wave analysis—the foundation of this principle is pattern recognition and probability.
Learning about that ability early on has served me well. I ended up with a degree in television in 1974—a wiser choice than manipulating three dimensional human organs in space …
In my career as a professional television writer/producer/director, I excelled because I could imagine the entire sequence in my mind before I got down to the creating it. I could tell my cinematographer or videographer (as the medium changed) where to put the camera for the shot I wanted, and direct talent and lighting to get the ultimate effect I desired.
And yes, I dream in colour—major motion pictures that are truly engrossing—but thankfully, only when I’m really, really tired. (!)
However, after 35 years of commercial and corporate television, and building a couple of million dollar plus companies, it was time for another challenge.
I found trading and cycles (and the deeper work I do now) and have dedicated my life to helping others understand how the world works in that regard; how humans take advantage of fellow humans at varying degrees during the ups and downs of those cycles. It’s like clockwork, and similar events pop up at specific degrees of each repeating cycle.
My experience (over 20 thousand or so hours in the market) has proven to me that “price cycles” work much more effectively than “time cycles.” Used together, they’re highly predictive. I use time cycles to support my price analysis.
My key trading principles tend to be these:
- Trade what you see, not what you think.
- Know when to be out of the market (usually more often than in)
- Have an exit point
- Take a level of risk based on probability (and volatility)
- Limit external “noise”
As a result, for the most part, I stay away from fundamentals, or trying to guess causes of market moves; I try not to mix news with technical analysis. In my world, there is little correlation.
I don’t look at other people’s charts (or counts). I have no interest in discussions about what might happen “here” due to something happening “over there.” Staying as objective as possible has the key to successful analysis. It’s the times that I allow outside influences to affect my thinking about an Elliott wave count that I get into trouble.
I’ve also learned that I see pattern correlations that others don’t see, and that often my ability to communicate in limited time and space here is not an effective means of getting across my message.
So, I’m moving on from what to me has been a frustrating challenge. I will instead leave this blog to be what it has become.
I’m moving back to creating more video and will post these and other article on the main landing page of the site. Some will focus on the market, but most will cover topics that relate to what’s going on in the world and the role of cycles in the the events that are unfolding.
I’m not trying to be anti-social. I’m just trying to explain my philosophy and how it affects my decision to limit my exposure to what I consider “market noise.” It’s a key principle I follow that has made me a much better trader and analyst.
At the same time, I’m committed to making your experience here the best I can, keeping any personal attacks away from the site, and providing insight into what I feel is one of the most powerful tools discovered. I will continue to answer questions, but will only visit after hours on a daily basis.
I’ll continue to post charts, but will move towards past “wins” and lessons from them rather than predictive charts (with long explanations as to the expected market movement).
This weekend, however, I’m taking a “break.”
The Market This Week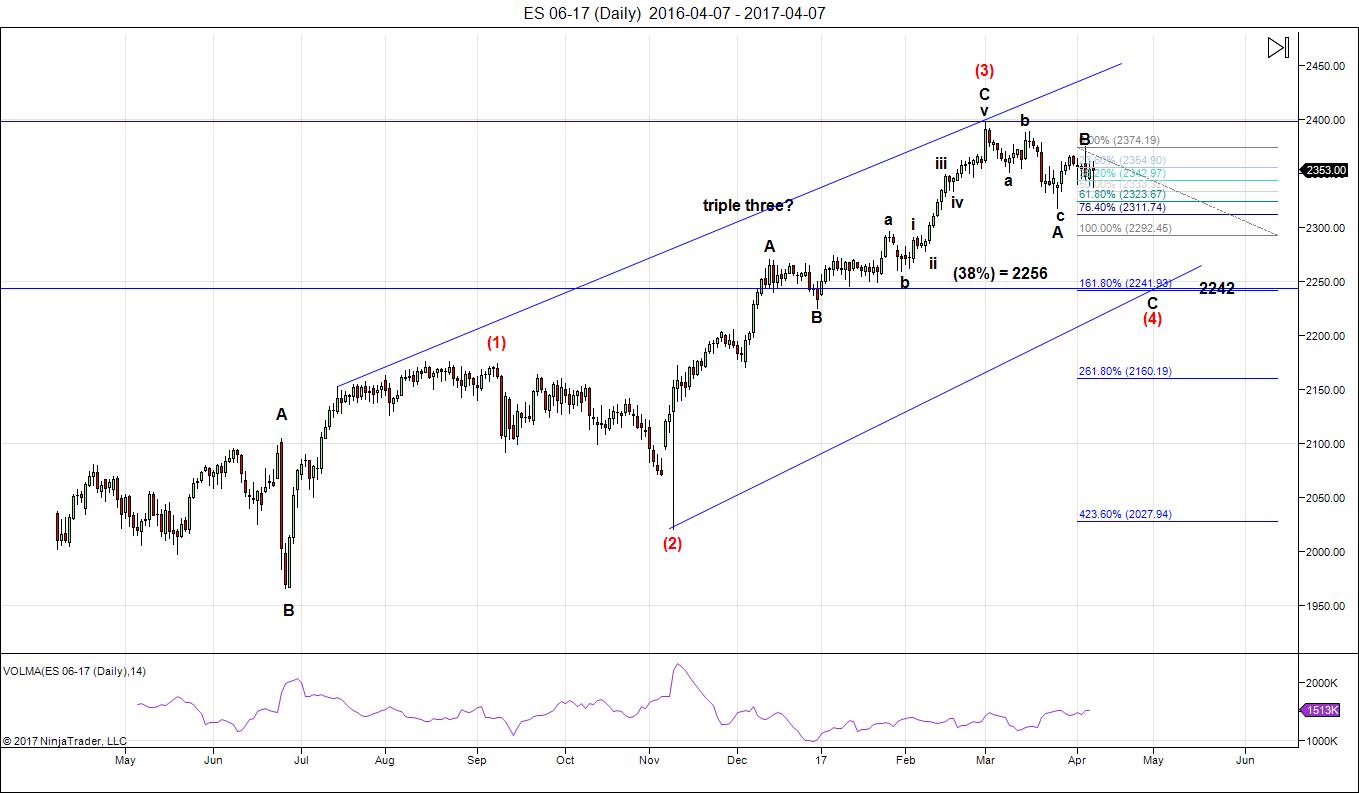
Above is the daily chart of ES (click to enlarge).
We’re at the top of the B wave of an ABC 4th wave correction. The C wave down will most likely be 1.618 times the length of the A wave down.
After completing the larger fourth wave, we’ll have one more wave to go, which could be an ending diagonal as a fifth wave. The long awaited bear market is getting closer.
_____________________________
Sign up for: The Chart Show
Thursday, April 13 at 2:00 pm EST (US market time)

The Chart Show is a one hour webinar in which Peter Temple provides the Elliott Wave analysis in real time for the US market, gold, silver, oil, major USD currency pairs, and more. You won’t find a more accurate or comprehensive market prediction anywhere for this price.
Get caught up on the market from an Elliott Wave perspective. You’ll also get Andy Pancholi cycle turn dates for the balance of the current month. There’ll be a Q&A session during and at the end of the webinar and the possibility (depending on time) of taking requests.
All registrants will receive the video playback of the webinar, so even if you miss it, you’ll be sent the full video replay within about an hour of its conclusion. For more information and to sign up, click here.


DOW Jones Seasonal average for post election years usually moves up from April until August 1 and then down into early November. Seasonal average for 10 year cycle in year 7 of decade usually rises January into August and then falls into November. Interesting overlay of seasonals trends.
Thanks for the update Valley, I plan on exiting the long trades by July 14th. I do plan on going long after the first week of May. For now, a few short term trades long and short. All the best.
You are welcome! Congrats on your short this week. Apogee is on 15th and likely pattern (since Declination hits far South on 17th, and moon phase is post full moon and passing lunar square) is for DOW to rally next week especially post Tax Day in US. However, Monday is 17th and two days after apogee which has sometimes offered a huge sell off that quickly retraces (same day or within day or two). So, if we get huge sell off on Monday/Tuesday, I will add some Calls that expire mid summer also.
Here you go, Valley
1) Year 7 and Post election year seasonality: http://imgur.com/a/hznV4
2) Both charts merged together: http://imgur.com/a/XjkXR
Wow, very nice. This aligns nicely with my own cycle as stated above with Valley.
Much appreciated.
If all this phenomenal info is considered noise for some, it is music to my ears. Lol. I have never seen a group of traders with such diverse talents. Ew is certainly not some thing I believed in, in the past. But slowly coming around to seriously enrolling in Peters weekly presentation. All the best everyone.
Thanks!
Wow Jody, you must be tired out mentally and emotionally. I feel so lethargic , like an old worn out mule. Lol I agree ,they may ramp up the futures Sunday night. Mr Market is not going scare me out. I plan on taking back my 2 batches Monday, still looking for a temp low late next week. Dangerous move on my part due to option week. All the best
Verne, I made a mistake. I thought it was Jody who made the comment on jacking up the futures.
No worries!
JOHN
Sorry i am so late, but i have Apr/ 21 and Apr/ 30 as TP’s
Thanks ….Nick
No problem thanks for your dates,,
Told you last week that 4/14 is 103 days in the year and 103 aligns with 4/14. S&P closed in the red 4/13 but recovered overnight. This was the 4/14 date. 45 degrees brings 4/19. 4/19 is also last quarter so gravity is low. And this is a special last quarter as the sun enters taurus 4/19. 4/19 also peak in spiral timing. Then 4/20-21 a low. Hebrew timing on 1942 gives a high 4-25 and a low 4/30. After that I expect a high 5/4, a low 5/11 and a high 5/18,
US markets will make a high 4/17, when europe is closed. Europe wants to make it’s own high so 18 will be a low. Hebrew timing on 1929 gives a high 4/19 and delta confirms.
Cheers,
André
Thanks for your update Andre.
Hi Andre, could you please recheck your April 25 date and April 30th. I have 4/30 as a high and 4/25 as a low. Thanks
Dave,
4/25 will be a high. But may 1 could also be a high. 5/19 is a major high so the market will try to stay levitated for a while within a long term down trend.
See high 4/25, 5/1 and 5/5 before we dive into 5/10-11.
Been working on a new timing technique I can’t disclose. But this brings new insights. Have to analyze this some more and may change my forecast.
Will give some more arguments later today.
André
But 5/25 will be a high; no doubt about that. as will be 4/17.
I fully agree with you for a high on the 17th, as I will be buying back my shorts I sold on Thursday. The 25th we shall see. Thanks Andre.
Andre, I noticed you did indeed elaborated further on my Question. Thanks
Some background.
717 moons (Carolan) connected 1987 with 1929. This lookback period now gives a high 17, a low 20, a high 25, a low 27 and a high 5/4.
The 20 year cycle gives 4/19 high, 4/22 low, 5/3 high.
The 1440 cycle gives 18 and 28 as dates. one metonic year gives a high 17 and a low 4/26. 4 metonic years give 18/19/20
Combined I think the highs will come 17, 19, 25, 30 and 5/5,
So we need lows in between. like 18, 21, 27/28 and 5/4.
For next week 17 high, 18 low, 19 high, 20/21 low. As I said yesterday 19 and 20-21 are the strongest dates. Next is 25.
We had a sharp impulse up off an interim low on Friday and it sure looked like a bottom was in. Then the market headed back down to make a new low and in fact close just at about the day’s lows. When I look at the Elliott channel for this possible fourth wave something just does not look right with a bottom here. It really should go down and tag a parallel channel of the second wave to have the right look. I do realise that would not necessarily happen with a rising bearish wedge but this correction seems way to brief to end here after a parabolic run higher. Something about a bottom here just does not cut the mustard for me personally. Furthermore, despite the move of VIX above its 200, the paltry decline so far suggests that not much of the historic market giddiness evidenced by that historic duration of VIX trading sub 11.50 has been dispelled. What could be going on??!!
I think the b wave of this decline is not yet done and that we need a smaller c up to complete it. Just look at the proportions for the wave 2 decline last June and it is clear why that would be a reasonable possibility. A sharp c wave up would be the mother of all bull traps as folk jump on board expecting the fifth wave up was under way, just before the brutal C wave down, probably a sharp zig zag, completes the fourth wave. Generally VIX does not spend an extended period above its 200 dma so I would expect to see a sharp decline back below it as the c of B wave up rips, followed by a true capitiulation spike as C down completes the fourth wave.
I seriously doubt we are going to see new all time highs considering how little selling there has actually been in the market during the decline so far. Just my two cents. Some ascribe it to entrenched bullishness and I think they are right. I expect Mr. Market to buck off a few more riders ahead of the final move up. Then there are those who think that’s all she wrote; we will see!
Interesting. I just got a note in my inbox from Avi Gilburt who also thinks the B wave of this correction is not over. I was wondering if anyone else had the same idea. He thinks we are only in a large degree third wave up and does not expect the top this fall but rather a large degree fourth wave correction and a final top in 2018. On that latter point I disagree. The rising bearish wedge is close to completion and in fact I think it will complete at an accelerated rate with the final fifth wave up being relatively short and sharp. I also cetainly do not dismiss out of hand at least one wave count I have seen that suggests a top is in. We have broken some years’ long trend lines in many indices.
https://www.elliottwavetrader.net/scharts/Chart-on-S-P-INX-201704131568.html?utm_source=FB&utm_medium=Web&utm_campaign=AviSPX
Peter,
Only been here a few months, but I looked forward to your weekly commentary. I find the other comments interesting, but I come here for your analysis. Thanks for sharing.
Thanks, Ken.
🙂
Stan Harley uses cycles based on the square root of 5 and the root of fibo’s.
Anyway; when we use this on day/week/month and year we see that the strongest week count this month is 4/19. The next strong count is 5/11. Think both of these dates are significant. Bayer’s ‘A time and times and half a time’ technique gives extremes 4/17, 4/21 and 4/25, The previous extreme was 4/8.
Fibo counts gave 2 fibo weeks and one fibo month 4/10 (was the high). 2 fibo days 4/13 (low). Next 2 fibo days and one fibo month 4/16 (easter Sunday), one fibo week 4/18 and a fibo month 4/19. Then 2 fibo weeks 4/21. Lucas weeks gives 4/18, 4/25 and 5/1.
See? Whatever timing technique we employ; the same dates show everywhere. 4/17, 4/19, 4/21, 4/25 and 4/30(5/1) are the strongest dates this month.
4/20 is a special date. 4/20/2005 was a low, 4/20/16 was a high. This date is not as strong as 19 but it will be tested. So 19 will be a high but 20 the strongest down day. 4/21 the low and then up into 4/25.
Think 4/25 is very sigificant. It is 45 degrees from 2/1. 2/1 comes from the square of 9 on 1942. 2/1 should have been THE high. Some short term cycle ran a little further. But a 45 degree overthrow will give a very sensitive date.
The death zone is 49-55 days. As 3/1 was the high, the deathzone is 4/19-4/25,
Both will be highs with the mdpoint (4/22 is Saturday so 4/21) a low. From 4/25 ABC down into 5/11.
Happy easter.
André
Just having some fun with timing. 4/25 will be 90 (!) Gilmore months (Gilmore factor is 1,272) on the 2007 high. 4/17 is 161 G-months on 2000. 4/30 is 400 G-months on 1974. 1974 was a low so a low 4/30(5/1). 5/15 will be 59 G-years from the 1942 low. 6/10 will be 69 G-years from 1929. Note this date; something will happen then. 69 is a very special number as it is the sign of pisces turned 90 degrees.
Compare this to what I wrote above.
Very interesting! Looking at the chart, if we are about to complete a D wave up of a triangle it would make sense for a high around the 19, followed by the E wave down starting April 20. It is interesting you have that as the strongest day down so this implies a possible break through the bottom of the triangle with a bottom on the 21.
If we get a high on the 25 that would imply a continuation of the downtrend after a corrective bounce and I not you do call for an ABC down into 5/11
VIX has broken above a falling wedge and the measured target is around 20.
Thanks for the post Andre, most thought provoking!
Happy Easter Everyone! (first sunday after the first full moon after the spring equinox)
Same to you Valley. May you be blessed with the most profitable trading, Post Easter that you have ever had and every one else !!
I looked at about 20 years of Investors’ Intelligence bullish/bearish %. Bottoms were fairly consistent, below 30% bullish. Tops not so easy. The best I could see was when both bullish and bearish % were equal around 40%. I do not kn ow what you were expecting last week, adulation, mass subscriptions? I looked back to 2015 and you have been consistently calling the final ending diagonal. That looked good for a few months into Feb 2016 which was a nice drop but you were calling for 1350. Mostly the ending diagonal predictions were very soon, the difference now is it is extenndd out until the fall. I feel sure you quit trading for a while because of losing money, most of us are like that.
the rear view mirror is a wonderful ‘tool’…kindly share your insight into the future with ew and technical charts that graphically depict/support you forecast…
A new post is live at: https://worldcyclesinstitute.com/elliott-fourth-wave-combinations/
This website is for educational purposes relating to Elliott Wave, natural cycles, and the Quantum Revolution (Great Awakening). I welcome questions or comments about any of these subjects. Due to a heavy schedule, I may not have the time to answer questions that relate to my area of expertise.
I reserve the right to remove any comment that is deemed negative, is unhelpful, or off-topic. Such comments may be removed.
Want to comment? You need to be logged in to comment. You can register here.