
Ending Diagonals Everywhere!
For over four weeks, we’ve watched the rally in the SP500 trace out a corrective wave up from the low of 2553.60. We began with what was a textbook contracting triangle. Then two weeks ago, the Nasdaq indices suddenly rallied into an ending diagonal.
On Monday of this week, the SP500 (and ES) followed suit and also began to rally into an extremely weak ending diagonal. The third wave that we’re in has about another 15 points to go to a new high to technically complete the third wave of that ending diagonal.
But that’s not all that’s going on with ending diagonals: These are the players that are all working on ending diagonals — SP500, ES NDX, NQ, Nasdaq Comp, Russell 2000, and Russell 3000.
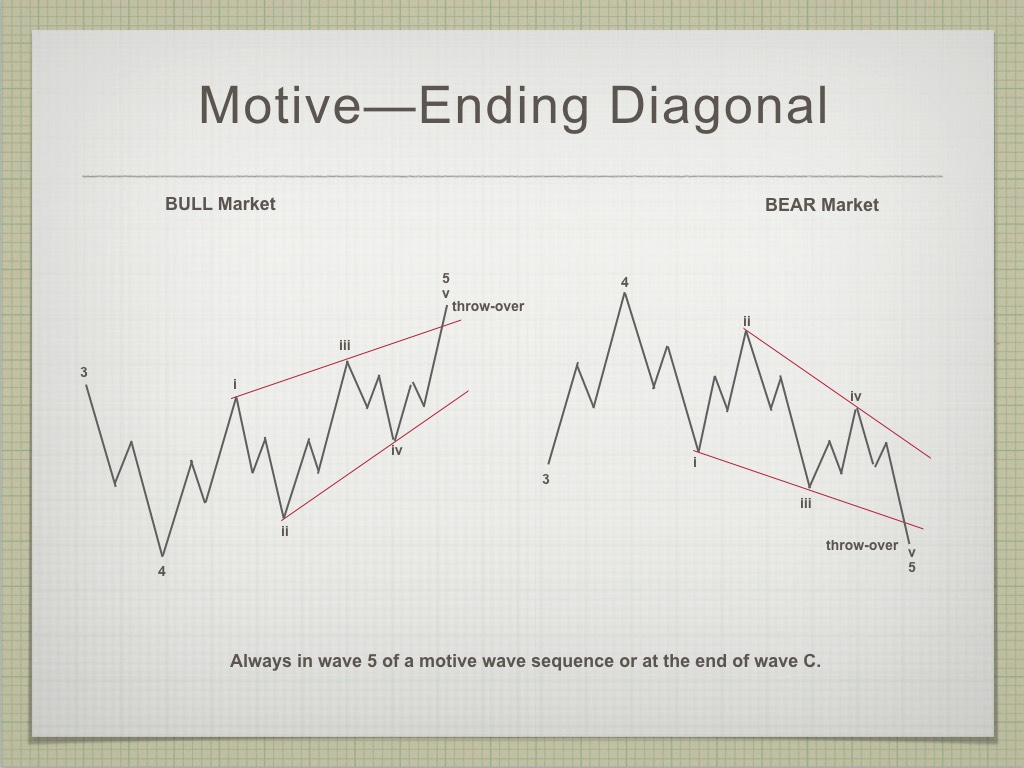
Ending diagonals are ending waves. I consider them corrective (although, in Prechter’s book, they’re contained within the section on “motive waves.” In a fifth wave position, which we’ve “morphed into” this week, they foreshadow an imminent trend change. That’s a hard rule that will NOT be broken.
An ending diagonal is different than an contracting triangle in that it has a slight upward tilt to it (a diagonal pattern) in a bull market. The other difference is that the waves get shorter and shorter as we move through the pattern. The fifth wave up has to be shorter than the third wave up. That put “a cap” on the market.
An ending diagonal is a fifth wave pattern, as opposed to a contracting triangle, which is a fourth wave pattern. This difference doesn’t make much difference going forward.
I any event, we have one more wave down and another one to the upside it the US indices before the trend changes. In each case, the final fifth wave cannot be longer than the third wave, so this puts a limit on the distance this market can march higher. It looks like it won’t get much above a new all time high. The inherent weakness is abundantly obvious. Volume is almost non-existant. Sentiment continues at historically bullish levels.
On Thursday, the European Central Bank announced that is has virtually given up and it’s stopping its quantitative easing, which will be deflationary.
The US dollar has one more wave down to a new low to complete the large corrective fourth wave that its currently in. Then is will turn back up for good. That’s also highly deflationary. The Federal Reserve is trying to reduce its balance sheet — also deflationary.
As I’ve been saying for several years now, we’re heading into a deflationary spiral. If you’re on the right side of the market and understand what this means to the value of money (and take advantage of it), you’re going to be just fine.
As I’ve been saying for the past couple of years, everything will top at the same time, but to do so, they all have to finish their final waves within Elliott wave rules.
After they all top, they will all move down together in what’s going to be the show of a lifetime. The drop in the eventual third wave (likely this fall) will be labelled “the crash” and it’s likely to be breathtaking in it severity.
There’s a really ugly full moon coming in October 24, which coincides with my musing on when we might see the crash. I’m focussed on that time frame for a potential crash.
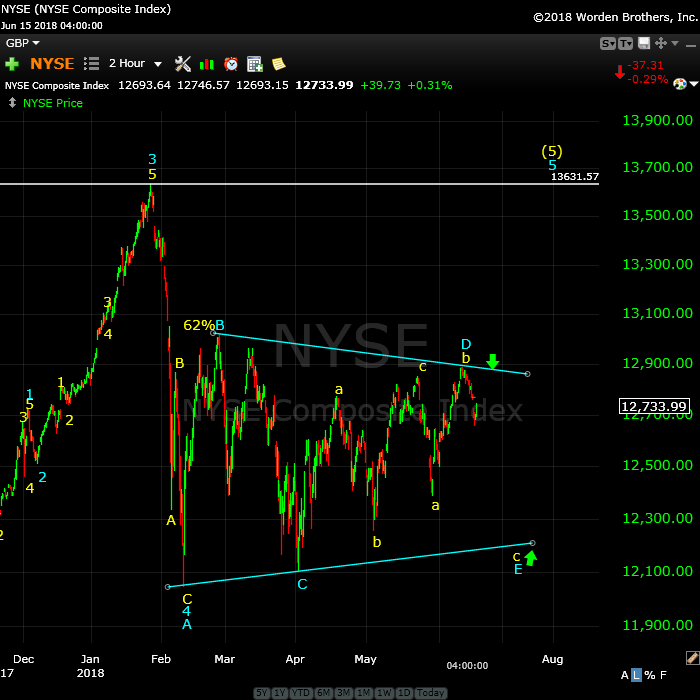
Above is the 2 hour chart of the NYSE (New York Stock Exchange). This chart is a good indication of the inherent weakness in the market. Many of the indices have transitioned into an ending diagonal (a fifth wave patter). However, the NYSE, which these other indices are a subset of, is still going sideways in a contracting triangle.
This contracting triangle will finish off the blue E wave down, while the ending diagonals complete their fourth waves down. They will all turn at the same time into the final fifth wave up to a new high.
_______________________
Elliott Wave Basics
There are two types of Elliott wave patterns:
- Motive (or impulsive waves) which are “trend” waves.
- Corrective waves, which are “counter trend” waves.
Motive waves contain five distinct waves that move the market forward in a trend. Counter trend waves are in 3 waves and simply correct the trend. These patterns move at what we call multiple degrees of trend (they are fractal, meaning there are smaller series of waves that move in the same patterns within the larger patterns). The keys to analyzing Elliott waves is being able to recognize the patterns and the degree of trend that you’re working within.
The motive waves shown above are typical in terms of their look and length. Subwaves of motive waves measure out to specific lengths (fibonacci ratios) very accurately. Motive waves are the easiest waves to trade.
Waves 1, 3, and 5 of a motive wave pattern each contain 5 motive subwaves. Waves 2 and 4 are countertrend waves and move in 3 waves.
Motive waves also travel in channels. The red channel above can be drawn from the apexes of wave 1 and 3 on one side and waves 2 and 4 of the other. The end of wave 5 typically meets the trend line on the wave 1 & 3 side before it reverses.
Countertrend waves move in 3 waves and always retrace. You’ll find much more about them in the countertrend section and the page on “The Right Look.”
To use Elliott wave analysis accurately, you must be able to recognize the difference between a trend wave (motive) and a countertrend wave (corrective). There’s very much more to proper Elliott wave analysis, but this gives you the basics.
____________________________
Registration for Commenting
Want to comment? You need to be logged in to comment. You can register here.
If you register, it protects your information. It also allows you to comment without filling in your information each time. Once you’re registered, simply go to the home page and click on the login link top right in order to log yourself in. Usually, you’ll be logged in for several days before needing to be logged in again.
______________________________
Problem receiving blog comment emails? Try whitelisting the address. More info.
______________________________
Have not had a losing week RW 2
Have not had a losing week …I have been with Peter almost a year. The only thing that matters is have I made money with his service. I think I have finally turned the corner using Peter’s EW. I have not had a losing week in the last 5 months. Thanks Peter, for your amazing amount of hard work. —RW |
Couldn’t be happier … KK 2
Couldn’t be happier …The analysis and insight you provide is simply amazing! I’ve been trading the futures and equity markets for well over thirty years and usually average around 5% monthly. Since joining your Traders Gold Service two months ago, that number has better than doubled. I couldn’t be happier.—KK |
the real deal SM 2
The real deal …‘Educational, insightful and thorough market analysis for all levels of traders. It’s Elliott Wave at its best….Peter Temple is the real deal’ —SM |
The best of them JL 2
The best of them …Last couple of years, I subscribed to several ‘market traders’. You are by far the best of them and the personal contact is awesome. Daily and daily updates are very well written! Besides your expertise in EW, I also like your cycles analysis. Best investment I ever made! —JL |
Tops in your field DZ 2
Tops in your field …You are tops in your field. Tried to follow Elliot Wave international for years. They were always behind the market. After discovering you, I perceive that you are an expert in reading the waves, which puts you way ahead of the rest of your peers. And you can read the Waves like you are reading tomorrow’s financial section. I pray you stay healthy. —DZ |
Rise above the rest … SM 2
Rise above the rest …I have only ever met a few people who, in their chosen fields (astrology, medicine, music, martial arts, technical analysis), rise above all the rest and you are one of them…you have ‘the gift’…and that’s why I’m a Trader’s Gold member. —SM |
A true expert in Elliott Wave FL 2
A true expert in Elliott Wave …You are a true expert in EW analysis. What you provide is not available anywhere and is priceless. Subscription on your services is the best thing I have ever done. Many thanks for your effort to make me a better investor. I now have more trust in my investment decisions. I hope you will continue the excellent work! —FL |
Get an upper hand … JC 2
Get an upper hand in trading …Seeing all the different currency pairs and the wave structures and hearing you explain why this has to do that on a nightly bases gives one a upper hand when trading. Elliott Wave applies to all stock and indices and can be applied to any candlestick chart. If someone ask what you want for Christmas – Tell them a membership to Peter’s “Traders Gold!”—JC |
The Market This Week
Here's the latest daily chart of ES (emini futures)
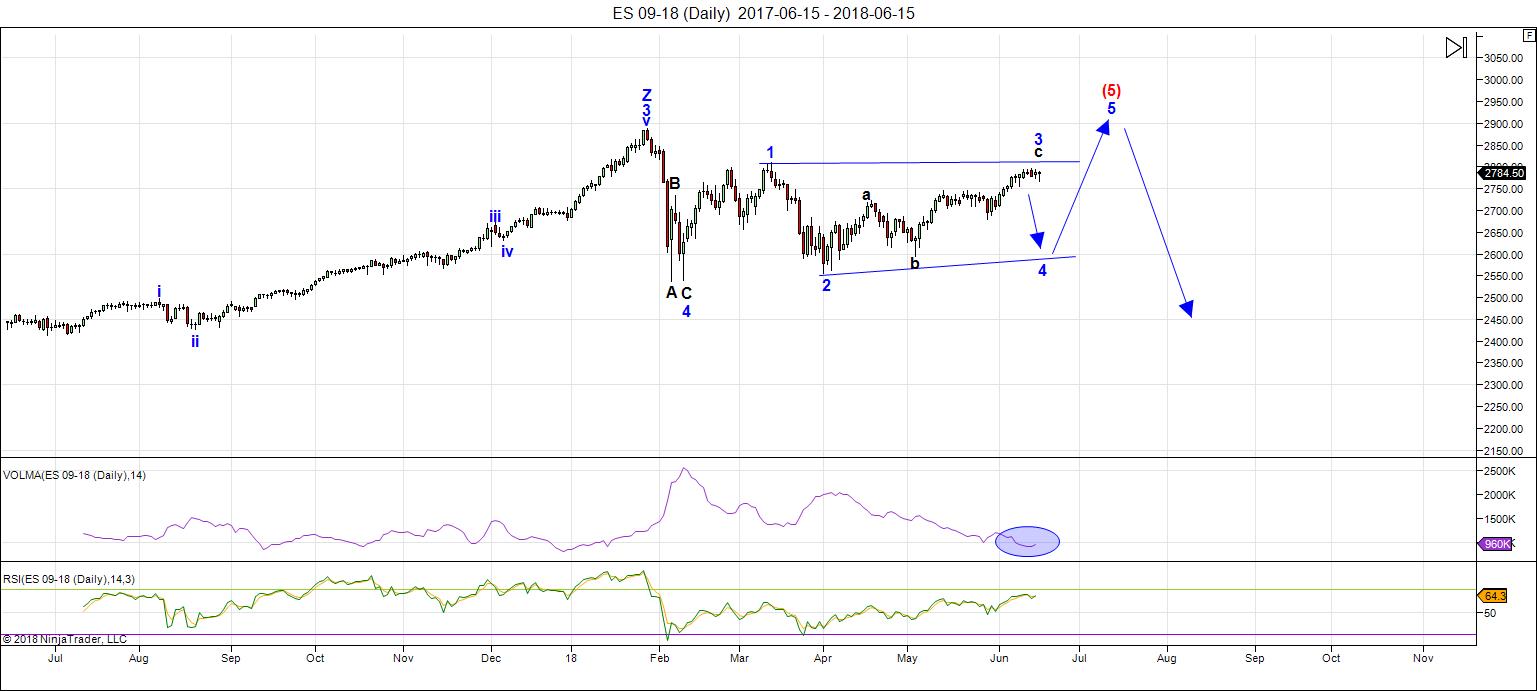
Above is the daily chart of ES (click to enlarge, as with any of my charts).
Last weekend, I complained about the sideways movement in ES (for three solid weeks). Two weeks ago we got a very fast resolution for the Nasdaq, as it morphed into an ending diagonal, by rising to a new high, tracing out wave 3 of that diagonal. On Monday of this week, the NYSE subindexes (SP500, Russell 2000, Russell 3000, and ES (emini futures)) followed suit.
We now have ending diagonals all over the place, except in the NYSE itself, the DOW, and OEX. The NYSE continues its contracting triangle. The DOW and OEX appear to be in fifth waves of some kind (the pattern is open to interpretation at the moment).
In the chart above, you can see that this ending diagonal move is subtle. It still looks much like a contracting triangle. However, the move to a new high in the third wave confirms an ED, although incredibly weak.
Note the low volume, with an ellipse over the current level in the purple indicator below the chart.
The NYSE indices are all extremely weak - that's what this configuration tells me.
Summary: We continue to trace out the third wave of an ending diagonal. We're very close to a third wave top (possibly Monday). Topping out will result in a high probability trade to the downside (the fourth wave of the ending diagonal). Once the 4th wave (down) is complete, expect a final fifth wave to a new high. That fifth wave up to a new high will be the end of the 500 year bull market.
___________________________
Trader's Gold Subscribers get a comprehensive view of the market, including hourly (and even smaller timeframes, when appropriate) on a daily basis. They also receive updates through the comments area. I provide only the daily timeframe for the free blog, as a "snapshot" of where the market currently trades and the next move on a weekly basis.
______________________________________
Sign up for: The Chart Show
Next Date: Wednesday, June 27 at 5:00 pm EST (US market time)

The Chart Show is a one hour webinar in which Peter Temple provides the Elliott Wave analysis in real time for the US market, gold, silver, oil, major USD currency pairs, and more. You won't find a more accurate or comprehensive market prediction anywhere for this price.
Get caught up on the market from an Elliott Wave perspective. You’ll also get Andy Pancholi cycle turn dates for the SP500 for the balance of the current month. There’ll be a Q&A session during and at the end of the webinar and the possibility (depending on time) of taking requests.
All registrants will receive the video playback of the webinar, so even if you miss it, you’ll be sent the full video replay within about an hour of its conclusion. For more information and to sign up, click here.


Thanks for the update!
I believe wave three needs to exceed wave one for an ES ED to be confirmed.
You did mention that in your summary but I missed it the first read through. Looks like another 20 points or so to get past wave 1 of the potential ED
Joe,
Based on the new moon high on June 13th that you mentioned…in your “experience” the new moon low you sited due July 13th…Will that potential low be much of a sell off or just a sideways choppy affair.
Thanks Peter
Borrowing Peter’s words from this update I am in total agreement with .
I could not pick and post more. Awesome update and it shows Peter’s attention
To detail :
we have one more wave down and another one to the upside it the US indices before the trend changes. In each case, the final fifth wave cannot be longer than the third wave, so this puts a limit on the distance this market can march higher. It looks like it won’t get much above a new all time high. The inherent weakness is abundantly obvious. Volume is almost non-existant. Sentiment continues at historically bullish levels.
On Thursday, the European Central Bank announced that is has virtually given up and it’s stopping its quantitative easing, which will be deflationary.
Thanks again Peter
You’re welcome. Frustrating market.
Ed, here is an updated chart for you but I have switched to 90 minutes so we could fit in all the channel points…yes, you are right about being back within the channel after some marginal overthrows above the upper channel line…
https://imgur.com/a/UyzHyU9
Peter G,
Thanks for the updated chart.
Interesting article .
My own thought is what happens if someone jams the signal ?
Could be accidental or on purpose or even natural https://www.bloomberg.com/news/articles/2018-06-18/hft-traders-dust-off-19th-century-tool-in-search-of-market-edge
Verne
I don’t have an opinion on price at the moment . The swing from New moon to solar eclipse is all I’m watching since
It is the start point . It should ideally be a choppy A B C downward move . If this week closes down then I’d expect
4 weeks of sideways action .
Verne
My bias has been and continues to be bearish for this year .
Right now I’ll include my thoughts above .
if this week is down expect 4,weeks of sideways action to follow
Yet….all suprises should be to the downside if this is indeed a bearish set up
Taking place .
I’ll be able to look much closer at the market this coming weekend .
Joe
Best guess on ES 2767-2730 with a potential reaction back to 2807.
Not my work though so take it with a grain of salt .
If the RUT goes back to 1608 ( not exact number ) then this present
Run up I’ll consider over. The next down then up sequence will tell
The tail.
Thanks Joe. I was a bit concerned about the ES ED as the third wave failed to move higher than wave one ahead of that Friday gap down. A second opening gap down today is looking more and more like the last wave up completed. The ED also looks a bit unusual as the first wave also failed to exceed the high of the previous wave of similar degree, putting much of the potential ED inside its price range. As Peter has observed, market weakness seems to be resulting in malformation of these final waves.
We are looking at tens of billons of buying power to close Friday and today’s gaps down and we are not yet seeing the huge green candles to indicate the deep PPT has gone to work. 🙂
Interesting that in July, we will see this astronomical event occurring in July. To add a little spice to the month, the full moon is sometimes referred to as the “Thunder Moon”, how appropriate. https://youtu.be/f3x7hPWKB2c
Another impulsive decline in ES. The waterfall candles were quickly arrested and they are throwing billions at futures to avoid breaking the cash session futures low at 2761.25. Tomorrow could be ugly.
Broken Markets!
Sticking with the bearish fractal. https://worldcyclesinstitute.com/from-the-crowsnest/#comment-30667
Hi John.
Any ideas as to what went wrong with your call for a June 20/21 high?
This is not meant as a criticism. Just trying to understand how you arrive at your astro interptetation.
No one gets it right 100% of the time.
June 20-21 is a turning point so we could see a lower top here (bounce).
I went short on the AEX today.
Just thinking outside the box
I’ll assume everyone using options was positioned for a bullish week into expiry .
July 2 and July 13 are the next swing dates yet July 2 could end up as the low.
I have no big opinions on this market yet so far the set up is leaning towards
A further bearish bias going forward . My comments prior still stand though.
A down week this week points to a sideways move for the following 4 weeks
Yet all suprises should be to the downside . It’s just a general sense of how this
Pattern generally plays out is all.
As a general rule during an option expiration week what ever the market does
On Thursday expect the opposite on Friday . I personally hate option expiration weeks
Because things get skewed as positions get unwound. It won’t change the wave count
But it may cause a bit of confusion . Next week is probably going to be flat to up yet that’s
Not a trade I’m interested in taking .
Nice to see the market moving lower
I have no idea what this freakish market is doing.
Looks like some kind of rising wedge B wave just completed. I am taking the money an running on DIA 250 puts and 248 short calls. Still holding long DIA 250 calls in anticipation of furious relief rally.
Back to the chart show on Wednesday for the inside scoop…! 😉
Equinox is on Thursday. Would not be surprised to see SPX run to 2810, then crash hard. SPY 279 lottos at .09 for S&G…
Thanks Mike. /ES has formed a big albeit red for now daily hammer. So today may be a swing low to your equinox.
Sold spy long calls. Just an intra-day trade. Don’t want to hold overnight just in case tomorrow is just a chop-chop day.
Yep. That’s exactky what I expect.
Looks like relief rally has arrived. Index futures flying bullish pennants so it will be interesting to see how high they ramp it. I will be expecting an outside reversal day soon, if not today, then likely tomorrow. IWM overdue for a retreat with steep momentum divergences everywhere. It seems tough to see an ED with the higher recent move with loss of 1,3 trendline slope…
Hi Peter thanks for explaining the markets.
I have updated my indicators. And today we will make the High I think. But the indicator 2a demands a High a day before declining into 26/27 june. So it can be tomorrow. There are 2 indicators for end 20th and begin 21th. The turn indicator gives 21th but that can start a day before. http://www.prognoseus500.nl/
Later Willem
In the Chart Show today, I’m going to show you the most probable path for ES/SPX over the next couple of weeks. The same for USDJPY.
NewDania (charting software) is holding a free half hour webinar on June 26 on the basics of Elliottwave. I can’t speak to the value, but if you’re missing the basics, this might be a great start! https://webinars.netdania.com/Home/Webinar/288
Just see the global indicator confirm the decline http://www.prognoseus500.nl/
Peter thanks for the examples to learn E W. After a few hours I made the conclusion not to do it. I think You and the members can give me the Theory and results of E W and I give You and the rest the results of my 5 (til 9) indicators. The time I spend is about 20 hours a week and I also work 40 hours. So there is no more room for extra. In about 3-4 Years the “Old One” is having his pension.
Later Willem
It takes a long time to learn EW properly and it’s expensive to test it … lol.
The equinox high for those bullish into the 21st is done. Would like to see indices waterfall into the close instead of this daily gap downs & recover mid-day.
PPT should give bears a bone. Give them a Black Friday or Black Monday.
Hi Liz,
A black Friday or Monday — I never have seen this with the actual indicators — BUT they indicate a hughe decline on Monday! So a black Monday is possible. Be carefull Willem
sorry i forgot the link http://www.prognoseus500.nl/
A new weekend free blog post is live at: https://worldcyclesinstitute.com/usd-the-penultimate-turn/
Commercials have covered half their short positions in E mini futures on the recent decline. Indicators calling for a huge decline on Monday are probably going to loose money for traders following that script.
Do folk using forecasting methods pay any attention to the COT reports? Just curious.
This website is for educational purposes relating to Elliott Wave, natural cycles, and the Quantum Revolution (Great Awakening). I welcome questions or comments about any of these subjects. Due to a heavy schedule, I may not have the time to answer questions that relate to my area of expertise.
I reserve the right to remove any comment that is deemed negative, is unhelpful, or off-topic. Such comments may be removed.
Want to comment? You need to be logged in to comment. You can register here.