
 Exactly, kitty! Let’s take a look under to hood … er, sofa in your case.
This weekend, I want to look at the chart of ES (e-mini SP500 futures) and “pull apart” the idea that it’s a motive wave. To do that, we need to look “under the fabric.”
The “Right Look”
Ralph Elliott cautioned that motive waves must have the “right look.” To a novice, it may take quite some time to be able to discern motive waves from corrective waves , even if I do a really good jog of explaining the difference. It takes time and a familiarity with the concept to be able to immediately see the difference. Motive waves must follow a strict set of rules and any deviation from this pre-designated pattern, makes the wave in question “corrective.”
Not all of us have the inherent ability to recognize patterns. I don’t know how much of this is a learned ability percentage-wise; however, you can certainly enhance your pattern recognition skills, as highlighted in Malcolm Gladwell’s book, Outliers. All it takes is 10,000 hours!
Anders Ericsson, highlighted in that book, studied violinists at the Berlin Academy of Music in the 1990s. He found that experts became experts based on the amount of work they did. “People at the very top of their game don’t just work much harder than everyone else. They work much, much harder.” You can learn to recognize patterns in the market, but it takes time. In other words, “cognitive repetition.” You need to work hard to get really, really good at it.
So think of this as a “starter exercise.”
Motive vs. Corrective
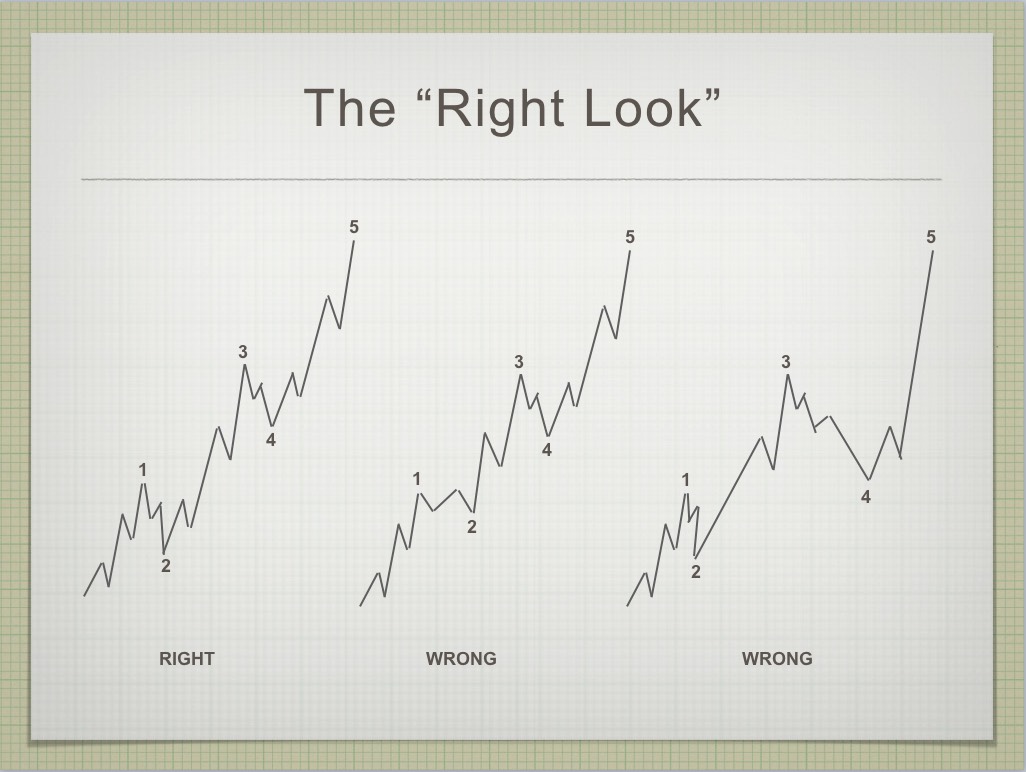
On the left is a series of three drawings (click to expand) of what might be construed as a bullish motive wave. The one of the left is the motive wave; the other two are “pretenders.” Motive (impulsive) waves are waves that are trend waves, defined by the number of waves and their relationship to each other. There are very strict rules that they must adhere to in order to be classified as motive. If they break any of these rules, they are “corrective.”
The most important motive wave rules (from Prechter’s book, The Elliott Wave Principle):
- An impulse always subdivides into five waves.
- Wave 1 always subdivides into an impulse (5 waves).
- Wave 3 always subdivides into an impulse (5 waves).
- Wave 5 always subdivides into an impulse or a diagonal triangle.
- Wave 3 is never the shortest wave.
- Wave 4 never moves into the area of wave 1.
Motive waves have to follow the above rules, or they are unquestionably corrective.
I find the above set of rules inadequate, in that they don’t address fibonacci ratios. In my experience, adhering to these ratios is often the deciding factor in whether a wave is motive or not (other than having the “right look”). I would add these very important rules:
- Subwave 2 almost always retraces at least 62% of wave 1,
- Subwave 4 almost always retraces at least 38% of the distance from the beginning of wave 1 to the end of wave 3.
- Subwave 3 is almost always either 1.618 or 2.618 (extended subwave) times the length of subwave 1.
- Subwave 5 is almost always 1.618 times the length of subwave 1.
If the subwaves do not meet these criteria, they are most likely corrective waves in my extensive experience (much more than 10,ooo hours).
They must also have the “right look.” Let’s break down the attributes of the three waves in the diagram above:
Leftmost. This is the motive (impulsive) wave. It adheres to all the rules and has the “right look.” You can see the subwaves in each of the odd-numbered waves. The even numbered waves each have three subwaves.
Center. There are two problems with this wave structure. The second wave does not retrace anywhere near the required amount (62%—see my additional rules above) and the third wave does not have 5 adequate subwaves, as a result.
Rightmost. Both the third wave and the fifth wave only have three waves each. As important, the fourth wave is not in the correct proportion to the second wave. It is much larger, in fact, even “overbearing” when contrasted with the second wave. If either the second or fourth wave out of proportion so that one is much bigger than the other, the larger wave structure is usually labelled as an ABC wave (corrective).
Breaking Apart the Chart
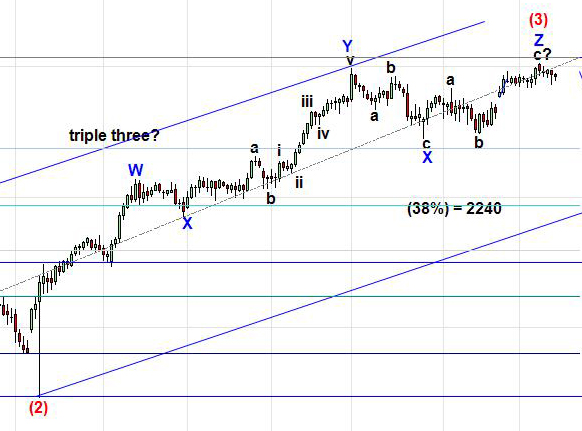
Let’s look at the third wave of the C wave from the daily chart of ES (below). You can see it on the left (click to expand).
You should be able to make out 3 subsections of the wave on the left. Wave W is actually a zigzag. So is wave Y and wave Z. There is no adequate subwave 2.
So, this wave breaks a very important requirement of a motive wave (no adequate second wave). It is therefore corrective.
Now, think of subwave W as 1, Y as 3, and Z as subwave 5 (of the larger wave 3). Subwave Y is about 180% of the length of subwave W. Subwave Z is about 40% of the length of subwave 1 (it should be 1.618 times the length of subwave 1). These subwaves don’t come close to what we’d expect the dimensions of these subwaves to be, if it was a motive wave.
Subwave 5 (Z) is very clearly in 3 waves. There’s another hard rule that this wave breaks.
Therefore, there’s no question that this entire wave is corrective. Once one wave of a structure is corrective, the entire structure is corrective.
This is an example of how you can look at a wave structure critically to determine whether it’s motive, or not. There are many more examples in the entire pattern from February 11, 2016 that point to this being a corrective wave. I’ve chosen one of the more obvious examples.
What this means is that we have a very fragile market before us that’s being pulled along by other forces. It suggests the fifth wave will not be as long as many might expect and that we may end up with an ending diagonal as the final pattern.
It also suggests that once we get to the top, the wave down will fast and steep.
Good trading.
Couldn’t be happier … KK 2
Couldn’t be happier …The analysis and insight you provide is simply amazing! I’ve been trading the futures and equity markets for well over thirty years and usually average around 5% monthly. Since joining your Traders Gold Service two months ago, that number has better than doubled. I couldn’t be happier.—KK |
Get an upper hand … JC 2
Get an upper hand in trading …Seeing all the different currency pairs and the wave structures and hearing you explain why this has to do that on a nightly bases gives one a upper hand when trading. Elliott Wave applies to all stock and indices and can be applied to any candlestick chart. If someone ask what you want for Christmas – Tell them a membership to Peter’s “Traders Gold!”—JC |
Tops in your field DZ 2
Tops in your field …You are tops in your field. Tried to follow Elliot Wave international for years. They were always behind the market. After discovering you, I perceive that you are an expert in reading the waves, which puts you way ahead of the rest of your peers. And you can read the Waves like you are reading tomorrow’s financial section. I pray you stay healthy. —DZ |
the real deal SM 2
The real deal …‘Educational, insightful and thorough market analysis for all levels of traders. It’s Elliott Wave at its best….Peter Temple is the real deal’ —SM |
The best of them JL 2
The best of them …Last couple of years, I subscribed to several ‘market traders’. You are by far the best of them and the personal contact is awesome. Daily and daily updates are very well written! Besides your expertise in EW, I also like your cycles analysis. Best investment I ever made! —JL |
Have not had a losing week RW 2
Have not had a losing week …I have been with Peter almost a year. The only thing that matters is have I made money with his service. I think I have finally turned the corner using Peter’s EW. I have not had a losing week in the last 5 months. Thanks Peter, for your amazing amount of hard work. —RW |
A true expert in Elliott Wave FL 2
A true expert in Elliott Wave …You are a true expert in EW analysis. What you provide is not available anywhere and is priceless. Subscription on your services is the best thing I have ever done. Many thanks for your effort to make me a better investor. I now have more trust in my investment decisions. I hope you will continue the excellent work! —FL |
Rise above the rest … SM 2
Rise above the rest …I have only ever met a few people who, in their chosen fields (astrology, medicine, music, martial arts, technical analysis), rise above all the rest and you are one of them…you have ‘the gift’…and that’s why I’m a Trader’s Gold member. —SM |
The Market This Week
The charts this week have added even more clarity to the path ahead. The time I spent last weekend (a full day) analyzing the market has paid off. We've continued to follow my projections all across the board (US indices, USD currency pairs, the US dollar, oil, silver, gold, and bonds).
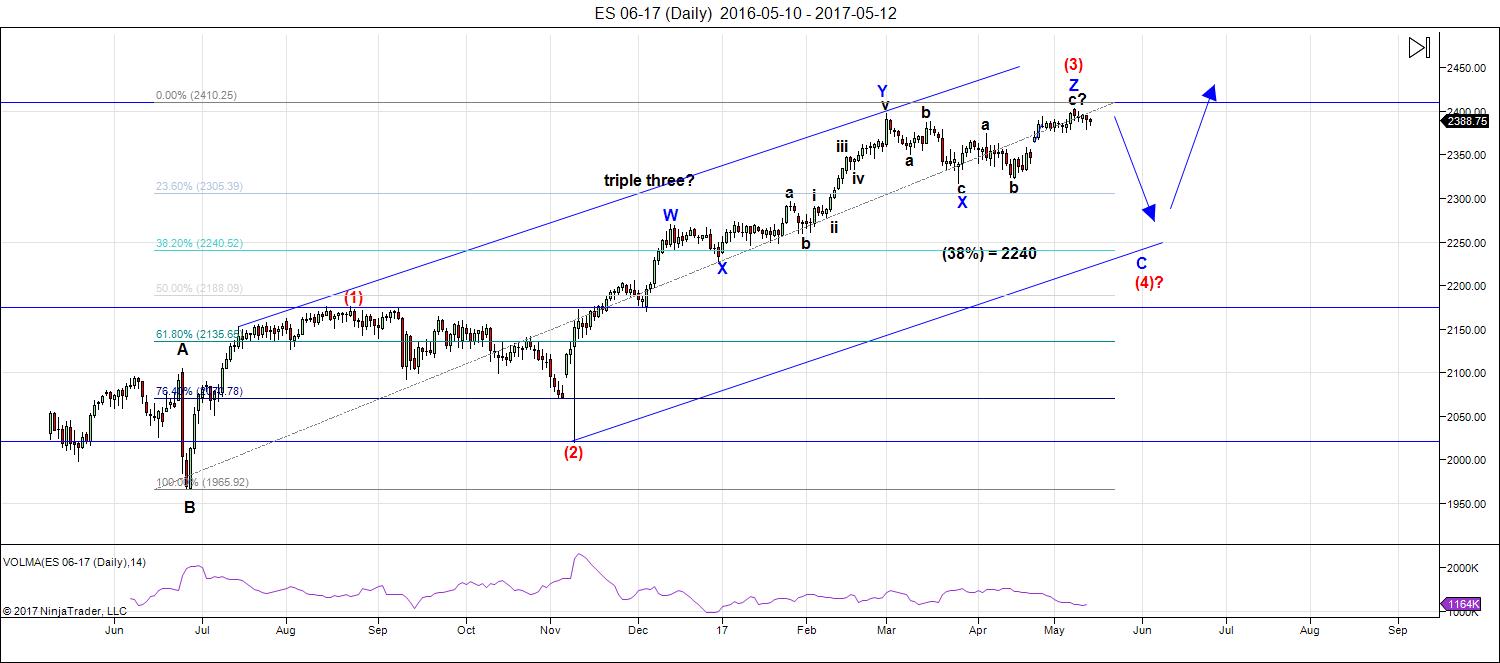
Above is the daily chart of ES (click to enlarge, as with any of my charts). We sit very near the top of the third wave of a large C wave. As per the information I shared above, this wave up is clearly corrective, although you'll find charts all over the internet calling the entire structure motive. This is the kind of misuse of Elliott wave that drives me crazy (and why I stay away from reading other people's charts).
This is important because it gives a different count than a motive wave would produce and it suggests a different length to the final fifth wave. It will likely be shorter than a motive wave and has a much greater probability of being an ending diagonal.
We have a dramatic turn coming later this week, as it will play out across US indices, most USD currency pairs, and perhaps oil and the major metals. As I've saying for the past year and a half, all markets are becoming more and more closely aligned. Now we have situations where they're all making turns at the same time.
For my Trader's Gold group, I've laid out the remaining long and short term path for all the assets I cover. I still project a top for everything in the September/October timeframe, because recent history has provided many of the clues in each of the asset classed. They're all telling me the same thing.
Last weekend, my hours spent on charts paid off. As projected, virtually everything headed for a new high. Although we haven't gone very far in the past week, the charts have become much clearer. Haha ... by that I mean clearer to an Elliott wave analyst; they're actually way more cluttered on an hourly timeframe to the newbie, but that's because we're experiencing the added volatility of many markets making a turn at the same time.
Summary: We're in the final pattern of a third wave in ES.
The top end projection for this final zigzag of the third wave is 2410-2415 in ES.
After completing the larger fourth wave, we'll have one more wave to go, which could be an ending diagonal as a fifth wave. The long awaited bear market is getting closer.
______________________________________
Sign up for: The Chart Show
Wednesday, May 17 at 1:00 pm EST (US market time)

The Chart Show is a one hour webinar in which Peter Temple provides the Elliott Wave analysis in real time for the US market, gold, silver, oil, major USD currency pairs, and more. You won't find a more accurate or comprehensive market prediction anywhere for this price.
Get caught up on the market from an Elliott Wave perspective. You’ll also get Andy Pancholi cycle turn dates for the balance of the current month. There’ll be a Q&A session during and at the end of the webinar and the possibility (depending on time) of taking requests.
All registrants will receive the video playback of the webinar, so even if you miss it, you’ll be sent the full video replay within about an hour of its conclusion. For more information and to sign up, click here. NOTE: the weekday and time have changed - to Wednesdays.


Thanks for the great analysis and your time. It is definitely opposite of what most are calling for.
It seems you are adamant about reaching 2410. Is it possible that we head down from
here in in your 4th wave?
Hi Peter, good job explaining EW. Thanks! Still bullish this year (with a possible bear trap in mid summer) due to Rooster year and Trump effect (a more likely time for sell off would be next year a mid term election year).
Hi Peter
Just a couple observations i noticed back in 2007 into april 2009.
I plot a cumulative zero sun spot days chart( its a separate project ),
Back then i noticed that as the market began to sell off we had more
and more back to back zero sunspot days and as the market began to turn
back up in 2009 coincidentally so did the sun spot cycle .
the sun spot cycle has its merits on an annual basis with the united states GDP
numbers .
The past 4 days have been zero sunspot days .
The correlation to the Dalton minimum changed slightly for the month of april
yet if this correlation continues i would not expect much of an increase in solar
activity until July or august . This cycle would peak in October if it continues
to correlate . Nothing is ever exact . I find it interesting that the sunspot cycle
peaked back in april 2014 ( the 90 day average ) and that coincidentally correlated with the price of oil . as the sun spot cycle collapsed oil fell hard with it . Down here on the Oregon coast . Prior to the peak in 2014 we had some very nice weather which would begin somewhere in the march time frame , Rains were from say Feb March and then nicer weather into October .
In November 2015 a change in the weather showed up down here and it rained
hard from November 2015 to April 2016 before we got any significant break.
a similar pattern from Nov 2016 Yet other then a few days break we are still seeing significant rainfall and to date ( in 2017 ) we have now received More rainfall than the entire previous year. Obviously this has nothing to do with trading yet ill add a few other things . I have asked many people who have grown up here and i talked with a guy just the other day who said he has lived here since 1977. They all say the same thing . They cannot remember any year to year
big snow falls . A couple times there was some snow yet overall pretty much
down in this area snow is a rare thing.
You have explained the cooling cycle and the rainy weather and this area
fits your descriptions very very well. What i will find very interesting is if we
see some significant snow falls next year which would for me be a clue that
this correlation with the maunder minimum is the correct correlation .
To take this one step further i am beginning to form a theory .
I could relate it to andre’s thoughts on vibrations or i could compare it to
dropping a marble into a bath tub and i could relate it to Elliott wave theory .
We don’t leap back in time what we do is take baby steps , what goes forward
in once cycle retraces that cycle when the change occurs. Just as in Elliott wave
theory we see the market retrace back to the 4th wave of one lessor degree
before going back to the previous 4th wave of the 3rd wave . all cycles retrace
in a similar fashion . If this holds true then the cooling spell we are only beginning
would make sense that it is going to be similar to the Dalton minimum .
and the following cycle which id expect to happen way past im gone would be
similar to the maunder minimum .
these 2 cycles were for those not aware
Maunder minimum 1645 to 1715 roughly
Dalton minimum 1790 to 1830 roughly .
To keep it simple they were about 150 years apart ( just keeping it simple )
Right now the correlation places us in December 1807 .
The year of no summer was the year 1816
8 years from now would be the year 2025-2026 and i have no opinion
about this from a trading perspective i am just pointing it out .
What i can see in front of me down here is the rainy seasons are beginning to
have a tropical feel to them ( warm and wet )
i have also been able to plot the sun spot cycle from an Elliot wave perspective which i find amazing .
To sum it up : We go forwards in baby steps and we retrace each of those same baby steps as we regress .The stock market does not really rise to new heights
they merely change the names of the components. gravity sill prevails and pulls things back. Everything oscillates up and down . This is best seen in long term commodity charts . Obviously it really comes down to purchasing power of the local currency .
For anyone who has ever dealt with extreme debt or any financial issue where
you suddenly found yourself responsible for say , divorce , child support debt or even a law suit . you find yourself trying to dig your way out of it and the harder you try to get ahead the more difficult it becomes and at some point you
just accept the inevitable . Its like when a dam breaks and you pile up the sand bags yet the water level keeps rising . When that temporary wall breaks
you get the inevitable flood .
All that is going on today is we are piling up sand bags and we are regressing slowly backwards .
corporations can buy back their stock ( sand bags ) the fed can lower interest rates ( sand bags ) central banks can hedge themselves from interest rate risk by buying stocks ( sand bags ) more money can come back to the united states by changes in tax policy ( sand bags ) foreign money can flow to the united states
( sand bags ) all of this is is happening and the water level continues to rise .
what i found interesting back in 2004 was home mortgages were based on the libor and not the 10 yr treasury and today though more and more debt is being priced in us dollars .
as the dollar rises that debt will become more and more expensive ( the debt level is the flood and the water level )
Right now it still points to money flows into the united states yet when the dam breaks all hell will break loose. !
Thanks for your post on Elliott wave theory . i find that it applies to just about everything on the planet and your correct everything is moving in tandem
Joe
good site for sunspot data
http://www.solen.info/solar/
First snow this time of year in 50 years in Norway. Robert Felix of IceAgeNow.com thinks we are entering a cyclical hundred year cooling cycle.
Peter G,
Going back to your 5391-5395 day cycle…If that ends up “showing the way” that implies that we are those 5391 days away from a an important low. Significant implications for all market participants.
Your point that a large number of Elliotticians are indeed looking for the 4-5 to finish the impulse that they see. The best Elliott Wave trader (Peter T excluded) that I ever knew was Dominick Mazza…He always said that “If everyone has one particular EW Count then it is Wrong!” I cannot get that out of my mind.
It sounds like to me that you are a “cycles guy”! Do you have something that you can share that you are looking for that would indicate you are on the “right path or the wrong path”?
Andre’ that posts here seems to be looking for a high as soon as Monday…that could last for a long long time! Not trying to step on any toes. Just seeking other perspectives!
As Verne said recently…If you do not see this market continuing “on and on” like the people that drive the financial media (think..CNBC) you and your views are scoffed at. I personally have never seen the massive extreme of people who actually attack your views if you even insinuate that this market could be finished!
For no other reason…the extreme levels of bullishness makes me “look the other way”! Kind of like crossing the street…Be sure and look both ways. I have no idea how this will turn out but like your friend said, “We will know in the fullness of time”!
Ed, it would be improper to assume that if this pattern does resolve in an important high that the next resolution would necessarily be a low…or that there would be no important low until then. One of the tools I use looks for patterns of equally spaced turns. If they end up being important turns, I pay more attention to them. This one has fallen on some historically important turns. The April 1958 low was never again visited on the S&P Composite! The Jan 1973 high was not surpassed for over a seven years! The October 20, 1987 crash low was never again touched. The July 2002 S&P low was tested for one day in October of that year and then held for the next six years.
It was slightly penetrated for 2 days in November 2008 and was broken in late February through mid-March of 2009 as that historically important bottom was formed. Four historically important pivots took place an almost exactly equal number of calendar days apart. That is an unassailable observation. The rest is, of course, guess work 🙂 The last known resolution was July 24, 2002. The previous counts were between 5391 and 5395 calendar days which when counted forward from July 24, 2002 takes you to April 27, 2017 to May 1, 2017. Based on the recent history of important turns, if the pattern continues, we look for a potentially important top within that time window, not because it is scheduled to be a top, but simply because the market is toying with all-time highs…somewhat foolish to look for a bottom in that territory… and we look plus or minus a few days on either the DJIA or the S&P. The Dow hit a high on April 26 that it has not yet surpassed. In association with the B-B-T count from the 2 most important bottoms of the last century July 1932 and December 1974 scheduled to resolve around May 11, it gives us exciting reasons to be looking for the elusive final top. I must admit there are several potential pieces missing, like a more obvious negative divergence on the a-d line but anytime cyclic patterns give a potential reason for a historically important top, I remain on the lookout for one. All we do in this crazy maze of market analysis is look for possibilities and probabilities.
Thank You for your comments! Much appreciated!
Squared numbers on the 1974 low shows we are at a midpoint between 124 and 125. On 12/6/74 this gives 5/14 and on 12/9/74 5/17.
The previous midpoint was 9/8/16 and the next day was a big down.
As the low on 12/6/74 was a Friday it could be the real turndate was in the weekend. So we have to assume any date between 5/14 and 5/17 could be significant.
For other reasons I think 5/17 is a strong date. But the final high will be 5/22 and then it will all be over.
No forecast; just probabilities 😉
Peter,
if you admit that structurally all the wave up since Feb 2016 is corrective why do you expect another last 5th wave up after the correction ?
It doesn’t need the 5th wave if it is corrective.
1. All ending waves are in five waves.
2. All corrective patterns end in five waves (triangles lead to a final fifth wave).
3. All motive patterns end in five waves (5-3-5-3-5).
They always have and, I assume, they always will.
The only exception is an ending diagonal, which is an ending pattern in 5 waves but all the subwaves are in 3’s.
As I have said over an over, we’re in a zigzag. It’s a 5-3-5 pattern.
http://www.elliottwave.net/educational/basictenets/basics3.htm
Thanks, Peter.
The book names the wave corrective when “Markets move against the trend of one greater degree only with a seeming struggle.”
So, if this wave was countertrend it would be evidently corrective zig-zag.
But it is going with the trend up. Can we still call it corrective ?
The term “corrective” is more about structure than anything else. There are only two kinds of waves: motive (impulsive) and corrective.
The thing that convinced me that the third wave was incomplete was a simple glance at the 200 dma The second wave correction tagsimpit 9and so far there has not been a serious move toward. It is also interesting that it is currently just at about the 38% retracement that Peter is expecting, 2250.66
Hi Peter. Where do you see usd currency pairs going from here?
Elizabeth.
That I go over in the chart show on Wednesday.
Do you mean Wednesday last week or this coming Wednesday? How to find the chart show?
Interesting gap up open today. I expect its closure will confirm an exhaustion variety. Price needs to move below 2399.90
I want to revisit the matter of EW theory and the predictability of wave forms. Without arguing against the reliability and legitimacy of the method, I nonetheless keep trying to make the case that we are historically in uncharted waters.
We have never had global, and particularly government debt this massive, we have never had central bank conduct so criminal and so reckless. The derivatives market approaching one quadrillion says it all. EW theory is all about order and predictability.
I find it fascinating that so many think the resolution of the frightful mess we are in will be either orderly or predictable. My fear is that it will be neither. It seems to me that no one is accounting for a sudden and catastrophic failure of the system. I can easily imagine a situation where things seem normal when we go to bed at night, and wake up to futures bleeding red like we have never seen. Far fetched? Maybe. What if circuit breakers become permanant? Does anyone really think banksters are going to allow the majority of Amazon shareholders to walk away with cash 177 times earnings ?!
I have a sneaking suspicion that this time will indeed be different, but not the way most prople expect.
I am still trying to decide how best to prepare. Money in brokerage funds have no FDIC insurance.
from the 05/09 high (2403.87) SPX made an abc move down to the 05/11 low (2381.74)…from that low, SPX made a three wave move up to the today’s high (2404.05)…question re SPX price action: (1) is SPX working on wave 4 with wave 5 up to follow; (2) is SPX working on wave a of an abc move to the downside; (3) is SPX doing something else?
Based on Peter’s chart above, we should be completing a five wave C of wave three.
It would, based on your count, imply a fourth and fifth wave still needed to complete the current wave. Today’s new high so far as I can tell, gives a possible five up.
The local supermarket in my neighborhood has a gift card kiosk to purchase fractional shares of TSLA, AMZN, GLD, etc.. This could be the sign of a mania beginning in stock investing that may last into beginning of next decade.
Saturn in Sag (we go opposite Saturn in one month). Last few times Saturn in Sag, earth passing Saturn resulted in multi month mania in markets (June 1987, June 1958, June 1928).
It will be fascinating to see whether Peter’s waves or Valley’s planets make the right call.
Vedic astrology is based on lunar years. 60 years is one cycle and 120 years is a life.
For Gann 20 and 60 year cycles were major. But we kow he was in India. Did Gann simply copy vedic astrology? He says the 30 year cycle is important as it is the Saturn cycle. But Saturn doesn’t do exactly 30 years. And 30 lunar years is closer to Saturn than 30 solar years.
Every 120 lunar year life is ruled by 7 planets – including Ketu and Rahu – with different periods. The sun does 6 years, the moon 10, Mars 7 etc.
Very important is to determine where you are in the 120 year cycle when you are born as the cycle doesn’t start at birth. It is the position of the moon at birth that determines your start position.
Applying this all on NYSE we can see nyse was born in Ketu with just a little time to go there. And after Ketu comes the 20 year Vensu cycle. So the new NYSE life started 12/8/1811 and lasted until 5/13/1928. Did this contribute to the 1929 crisis?
We are now in alife that started 5/13/1928 and lasts until 10/14/2044. Within this life we are currently ruled by Mercury from 2/4/2002 until 8/5/2018.
For this Mercury period we calculate sub periods. And we are currrently in a subperiod from 12/24/15 intil 8/5/18. 12/25/15 was a 192 year cycle according to Carolan……
We divide the 2015-2018 period into 27 mansions. Now in the 14th mansion (the central mansion as 14 is the midpoint in 27) and that runs from 5/1 until 6/6. with midpoint 5/19/17.
This analysis supports the notion we are seeing some interesting days.
Musical harmony gives 5/15, 5/18, 5/22, 5/25, 5/29 and 6/1. Is this high,low,high,low etc? We’ll see. But 5/18 will be a low in Delta. So I exepect ABC down into 18 and the back up into 22 etc.
Using the 60 lunar year lookback period we get a high 5/22. Saros and Hurst cycles give the same.
Reading on Vedic astrology helps me understand Gann. Some analysts (Burton)say Gann IS vedic and the Gann year starts 4/14 with the vedic equinox. Gann Always used the word ‘years’ and and never ‘solar years’. Tunnel through the air seem to be about Sun an Moon so maybe this was Gann’s big secret.
Lunar returns gave 5/15, confirming the dasa vibration.
S&P made a high yesterday and responded to the vibration. 5/22 is the etone; should be a very significant date.
Just some background. Who knows somebody likes this.
André
While it is true SPX made a new high, I would not call the price action significant, which I would have expected based on the “strong vibration” comment about the 13. Perhaps I misunderstood what was meant by that statement.
Verne,
Long cycles need an orb of a few days. That it doesn’t work directly does not mean it will not work. Short term cycles can bring inversions but don’t last forever,
Within a few days you will understand what I said.
André, when you say 22 it’s “over”, you mean for wave III or for the market? 🙂 thx!
Alex, at least for a number of weeks. But it is possible it is the big one. There will be retraces. 8/21 9/22 and 10/2 are possible turndates. But new ATH’s are unlikely in my v.iew
Very conflicted about all this. I know we cannot make trading decisions based only on sentiment but I just have this nagging doubt in view of the virtual unanimity of expectation of a still coming “blow-off top”. While I am not saying that cannot happen, anyone who has been watching this market knows it has been behaving un-naturally for quite some time and is broken…in my view beyond repair. I think it is a dangerous place for the unwary….
Thanks, Andre’. Very informative and inspiring.
See Carolan’s analysis and tell me the market is strong.
http://spiralcalendar.com/
That’s exactly my point, look at this: https://charts.stocktwits.com/production/original_83109588.?1494788839
I mean, like H.P. Lovecraft said “That is not dead which can eternal lie, And with strange aeons even death may die” – how the heck are we here lol.
If a market with no liquidity can find its way here I don’t know what to think. It’s like if I’m at the top of the K2 and see I Peter with an old motorbike climbing to the top. He stops and tells me “You know, the funny thing is that I finished the fuel 12 years ago. Btw, I’m going to the moon now”.
Not that I believe it can go to the moon, but at this point I don’t know what to think. Last 7 days there were 14 contracts traded in ES, 2 a day, I counted them…
Wow! Traders are tired of being whip-sawed…who can blame them?
One of thing I am starting to notice about Peter’s analysis is that he generally way ahead of other analysts in spotting what the market is likely doing. Only in the last day or two have some been starting to mention the more bearish outcome of the recent price action. One analyst in particular who I think is fairly competent has a slightly different count but now sees the possibility of a very large expanded flat unfolding with a big C wave ahead into the middle of June. This also seems to line up with a few important cycle dates, and a final top in the fall.
I continue to look around the broader economic landscape (including the dearth of reporting about what is going on in the Chinese credit markets), and have to shake my head in wonder at all the folk talking about an extended bullish run for these broken markets. I am still seriously considering moving most of my funds out of my brokerage accounts before the end of the year. As great as it would be to trade the coming melt-down, what good with it do if your broker goes belly-up during the process?
Does anyone know what happens to a broker whose clients are unable to meet margin calls? Are they on the hook for the short-fall? Margin debt is again at stratospheric levels as no one expects the party to end anytime soon it seems…
I guess we’ll know soon Verne. The smaller ones will simply bankrupt, already happened some months ago with all the currency sambas…
I know a few of them folded when the Swiss pulled that fast one and unexpectedly uncoupled from the Euro. People have apparently forgotten what that kind of exogenous shock can do to markets.
…and that’s another ATH folks…
2401 = 49 squared. Very strong resistance. Little overthrow and down again. This was noise, not a sign of a healthy market.
Down into Thursday.
I agree. The torturous advance has been going on for quite some time, though of late I agree it has become more labored. I guess quite a few of us are wondering how long can this possibly go on??!!
Alex mention the absence of liquidity but the low and declining volume in the market has been going on for years now…
Yep. The banksters for many months now have successfully arrested every single attempted market decline, regardless of what we thought the wave count called for. If we are indeed about to get a C wave down it should go past the start of wave A to avoid a truncation. Based on their past intervention, the banksters are going to fight tooth and claw to prevent more that a one percent or so decline. So, I guess it is EW theory vs the banksters! Who will win this round?! 🙂
The END of wave A is what I meant…
Simple technical observation…Downtrend line from April 26 high on DJIA through May 9 high comes in today at exactly 21,033.53. Today’s high was 21,033.49…pretty remarkable, these random walks, aren’t they 🙂 To add to the veracity of the line, start it at the March 1 high with the 2nd anchor on the April 26 high. The lines should virtually overlay each other. Short term outlook, at the least, is bearish until that line is overcome…
Yep. That line bears watching since until it is breach the ATH divergence with SPX and NDX continues. That divergence is bearish imho…
Sold put, bought call Tuesday. Lunar tuner suggests higher prices next 10 days. (declination post south, pre perigee, pre new moon; however, seasonals weak next 5 trading days).
Well, once again developing downside momentum seems to just fizzle, sputter, and ultimately just fade away. Why am I surprised….
Was wrong to buy call. Will sell it tomorrow. The news today and Fed likely raising rates in June may take quite a few percent from market next few weeks.
It seems to me that put, if it was a naked sale, represents the greater risk. I thought you quite brave when you said you had sold it.
Sold put, translation: sold the put that I had purchased previously. I am not wired to sell puts or calls, only buying them. =)
Very strange goings on the markets. As happened yesterday, all market movement goes eerily silent the last 45 minutes of the session, as if stuck in some kind of time suspension zone…weird, to say the least…
Andre’
I read with interest your post above regarding Vedic Dasa for NYSE. I have been using a birth time of May 17, (hum…) 1792 at 7:56 am in NY, NY. But I have this Ketu start then as April 13, 1795, not the a Ketu start of 12/8/1811. I want to make sure I didn’t screw something up, any thoughts? Thanks,
Steve
Steve.
I took 10:00 AM as birthtime but that doesn’t change much. Be sure to include one more Venus cycle after ketu as Venus concludes the life. This weekend I’ll give you all the details of my calculation so you can check. I should add I use lunar degrees and not days. I can tell you that on longer periods this makes a hell of a difference. A metonic year is not 354 days; it is 12 times 360 degrees. Big difference.
Hi Andre:
I am curious about whether your analysis gives any insight about the depth of the initial anticipated decline we think imminent. Some EW counts see either a C wave down of a large expanded flat or a C wave of a large triangle. The triangle is not expected to make a new low, the flat is expected to and actually approaches closer to Peter’s target around 2240. While I suspect a deeper initial decline than I think most people are expecting, the relentless intervention of CBs have effectively forestalled serious corrections in the markets for quite some time so I think for that reason the triangle is also a very real possibility as it would essentially protract the sideways price action with a subsequent D and E wave. The 38% re-tracement Peter is projecting just about takes price to the 200 dma around 2254. I think how price behaves there will tell us a lot about what is unfolding. If price slices right through that boundary and it then acts as resistance going forward…it would be significant, I think, for the market’s future.
Verbe,
My work is on timing. So I will let Peter guide us on how deep we will go. I know enough of EW that 85% is certainly possible. And if the longer term cycle are right we are not retracing and we could break the 2009 low. All depends on the long term outlook.
Andre’,
All Hail the Vibration!!!
🙂
https://astrologyforganntraders.wordpress.com/2017/05/17/beware-who-you-trust/
“Beware Who you Trust” – Olga Morales, May 17, 2017
“Week Ending 19th May 2017…S&P 500 together with a whole series of global markets are going to change trend” – Andy Pancholi
http://tinyurl.com/ksoewjm
Verne,
Please let me know where you obtained that information.
Peter; I subscribe to quite a few newsletters including Gann Global Financial and Dr McHugh’s trading newsletter and they both also subscribe to Andy’s Market Timing Report. You must be aware, I trust, that he is widely read by many other analysts. Relax! 🙂
I will not “relax.” This is proprietary information. It is disseminated on this site. We have had this discussion before (this is the second warning). If you do not have prior approval from Andy to widely disperse this information, then it is stolen. I have no patience for the display of stolen information, I don’t care where it comes from. If this happens again, you will be disbarred. There will be no discussion.
I consider it extremely disrespectful to both Andy and me.
There, I’m relaxed.
Thank you.
Well, the banksters have turned on the printing presses and are steadily trying to buy futures out of the red. What happens today will be critical. I have come to the conclusion that financial criminal cartel has decided that serious market declines must be avoided at all costs as they run the risk of loosing control. What that meant to me personally is when we see markets declining in defiance of their best efforts to stem the tide, that they are loosing the battle. I think the next key level is SPX 2380.00 A break there soon after the open would be quite bearish.
“Squared numbers on the 1974 low shows we are at a midpoint between 124 and 125. On 12/6/74 this gives 5/14 and on 12/9/74 5/17.”
This is what I showed you; 5/14 – 5/17 vulnerable. Guess somebody read my post. S&P -0,7%.
Also said 5/18 is a low and 5/22 will be tested. So I think I agree with Andy. The week ending 19 really sounds like 22.
Cheers,
André
Now that the market has given us 5/16 we can see the 1974 low was 12/8. Said above that the low must have been between 12/6 and 12/9. The squared number count back gives us 12/8. The range timing now gives 5/9. Add a 7 day vibration (Garret) and we get 5/16. Quod errat demonstrandum!
But this is serious. You could imagine that 125-squared will be significant as it is 5 times 5-squared. This gives us 9/18/17. Remember lilith will be 120 degrees on the node 9/22. This makes 9/18-9/22 a very important period.
One step further. From chaos theory we know that feedback causes chaos. As we see serial correlation in the stockmarket (=feedback) the stockmarket is a chaotic (=dynamic, non lineair) system. We also know Feigenbaum’s constant gives the rithm in chaos. On S&P this rithm gave a strong 5/17, I said Monday would be a significant high, but now we see why the market stalled and only turned 5/16 overnight; 5/17 was a magnet. This weekend I’ll show you the next Feigenbaum return. We need to understand this constant universal and not man made; it is as fundamental as music so there must be a connection. More work.
The next bifurcation date is 5/23. This gives me confidence my 22 is solid.
The midpoint between 5/17 and 5/23 is 5/20. Let’s see what that will do.
for a host of reasons, have decided to post something previously shared privately with a number of posters/readers of this blog…may have discovered a critically important map for the ongoing bull market…the key will be a tradable low in the May 26-June 1 time frame…if we get a tradable low in that time frame followed by an interim high on June 8 (UK General Election & ECB Governing Council Meeting)…stay tuned!
https://worldcyclesinstitute.com/elliott-waves-pure-gold/#comment-17992
This will be my last post on the forum and I want the others here to know why. Peter has taken extreme exception to my talking about Andy’s turn dates even though that information is obtained by me by way of services I pay for. He threatened to remove me from the site and accused me of “stealing” that information for mentioning it without his or Andy’s permission so I choose to spend my time elsewhere. I still believe in the concept of fair use and the first amendment. All the best!
Hopefully you will get to read this. But you may not.
Let me be very clear. I have a license to provide that information from Andy in only one place. I do not have a license to disseminate it freely on this site. By you doing so 1) puts my license in jeopardy and 2) reduces my ability to support myself through charging for information I pay for and 3) shows a complete disrespect for the time I spend on this site providing the information that I do.
Peter,
it seems to me that Andy gives this date free in his promotion video here
http://markettimingreport.com/january-2017-upcoming-cycles/
No he doesn’t (that I could find) and that was my point. He talks about the week of the 19th.
Well,
he’s talking about the week ending the 19th of May 2017 that the market will change the trend and he is drawing the number 19 on the screen.
So, me personally I’ve perceived only the 19th of May 2017 like the turn date.
Great blog! Thanks, Peter. By the way, are references to free sites such as
“ThePlanetsToday.com”, “Solarham.com”, “TimePriceResearch.com” be made or is this inappropriate?
Absolutely. What I have an issue with is what I explained in the last comment. It pertains to Andy’s dates, which I have a license for. I would appreciate it if you wouldn’t spread information that you may have purchased which is for your own use, because that’s unfair to whoever produced it, but I have no way of knowing the source or your relationship with those people. That’s an honour system thing and your own business.
But the information that I create or have license for, for someone to have access to it and then publish it free on my blog site. Not to do that is just common sense. It will make me angry for the reasons I stated, because it undermines my business. I think I already give enough away for free. 🙂
I see. Free is free. Purchased info. isn’t.
That’s a nice, simple summary … lol.
I’m afraid as a television producer and ad agency exec. (and creator), I’ve spent about 45 years fighting copyright infringement, so I’m just a little bit sensitive to that area of business.
I think all the information is free. Just the source should be cited. Especially if it is not used in commercial purpose.
Andre
I still have June 30 as a high following a may 18-25th low
Yet Sept 18 is in my screen as a low if sorts .
Verne
You explained it well
When the big turn down comes it will be as if a light switch just flipped
And as to where do you put your money ?
I have been asking that question for well over 2 years .
People say go to cash yet they assume financial institutions will survive .
Some of what I have done is accumulate tools which as a whole don’t amount
To very much money yet if things get bad I’ll be able to barter my work for someone else’s .
Or trade in some fashion . It’s kind of a back door retirement set up where I can work for myself
If I have to .as you think it through I think you will realize there won’t be any safe place to be unless you
Have something physical . You can’t eat gold or silver or bullets .
The choices are slim and in some cases I think it’s about accepting some loss vs a complete loss .
If we end up with a cashless system you could take delivery of stock shares or corporate bonds .
You would only do that to keep something of value knowing it may drop but it’s not going to be zero
If the bank goes under your cash could be gone .having cash at home works if we don’t go to a cashless system.
Some gold or silver .the biggy would be having lots of dry food if things really go to hell.
Maybe even fire wood would be a good idea going into the winters .
Thinking outside the box is what I’m getting at .
What I wouldn’t do though is get to carried away assuming.the world will end .
We will all survive this
At the end of the day money is an illusion and we can live without it .
Colder weather will create crop shortages and should bring price rises if not spikes
If the grains . There will always be a market to trade up or down
March 27 th we began a Venus bull market
Jan 20 we began the bullish side of the mars Uranus cycle .
Mercury went retrograde April 9 and 10 days later on April 19
This market turned up . Mercury went direct may 3rd and
10 days later was may 13 . So that cycle has now ended
May 18-25th by my work should be a low yet from that date
I’m expecting a stronger move up into June 30 th.
The failure to decline much makes me think June 30
Is a magnet pulling the market up ..
I’ve made my case for an Oct high yet I can’t rule out
A year end closing price at higher prices then we are today .
The mars Uranus cycles turns down June 12 2018
The Venus bear markets start falls into the Oct – year end time frame
I’ll need to look up the exact date .
My point is I don’t see this as banksters manipulating the market
The first thing I do when I’m actually trading is I turn off the tv and only
Watch the market .
With everyone bearish and trying to catch the top , all they are doing is short covering
And driving the market higher .
NVDA has gone up how big of a % in the past few trading days ???:?:
To call this market weak ?
I guess it depends on where your looking
Joe, you appear well versed in the astros. Has your analysis ever touched on the Neptune and Mars ‘square’ aspects (Geo). Appears these aspects offer strong change of trend bias in SPY. See Neptune & Mars squaring in play right now. Was interested in your view.
Thanks & Cheers
Wayne
Peter G,
Do you place any time limit on the resolution of the cycles you mentioned earlier this week? You mentioned 2 that I made note of…the 5391-5395 that projected
April 26-May 1 as a topping area…and then the B-B-T using July 1932 and November 1974 projecting a potential top on May 11th.
How much time do you allow for this to manifest itself in price action? In other words, is there a point where you say, “this just isn’t working.” The fact that the SPX 2400 level seems formidable…Does that enter the picture?
Ed, the combination of those two “cycles,” (I prefer to call them time patterns, especially the B-B-T of 1932-1974-2017 because there is only one previous time sequence before the tentative resolution of the second), should be providing important impetus for a top of significance. It is important to observe that the shorter of the two formations, the 5391-5395 calendar days is, nonetheless, a relatively long pattern and even an error of two weeks in resolution would be less than 1/3% from exact. In the case of the 1932-1974 B-B-T formation, a two week differential would be less than 1/10 % “miss.” Price levels are not considered inasmuch as these are strictly time-based calculations. Using these two patterns alone, one can make a strong argument it is “all over” but, as noted in an earlier post, the fact that all recent highs have been confirmed by the NYSE daily A-D line is a very strong argument against that thesis. That was brought home again on Monday of this week as that indicator moved to yet another all-time high, confirming the ATH on the S&P 500 on that day.Unfortunately, we would have to argue that “this time is different,” and that tends to be a losing argument in the stock market.There are time reasons to believe this is a final top, but technical reasons that would argue not. That’s the best we can do…
Peter G,
Thank You!
Yes the energy stream did foresee that big drop this morning
https://s15.postimg.org/hbulwcg6z/May_15_to_19_energy_stream.gif
This drop has nothing to do with Trump or a memo or the Russians. The energy streams affect human behavior and people acting out accordingly. Low and high air pressure also affect many people and how they feel. Many of us just don’t realize how certain external stressors affect our trading behavior. The media just blames it all on Trump? What a joke the lame stream media are.
Tom so low today up tomorrow. Then down and up friday. Yhats what i see. Is it cirrect
Tom,
it would be great to publish it before.
So the chart forcasts down tonight but strong up tomorrow morning ?
Tom, how do you distinguish today from the big waterfall apparently also predicted for last Friday, the 12th (at least it looks like the 12th on the chart, although not labeled)?
The long term (27 day) chart I’ve posted; on this board, is a computer generated “predictive” model. The chart I posted today is a short term “real time” data chart. The waterfall drop today is not connected to the waterfall drop on the 12th. I removed the dates to eliminate confusion because the realtime chart today is timeshifted by 2 days.
Thanks Tom,
I like that update very clear so if you can post
“short term “real time” data charts in between”
I also expected a turn on the 17th my next turn date is this Sunday after that down again into may 25.I hope you have a stream that fits this profile?
Thanks
John.
Hi All,
I have been tracking my 17.6 week cycle for a number of years. The date for the turn was 25th May 2017 as per the link below, but I think we got the turn yesterday with the new highs in Ftse, Dax, Nasdaq and S&P500.
http://www.17yearstockmarketcycle.com/2016/09/176-week-stock-market-cycle-update-low.html
ATB,
Kerry
Kerry maybe the turn date is this week closer to the 25th May. Do you expect a sharp fall now?
Not an immediate sharp fall necessarily, but a low towards end of June or September
Ah ok so we could get a very shallow decline of say 3-4% or a possibly larger one. I don’t think we will get a big drop as corrections have been outlawed by the market makers.
Record snowfall in New Hampshire last few days. In May? Cooling cycle.
Finally! Kaboom! Well it’s a start anyways ?
Wayne
Each year I.plot several planatary pairs and I do have mars and Neptune in it
What I do is I go back in history and look at the various conjunctions and oppositions primarily
And look for consistency with the markets ( Dow mostly )
At the moment I can’t say anything about mars Neptune square because I have been to busy
This year and have not completely updated all of my planet info
The ones I have updated I did so because I have found high correlations. I intend to have
The rest completed over the next month .
Peter
Thank you for the time you put into this site
Also thank you for allowing us all a vehicle to communicate
The time energy and thought process you go through is very
Much appreciated .
I find today’s dump in the stock market very interesting
Now . The may 18-25th time Frame for a low still has Merritt
The 20 day occilator on the Dow is still oversold . The 10 day trin
And 5 day trin sum have been working lately . The 5 day and 10 day
Advance decline has been neutral.
I’m not near my computer and I’m enjoying the sun set off the Pacific ocean
Back to the grind of 12 hour days .
As an old captain Said to me a very long time ago while we were fishing
For king crab in the Bering sea .
This is not a democracy ( it’s a dictatorship )
To pull it simply
It’s Peters site everyone, please respect what he has allowed us to use .
In closing
My model points strongly higher once we come out of this cycle low
The next cycle high being June 30 ….
Be careful regardless of what you think and turn off the tv
Thanks again Peter
My comment April 5. https://worldcyclesinstitute.com/predictions-revisited/#comment-16658 ES back to April 5 prices. Very strange.
Peter,
I echo Joe’s sentiments. Thank you very much Peter. You have a special gift . I don’t think I’ll be able to figure out the intricacies. For example, I would have thought the move up from 1/23 to 1/26 as wave i but it is a zigzag and the wave i to wave ii happened early February instead. That’s why when I’m entering or exiting an intra-day or swing trade I use upper, lower indicators and option activity.
I think now that the rules are clear I hope Verne will post again?
Tom,
You said you posted real-time data chart today yet the 18th and 19th have waves. The 17th just shows the waterfall then dead space until end of day. Is it because real-time data was only up to the 17th waterfall then 18th-19th switched to predictive model?
Joe,
You said the Venus bull cycle should last about 10 months and it started 3/27/17. I can’t quite remember the reasons but you mentioned October high. If you notice these swing highs: 10/14/1987, 10/7/1997, 10/11/2007. Is this why you think possible high is October because all these years end in seven?
LizH,
Tks. Verne is welcome to comment if he keeps my proprietary/licensed information to himself. That’s all I ask.
Tks
🙂
Joe, appreciate you responding. Certainly a plethora of planetary aspects to unravel on different markets for those interested. Yesterday I was drawn to Neptune/Mars or Mars/Neptune squaring courtesy of Rotrot sharing a link which triggered a thought, and analysis was very interesting.
I’ve been a traders gold subscriber for 6 months to learn Elliott Wave from Peter. I’ve watched him analyse tough markets with success. The added benefit is this forum which supports traders of all types, experienced or novice, conventional or unconventional. Basically whatever floats your boat!
Thank you Peter, Joe, Rotrot and all contributors.
Hi LizH
The realtime chart I posted has a top and bottom range. The reason the 17th looks empty is because the energy burst that day was so intense it exceeded the lower limit of the chart. The waves were still there but outside the range of the chart.
Tom thanks much! Can you please show us next week’s chart if available?
Wayne
Your welcome
Peter does his best and pays attention to details and is not affraid
To change his mind and he sticks to the Elliot wave rules and does a good
Job backing up his thoughts by showing as well as explaining those rules/guidelines is
why I continue to follow his updates . He does a very good job teaching and for
Those not familiar with Elliott wave theory if you read what he says there is a lot
Of info in his updates .
The old saying give a man a fish etc… Or teach him to fish …
Liz
The Venus bull market begins and ends with Venus mercury and the sun all in conjunction
Together . Sometimes they land together exactly and other times it’s with in a few days .
I may state this backwards but…. Venus would be at inferior conjunct and mercury superior conjunct
To trigger the bull and to trigger the bear it’s the opposite where Venus is superior conjunct and mercury inferior .
The other simpler definition is Venus as a morning star is bullish and Venus as an evening star as bearish .
When both mercury and Venus are together as morning stars it’s considered bullish .
Sometimes when the cycle begins you get mercury selling .
Venus and mercury together with the sun are the key .
The next turn lands around October – year end .I’ll need to look that up .
It will be when Venus conjuncts the sun and following that conjunction Venus will
Be very close to the sun and when Venus turns into an evening star and moves further
Away from the sun you get the larger drop .
To summarize, Venus a morning star bullish evening star bearish , mercury technically the same thing yet
I don’t follow mercury in that manner I just follow the larger picture .
Venus superior conjunct sun with mercury inferior conjunct sun = trend change
Venus inferior conjunct sun with mercury superior conjunct sun = trend change
Lastly , when combined with mars Uranus bear cycle you get huge drop .
Example would be June 2008 to March 2009
Another odd ball with this is when both mercury and Venus are retrograde together
That doesn’t show up much yet when it does and it’s going to last for any length of time
You expect some market to get crazy to the upside .
I hadn’t thought about the 7 years but good observation .
My concern for Oct is from this which I’ve posted a few times .
Oct 1987 to Oct 2002 was 15 years , add 15 years you get Oct 2017
Aug 1982,to March 2000 was 211 months add 211 months you get Oct 2017
Oddball is Aug 2000 high in nya plus 8.6 years is March 2009 low
Add 8.6 years to March 2009 you get Oct 2009
I have previously mentioned this market has become full of Fibonacci time sequences
Count backwards 89 trade days from March 21 2017,and also count back 89 trade days
From I think may 11 ? I’m going by memory .
1932 plus 43 years was the year 1975 plus 43 years is the year 2018
43 is 1/2 of 86 and 86 is 10 times 8.6
Also Peter has mentioned the 172 year cycle in regards to global cooling and also
The 516 year cycle , his Dr wheeler posts should be read .
43 * 2=86, 86 is 1/2 of 172 , 172 *3=516
8.6 * 6 = 51.6 8.6 *60 = 516
My point is whether coincidental or not , both Fibonacci as well as Dr wheeler as well
As Martin Armstrong’s pi cycle are all coming together at the same time .
This won’t last forever but the fact that this is all happening at the same time implies
That if we can put it all together correctly then every swing will be predictable .
Andre has a different approach yet he is also nailing dates .
As Peter says , it’s all the same market , or everything is moving together
Peter g is pointing out other cycles and it’s fitting to .
At some point the collective of all of us will conclude it’s over and won’t really
Be able to explain it using time alone yet it will be as if time ran out .
At that point it’s over .
The wave count , the indicators etc….time….Will all come together at the exact
Same time .
Sorry I got a bit out there .
I’ll be out of phone range soon .
Good uck everyone
Tom, thank you!
Joe, thank you for the detailed response. I will try to digest what you said later. Very productive day picking some winners on sale at open and closing them. Maybe the Mars Uranus cycle Joe mentioned bullish again today.
Valley, thank you for the site. I see Mars opposite Venus today. I guess that’s bullish.
Nice work, Joe! Inner planetary positions have many correlations. Correlation doesn’t equal causation unless it happens almost every time, which many inner planetary positions seem to. ThePlanetsToday.com gives an excellent picture of planetary positions. An interesting line of research is inner planets in relation to Sagitarius (Galactic Center). The GC in the center of the Milky Way has tremendous mass (70 million solar masses) and pushes/pulls on inner planets which seems to effect market, especially when inner planets line up with the GC or square the GC.
Thanks, Valley,
I’ll add this link to my links page.
Great site Valley, very interesting, thanks.
It is not only mass; it’s a huge source of radiation. Any planet that blocks this radiation affects earth. Distance is a thing in gravity, much less in radiation.
5/20 moon wobble (sun 270 degrees). 5/21 Bayer rule 38 and 2 Upagrahas involving Jupiter and Mercury. 5/20 major numerological 9 vibration (to end something). 5/21 12 vibration and 5/22 a fatal 7 vibration. 5/22 Jewish mansion.
The solunar model (19 year cycles) gives a high 5/20-21 (all 6 of them). The 30 and 60 lunar year cycles give a high 22/23.
23 is a bifurcation date and will act as a magnet. Monday will give a high. We’ll be down into at least 5/29. 5/31 and 6/3 are strong dates. So one scenario would be low 29 , high 31 and 6/3 low again. Will give this some thought next days.
May 29 is a market holiday in the USA…June 3 is a Saturday…
Vibrations have no weekends. So when a vibration hits the weekend it will shift to the first day the market can react.
Still, thanks;-)
I don’t think markets will have a down day May 26, the Friday before Memorial Day. http://jeffhirsch.tumblr.com/post/144924608673/memorial-day-tepid-before-bullish-after
André, just quickly (I’m drowning in work damn) wanted to say your crystal ball is on fire!!! 😀
Hi Peter,
Wanted to see your thoughts on market, I think as per your analysis you were looking to reach 2410/2417 and then for wave 4, I think now you it should be wave 3 complete and on to wave 4 down. Just trying to make sure I understand how you are looking at things now.
Thanks
Bill
Peter G,
I been traveling all week…but just noticed that the New York Composite Index (NYA) did not make a new high this week. The SPX did make a new high as you pointed out in one of your post.
So, the advance decline line did “not” have a new high to confirm in the NYA. Does that change anything since you seemed to emphasize that “non-confirmation” relative to the SPX?
The problem with that argument, Ed, is that the a-d line fully confirmed the last all-time high on the NYA on March 1. Although it is logical to match up the NYSE a-d and the NYSE Composite Index (NYA), market history and technicians have always matched up either the DJIA or the S&P Composite and the a-d line of the NYSE. That’s a track record that we have over 90 years of history on, and although I have not looked at every single new ATH (all-time high) over the past 90 years to match it up with the a-d line, I cannot remember a time when the a-d line reached an all-time high AFTER an important top in the DJIA or S&P, and the DJIA or S&P high proved to be an important one. That much having been said, I should also comment on the fact that we now have many quote sources for NYSE advances and declines. I have Trade Station software and their a-d quotes do not show a new high on the a-d line after April 26. If we trust those data, then we do have a divergence on the latest all-time high on the S&P Composite, albeit not a large one. What we need to remember beyond the potentially very important time resolutions that are due right now here around May, plus or minus a week or two, because of the long-term nature of the patterns, is that there is a 17 year pattern that goes back to the inception of the DJIA just before the beginning of the 20th century (1896) with turning points in 1898, 2015, 1932, 1949, 1966, 1982 (only year to be off an exact annual resolution, due in 1983), 2000. 2000 plus 17 equals ??
The year after 1898 in last two lines above should obviously be 1915, not 2015…
Two words to think of for this past week
Options expiry
A third word to think of is gravity. A weak pull is bullish and a strong pull bearish. I won’t go into detail about how to asses this force but I can tell you it is bullish into this weekend. En then bearish next week.
The moon was strong into 5/18 and now weak into 6/2.
I must have said something like 18 low, 22 high. Not much to add. Next week 3rd leg down. 22-25; that is the vibrational cycle.
The Hindu have 6 seasons. We are now in Grishma. That runs from 4/20 into 6/21. Midpoint 5/21.
One cycle we use is Stan Harley’s 377 divided by root 5. In years and counting from 9/3/1929 it runs into 2098. We calculate vibrations to get interim dates. This gives a period from 12/12/2013 into 4/3/19. Interim dates on this period give 4/1, 5/22, 7/8.
Remember 7/6 is 8 years and 4 months from the 2009 low. This is a numerological cycle (100 months). Very likely this will be the last low before we head up into september.
Musical forecast on the major 2002-2007 cycle (5 years) gives 2/8/16 into 10/9/22.
vibrational interim date give 3/30, 5/22, 7/5. Compare this to the above and ask yourself how two completely different cycles can give the same dates.
Answer : there is only one fundamental set of vibrations but many ways to find them. To prove this point a 3rd cycle. Gann used the average of the outer planets as a price line. Using the 3/1 high price it is easy to see the average will reach this point 1/12/2019. (take note of this date!).
Vibrational interim dates here give 5/2, 5/22, 6/9, 6/25 and 7/10.
5/22 will be a high.
The square of nine on the 2007 close high gives 5/21 at 0 degrees. This is an 8 month cycle. The general rule is that 0 degrees on a high will bring a high and 180 degrees a low, vv.
Special about this date is that it is the 30th cycle in the sqr9. Or 30 degrees. This could be the strongest date since 2007.
for a host of reasons, have decided to post something previously shared privately on November 3, 2016, with our gracious host …”Mueller is the real deal”…
please carefully review the thread that includes the below post…
https://worldcyclesinstitute.com/the-cycle-turns-on-canadian-banking/#comment-16462
now read the article “What Donald Trump Needs to Know About Bob Mueller and Jim Comey”…
http://www.politico.com/magazine/story/2017/05/18/james-comey-trump-special-prosecutor-robert-mueller-fbi-215154
Comey and Mueller are patriots…the citizens of the United States are fortunate that men of their caliber have elected to serve the people and uphold the Constitution…
Respectfully rotrot, comey’s handling of the HC email situation was disingenuous at best and criminal at worst. It should have been the AG ‘s decision to prosecute, not his. Even if the AG was compromised, he should have taken the evidence to the deputy AG. Just a thought
“please carefully review the thread that includes the below post”…”carefully”…”Comey may not be an effective leader”…
This website is for educational purposes relating to Elliott Wave, natural cycles, and the Quantum Revolution (Great Awakening). I welcome questions or comments about any of these subjects. Due to a heavy schedule, I may not have the time to answer questions that relate to my area of expertise.
I reserve the right to remove any comment that is deemed negative, is unhelpful, or off-topic. Such comments may be removed.
Want to comment? You need to be logged in to comment. You can register here.