
Let’s look at the US markets, at a point that is nearing a final 300 year top. In fact, everything I see tells me the US indices topped in today’s session. (The charts below are all yesterday’s charts—May 19, 2015).
As far as I’m concerned, all the major indices have reached their measured targets as as today’s session. We have a DOW Theory non-confirmation bear signal, Elliott Wave counts that signal an impending major wave ending, and natural cycles showing a downturn eminent for the SPY (SP500). I’ll address all of this below in a series of charts.
If you’ve read my posts before, you know I use the Elliott Wave Principle in conjunction with cycles software (in this case, TechSignal 9, from the Foundation for the Study of Cycles), to predict market movement. The market moves in anything but a random fashion!
With predictive technology, it’s becoming much easier to identify both market turns and price levels to target short-term.
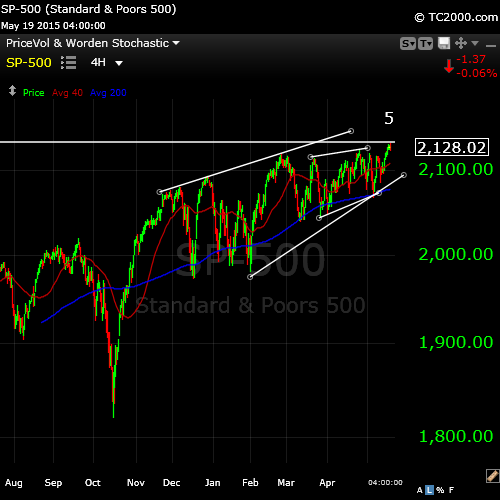
The daily chart of the SP500 above shows what began as an ending diagonal and then morphed into what looks like a smaller ending diagonal within the first. (I’ve marked the top with a ‘5.’)
Today, we met the upper trendline (the target) and immediately withdrew into a small wave down that looks quite motive. We’ll see what happens from here, but I’m leaning towards a top, when you take into account all the information on this page.
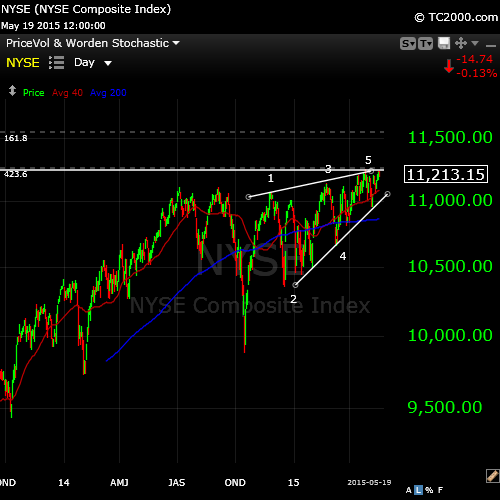
Above is a daily chart of the NYSE showing a very clear ending diagonal pattern. An ending diagonal is that—an ending wave pattern. Once complete, the market should reverse. I’ve posted a pattern chart for an ending diagonal below, in case you’re not familiar with it.
I keep an eye on the NYSE as it’s the largest stock exchange and tends to have clearer patterns than the other US most watched indices (Nasdaq, DOW, and SP500).
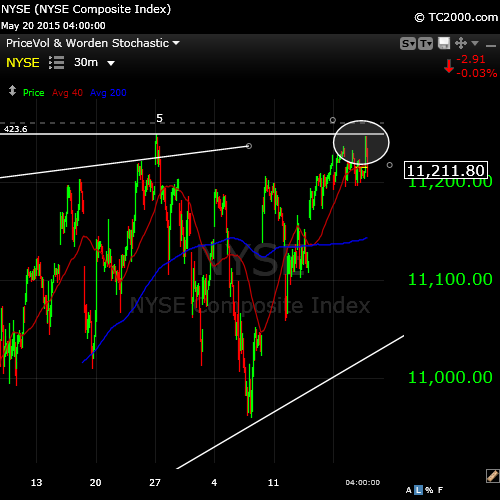
Zooming in to the NYSE with a 30 minute chart (today’s date—May 20) you can see the double top (circled). This happened towards the end of the session, with the release of the Fed minutes suggesting that there would not be an interest raise rise in June of this year. This double top is a test of the final 5th wave top that was the top of the ending diagonal. This should mark the very top of the entire wave. In Elliott Wave Theory, the top of the fifth wave is the end of a trend.
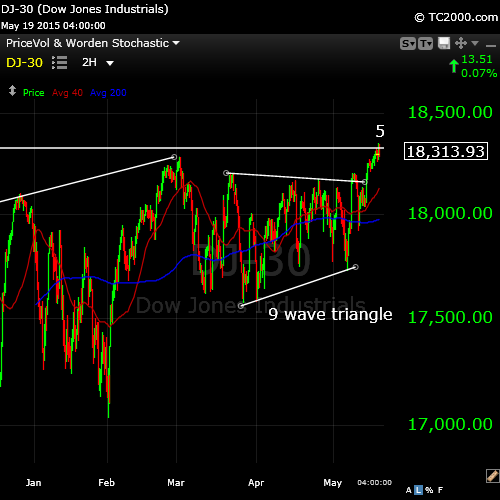
Above is a chart of the DOW, showing what I believe to be the top of the final wave (5). The DOW began this final wave as an ending diagonal but then morphed into a nine wave (the maximum allowed) triangle. A triangle is always in the fourth wave position an signifies the upcoming end of a wave pattern. In this case, it was double confirmation of an impending trend reversal.
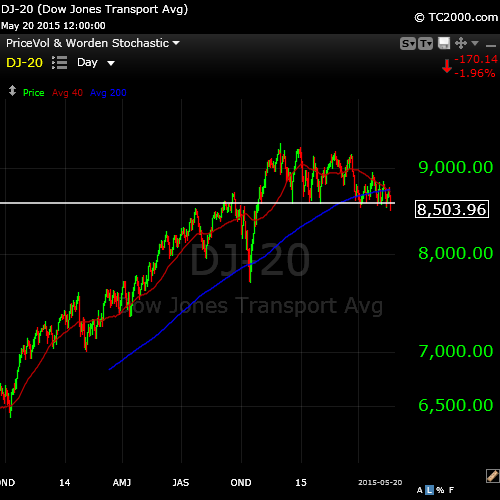
At the same time that we were building a final top, the DOW transports were heading down. (You can see the chart of the transports directly below.) This is known as a DOW Theory Non-confirmation. Today, we broke through an important shelf (you can see this in the chart below).
Dow Theory Non-Confirmation
“Dow Theory” suggests that when the industrials and transports are moving up in tandem, a bull market is in force and the economy is chugging along at a healthy clip. By the same token, if the averages part ways, it could be viewed as a warning sign that something in the economy is out of line.
To put it more plainly, the Dow industrials represent the output of the economy (read: supply). The transports represent the vigor of the economy (read: demand). If the industrials are roaring, but the transports are faltering, the economy might be oversupplied with goods — a sign that demand is waning. That is viewed by some as a “sell” signal for the market.
Cycles
All market assets (currencies, stocks, commodities, futures, indexes, etc.) have natural waves all through them. These are regular recurring waves of differing lengths that tend to mark tops and bottoms of price patterns. Knowing what these cycles are provides a strong indication of when a market will turn either up or down.
Using the latest software, we can search for the cycles within several years of data and determine cycle turn dates going forward. Using TechSignal 9, we have analyzed the SPY ETF (approximately 13 years of data) to determine the turns going forward.
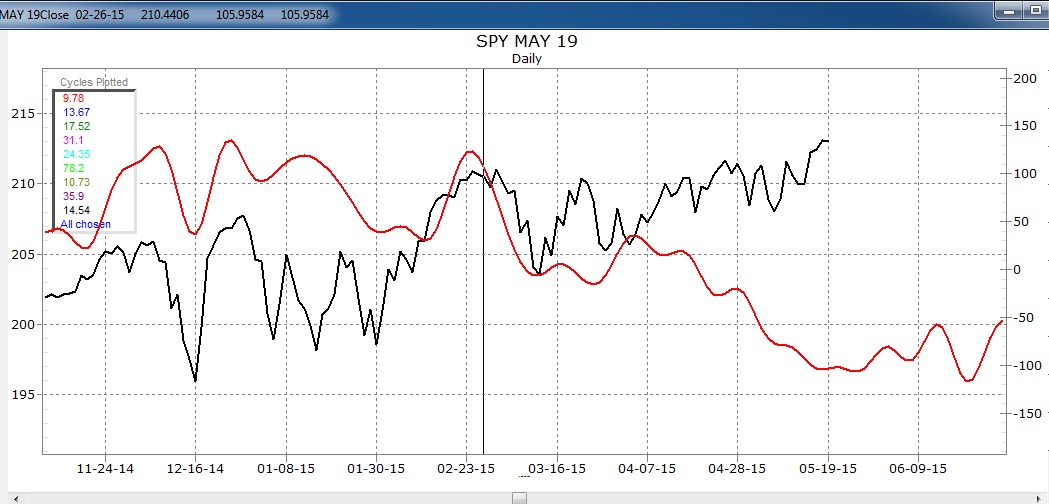
The chart above shows the SPY daily price chart (in black). The red line is an analysis of the cycles prevalent within the SPY over the past 13 years. The program analyses the price pattern and identifies up to 25 cycles at all time frames. What you’re seeing is a synthesized line (all cycles combined) that shows an imminent downturn. This happens with a set of natural cycles (sine waves) of differing wavelengths coincide with a downwave at the same time. This is a strong wave down and has been signalling a downturn coming for the past month or so.

The above chart has filtered out all the lesser cycles. This synthesized red line contains only the top four cycles. These are the cycles that have returned the most lucrative trades over the past thirteen years. This would suggest they’re the most accurate. They are signalling a wave high towards the end of May with an immediate downturn.
Summary
All these patterns, theories, and natural cycles are forecasting a major downturn NOW.
Ending Diagonal Triangle Pattern
Below is an ending diagonal. We’re interested in the version on the left, for a waning bull market.


Excellent commentary and charts! Great insight… thank you.
Thank you….very good…..This is of great concern to me. … I will send you a e- mail today.
Nick Timpa