
Update: Monday, July 16
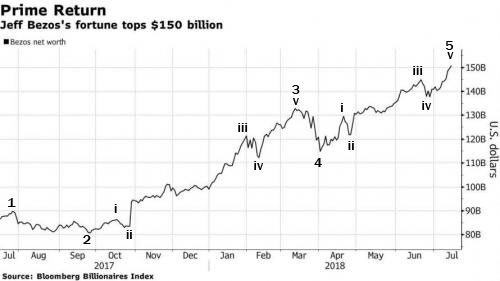
Above is a chart that was part of a zerohedge article on the Amazon insurrection in Europe. As I’ve written before, you’ll find EW trends throughout society and here’s another example. If I was Jeff and understood how trends unfold, I’d be worried. After 5 waves up, the trend will reverse. We’re not quite there yet, but it won’t be long …
_________________________
They’re Rare. But They’re Everywhere!
It didn’t take long for the SP500 to completely upset last week’s apple cart. I finished the report on last weekend and by the end of the day Monday, the SP500 had determined that it was going to head higher and trace out an ending diagonal. I’d given up on that idea a couple of weeks earlier.
Way back in May, an ending diagonal had been my first expectation for the unfolding triangle pattern in both the SP500 and ES (emini futures). That was partly because of all the other ending diagonals in other indices.
But the third wave of the triangle headed south unexpectedly in mid June at the 2796 level. What was unusual is that the turn down was in three waves (rather than the usual five waves). Five wave moves signal more to come in the same direction; three wave moves retrace.
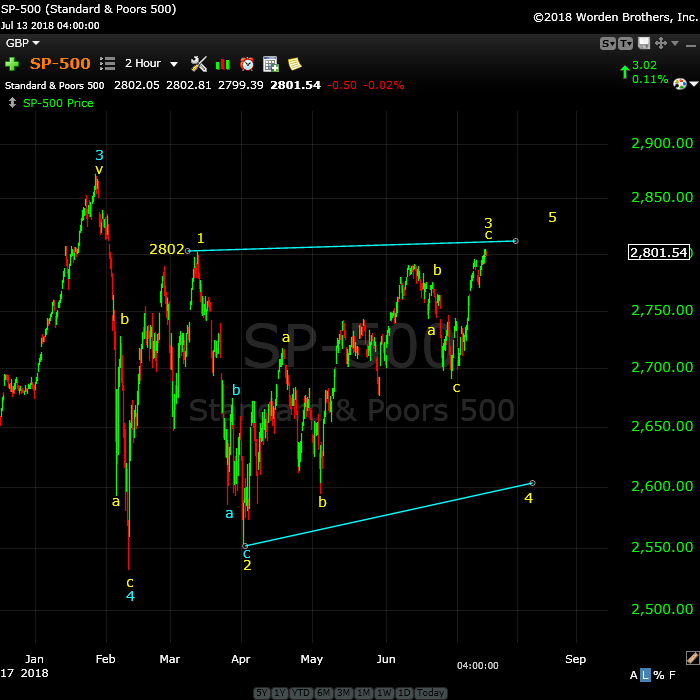 Above is the 2 hour chart of the SP500, which is now brandishing an ending diagonal, as are so many other assets. You can see that the upper trendline now has a rising slope. Each of waves one, three, and five must seek a new high in an ED.
I remarked at the time that it was an odd way to start the E leg of a contracting triangle, because waves within triangles are typically recognizable corrective patterns (ie – flats, zigzags, triangles, and even ending diagonals). They are not three wave patterns. But I’ve had to temper some of my expectations in a market that’s proven to be volatile and somewhat unpredictable (within the confines of the current triangle pattern).
Well, the turn down in three waves was the market giving a very subtle message that it wasn’t done with the upside, as it showed us this week.
The Nasdaq, NDX, NQ, Russell 2000 and 3000 have all now traced out ending diagonals.
This past Monday, when ES rose above 2760, it became very obvious to me that an ending diagonal for the SP500 and ES (futures) was back on the table, even though these indices were displaying underlying weakness.
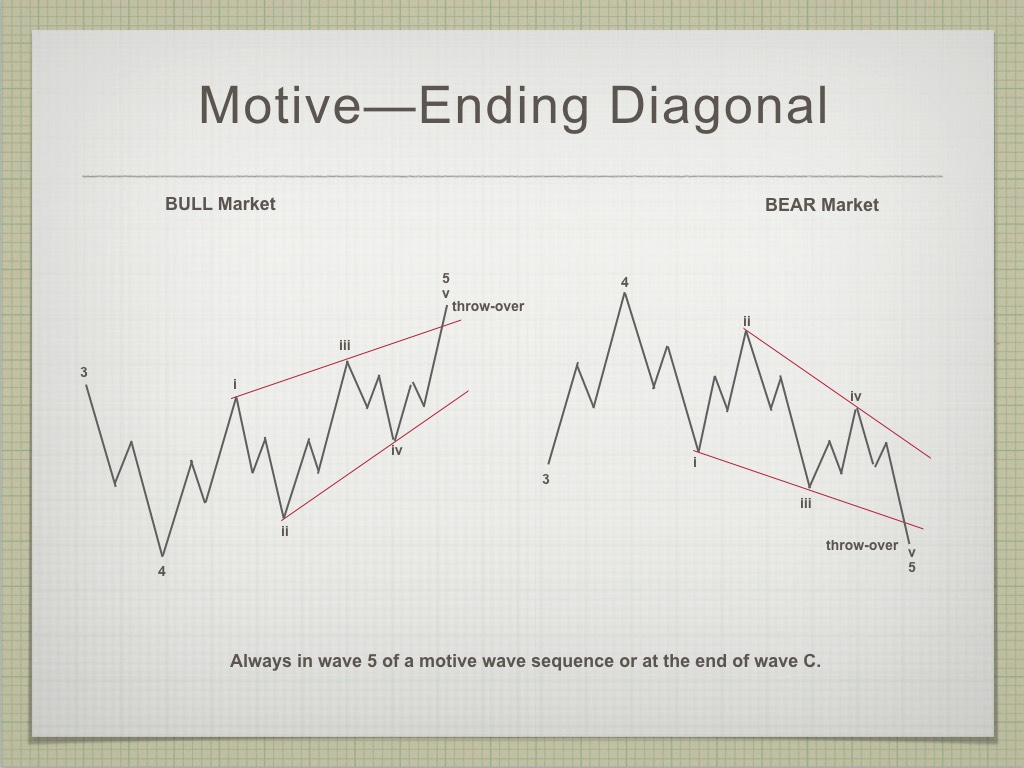 I consider an ending diagonal a corrective pattern. They appear at the ends of waves—third waves, fifth waves, and C waves. They warn of a pending change in trend. They also “cap” the trend, in that they set a limit as to how far the final fifth wave of the pattern can travel (the final fifth wave cannot be longer than the third wave of the diagonal).
On Friday, the SP500 technically confirmed an ending diagonal when the third wave of the pattern (previously the D wave of the contracting triangle) made it to a new high above 2802.
I don’t yet have a target for the final wave up, and may not have one for a couple of weeks. That’s because the fourth wave of an ending diagonal must be fully in place before you can project a maximum length (and target) for the final fifth wave.
But, at this point we know that the trend is at an end (or almost so). We actually knew that because of all the other ending diagonals in the other major indices. So does a contracting triangle, but an ED is a much more dramatic statement that the trend is extremely limited.
Even though ending diagonals are considered relatively rare, they just happen to be all over the place in this market. Following are some charts that show ending diagonals taking shape in a number of major assets.
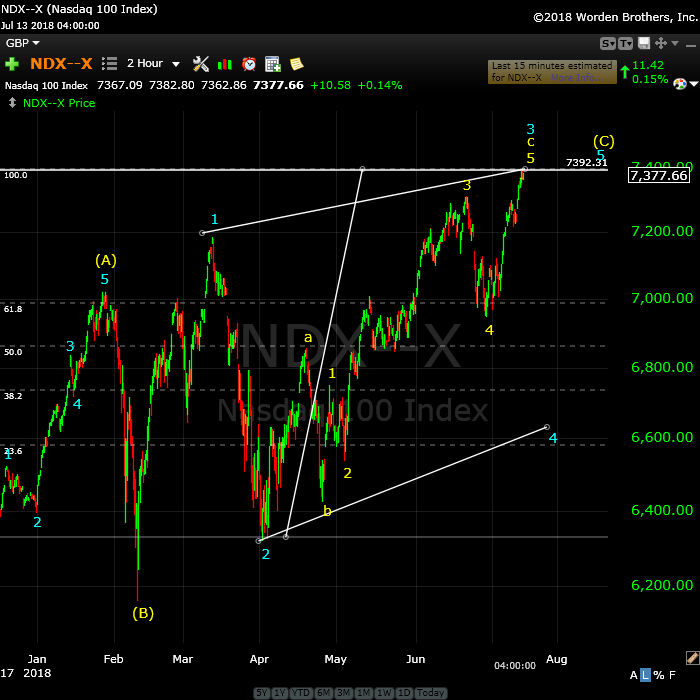
Above is the 2 hour chart of NDX (Nasdaq 100). The upper parallel line is the limit for the blue wave 3 based upon the measured length of blue wave 1. Wave 3 cannot be longer than wave 1. We’re at the top.
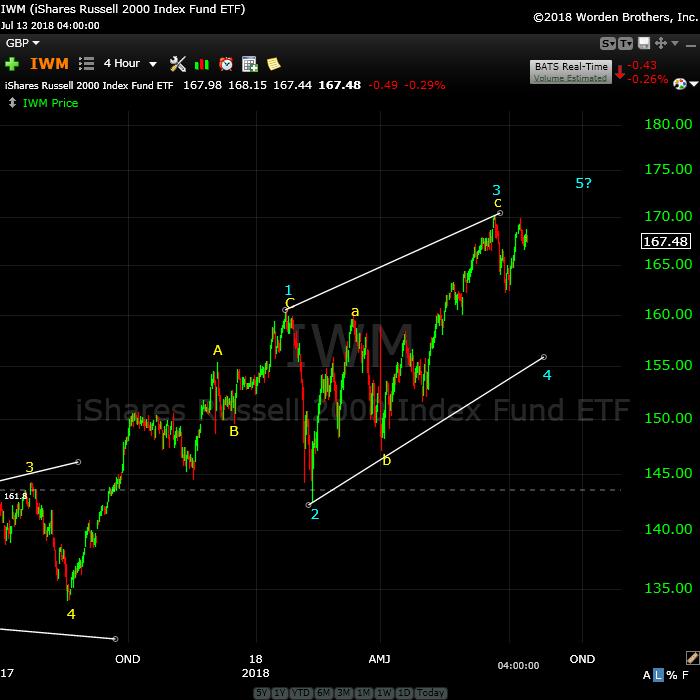
Above is the 4 hour chart of IWM (Russell 2000). Note the shape of the third wave. You’ll find this distinctive ABC pattern in almost all ending diagonals.
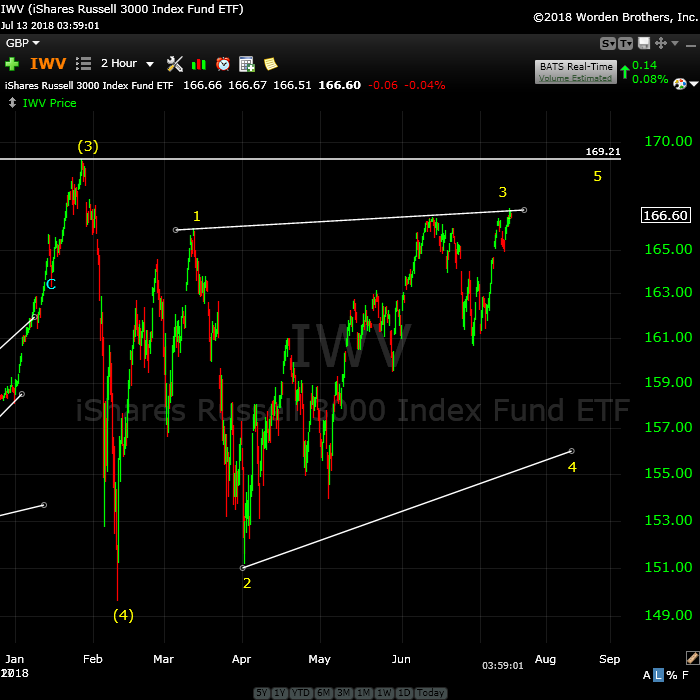
Above is the 2 hour chart of IWV (Russell 3000). This index is not as bullish as the others. Wave 5 will have to get to an all time new high, though, above 169.21.
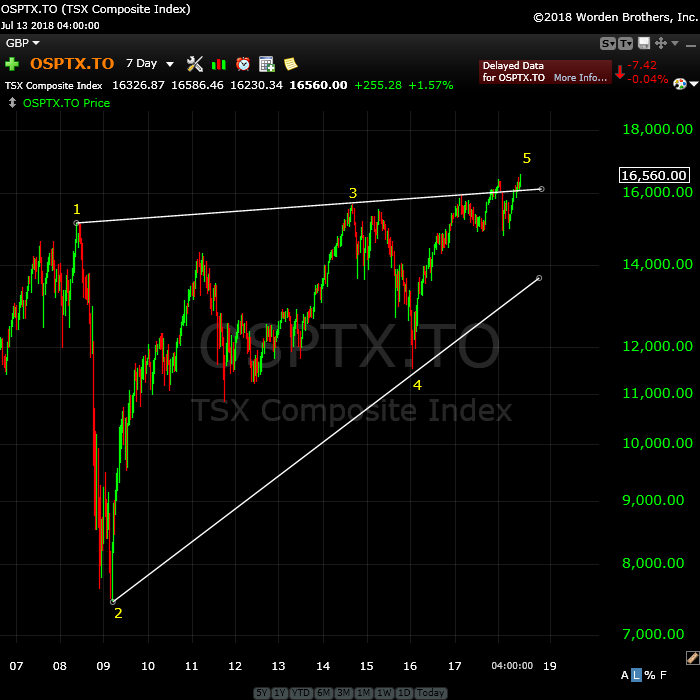
Above is the 7 day chart of TSX (Toronto Composite Index). I often refer to this as the scariest chart I’ve ever seen, due to the fact that this ending diagonal is ten years long!
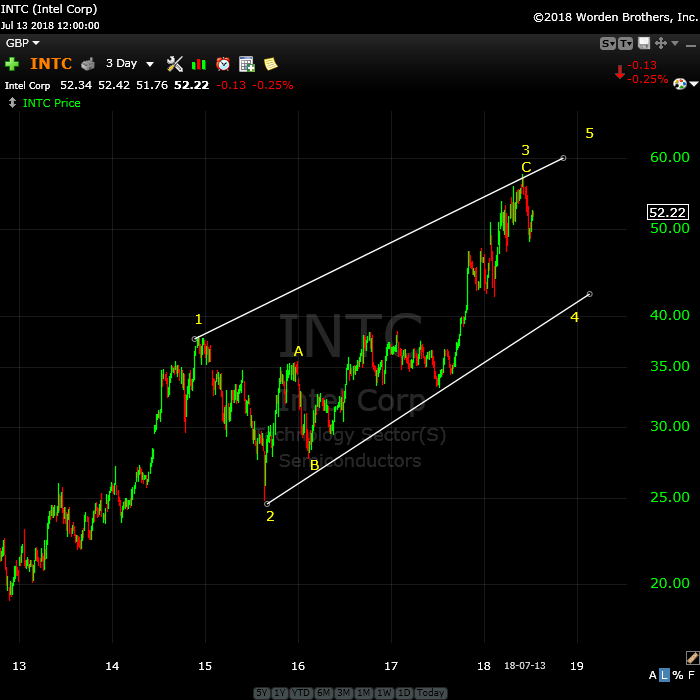
Above is the 3 day chart of INTC (Intel Corp). Wave 4 must drop enough to reside horizontally within the area of wave 1 (it must drop to at least $37.90, which is the top of wave 1).
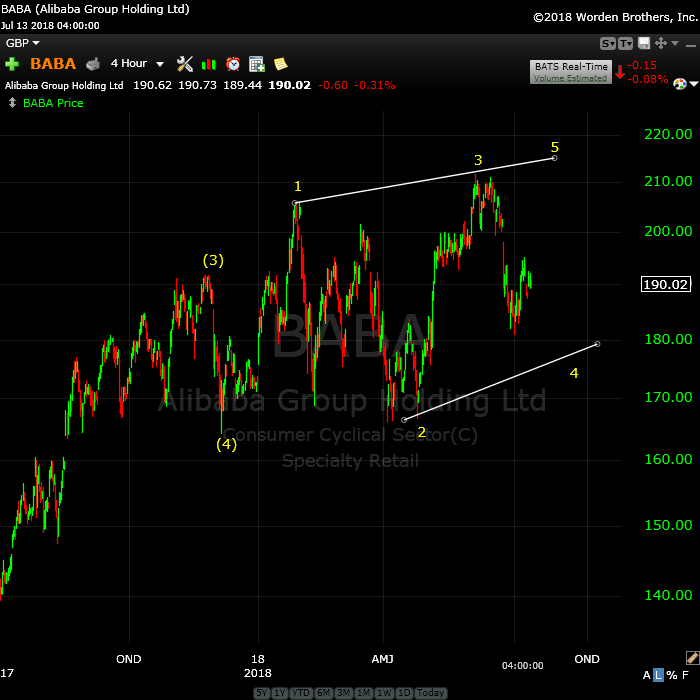
Above is the 4 hour chart of BABA (Alibaba Group). A rather bearish version of an ending diagonal.
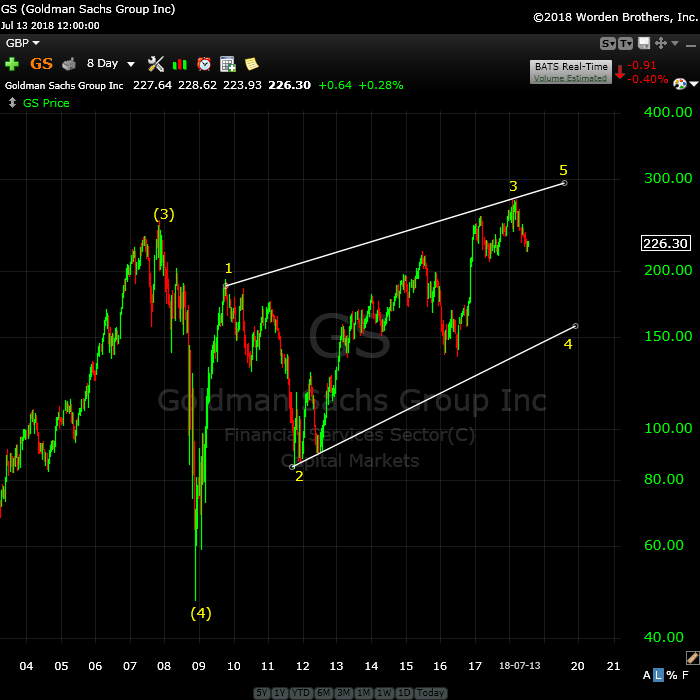
Above is the 8 day chart of GS (Goldman Sachs).
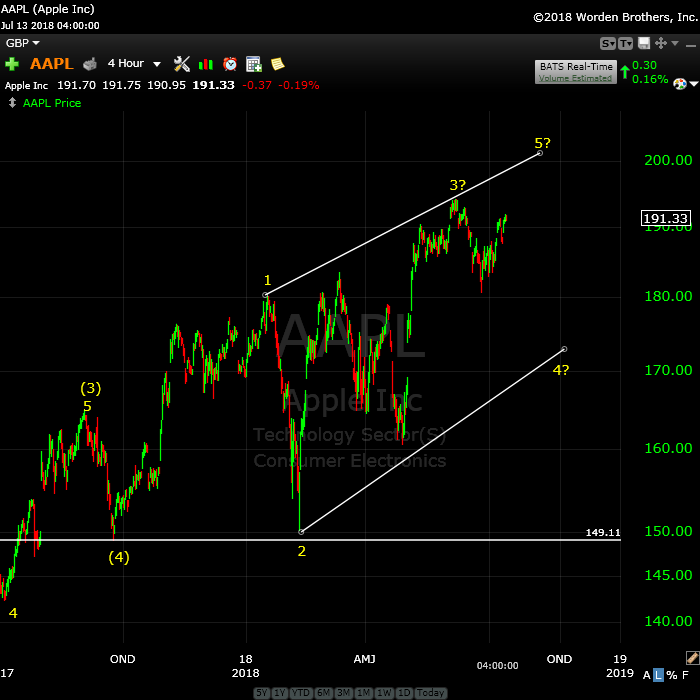
Above is the 4 hour chart of AAPL (Apple).
They’re everywhere! The long awaited change in trend is indisputable, and almost at hand!
_______________________
Elliott Wave Basics
There are two types of Elliott wave patterns:
- Motive (or impulsive waves) which are “trend” waves.
- Corrective waves, which are “counter trend” waves.
Motive waves contain five distinct waves that move the market forward in a trend. Counter trend waves are in 3 waves and simply correct the trend.
All these patterns move at what we call multiple degrees of trend (in other words, the market is fractal, meaning there are smaller series of waves that move in the same patterns within the larger patterns). The keys to analyzing Elliott waves is being able to recognize the patterns and the “degree” of trend (or countertrend) that you’re working within.
Impulsive (motive) waves move in very distinct and reliable patterns of five waves. Subwaves of motive waves measure out to specific lengths (fibonacci ratios) very accurately. Motive waves are the easiest waves to trade. You find them in a trending market.
Waves 1, 3, and 5 of a motive wave pattern each contain 5 impulsive subwaves. Waves 2 and 4 are countertrend waves and move in 3 waves.
Countertrend waves move in 3 waves and always retrace to their start eventually. Counrtertrend (corrective waves) are typically in patterns — for example, a triangle, flat, or zigzag. Waves within those patterns can be difficult to predict, but the patterns themselves are very predictable.
Fibonacci ratios run all through the market. They determine the lengths of waves and provide entry and exit points. These measurements are really accurate in trending markets, but more difficult to identify in corrective markets (we’ve been in a corrective market in all the asset classes I cover since 2009).
To use Elliott wave analysis accurately, you must be able to recognize the difference between a trend wave (motive) and a countertrend wave (corrective). There’s very much more to proper Elliott wave analysis, but this gives you the basics.
____________________________
Registration for Commenting
Want to comment? You need to be logged in to comment. You can register here.
If you register, it protects your information. It also allows you to comment without filling in your information each time. Once you’re registered, simply go to the home page and click on the login link top right in order to log yourself in. Usually, you’ll be logged in for several days before needing to be logged in again.
______________________________
Problem receiving blog comment emails? Try whitelisting the address. More info.
______________________________
Get an upper hand … JC 2
Get an upper hand in trading …Seeing all the different currency pairs and the wave structures and hearing you explain why this has to do that on a nightly bases gives one a upper hand when trading. Elliott Wave applies to all stock and indices and can be applied to any candlestick chart. If someone ask what you want for Christmas – Tell them a membership to Peter’s “Traders Gold!”—JC |
Have not had a losing week RW 2
Have not had a losing week …I have been with Peter almost a year. The only thing that matters is have I made money with his service. I think I have finally turned the corner using Peter’s EW. I have not had a losing week in the last 5 months. Thanks Peter, for your amazing amount of hard work. —RW |
A true expert in Elliott Wave FL 2
A true expert in Elliott Wave …You are a true expert in EW analysis. What you provide is not available anywhere and is priceless. Subscription on your services is the best thing I have ever done. Many thanks for your effort to make me a better investor. I now have more trust in my investment decisions. I hope you will continue the excellent work! —FL |
the real deal SM 2
The real deal …‘Educational, insightful and thorough market analysis for all levels of traders. It’s Elliott Wave at its best….Peter Temple is the real deal’ —SM |
Couldn’t be happier … KK 2
Couldn’t be happier …The analysis and insight you provide is simply amazing! I’ve been trading the futures and equity markets for well over thirty years and usually average around 5% monthly. Since joining your Traders Gold Service two months ago, that number has better than doubled. I couldn’t be happier.—KK |
Tops in your field DZ 2
Tops in your field …You are tops in your field. Tried to follow Elliot Wave international for years. They were always behind the market. After discovering you, I perceive that you are an expert in reading the waves, which puts you way ahead of the rest of your peers. And you can read the Waves like you are reading tomorrow’s financial section. I pray you stay healthy. —DZ |
Rise above the rest … SM 2
Rise above the rest …I have only ever met a few people who, in their chosen fields (astrology, medicine, music, martial arts, technical analysis), rise above all the rest and you are one of them…you have ‘the gift’…and that’s why I’m a Trader’s Gold member. —SM |
The best of them JL 2
The best of them …Last couple of years, I subscribed to several ‘market traders’. You are by far the best of them and the personal contact is awesome. Daily and daily updates are very well written! Besides your expertise in EW, I also like your cycles analysis. Best investment I ever made! —JL |
The Market This Week
Here's the latest daily chart of ES (emini futures)
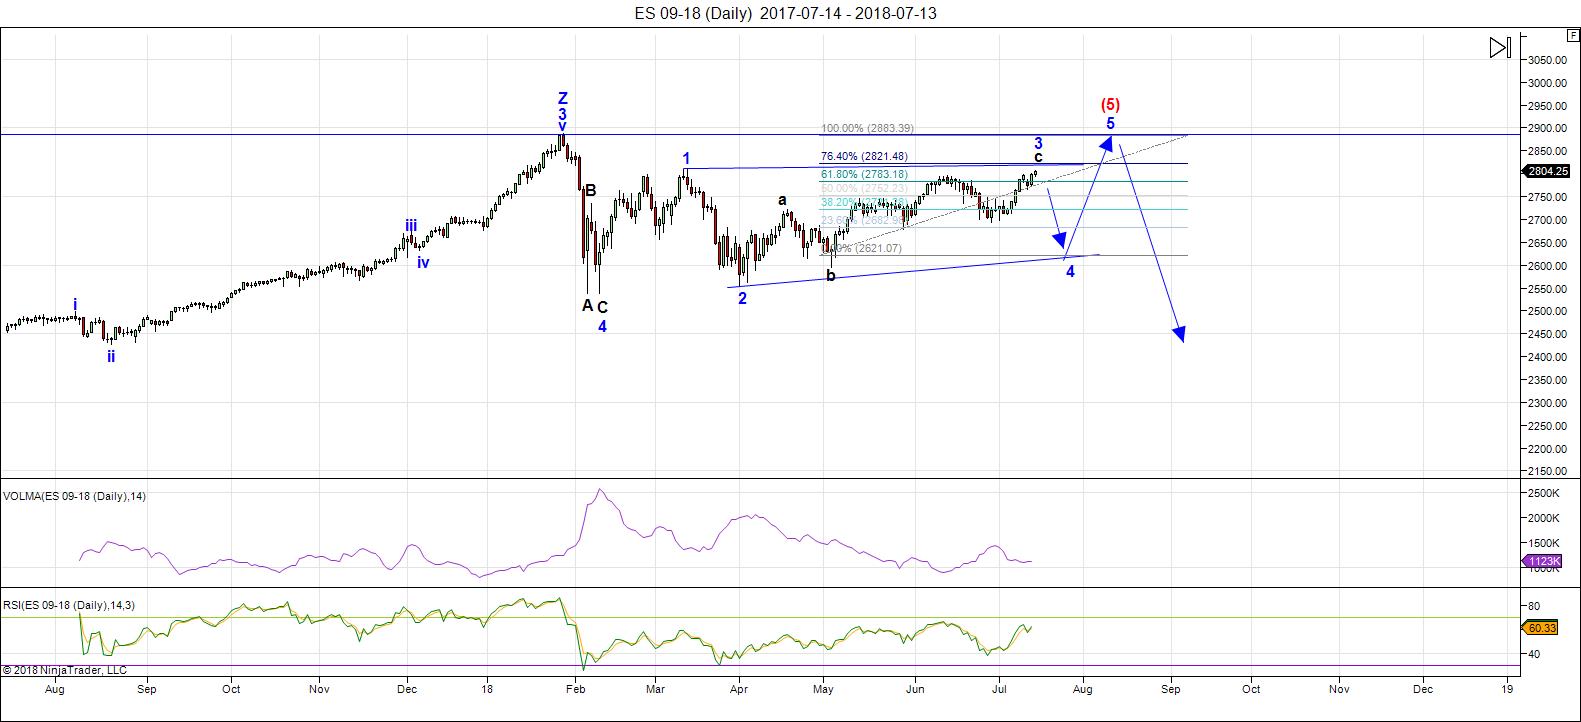
Above is the daily chart of ES (click to enlarge, as with any of my charts).
I commented this past week in a nightly video for my Trader's Gold subscribers that this market is going to one that I'll remember for a long time. That's primarily because the NYSE is tracing out a contracting triangle (a corrective pattern that's almost evenly balanced between bulls and bears, and moves sideways). Because it's summer, this balance is exacerbated by extremely low volume, which leads to volatility. As well as low volume due to summer, we're at the top of a 500 year rally (everybody who wants to be in the market, is).
Sentiment is at historically bullish levels, but the smart money has been leaving for quite some time.
The market is volatile and at times unpredictable. It moves to extremes in both directions (due to its "balanced" nature). On top of that, all major asset classes are moving in tandem at the whim of the US Dollar. As a result, assets tend to get "pushed around" when they react to some of the volatile moves the buck has exhibited over the past few months.
It's a great time to be on holidays and not in the market!
Monday of this past week, I predicted that wave D of the SP500 was indeed going to a new high (resulting in an ending diagonal). On Friday, we achieved that goal. But it became clear midday on Friday that we'd have to wait until Monday for the turn to the downside.
The wave down will be the fourth wave of the ending diagonal, with a target somewhere near 2600-25.Then we'll turn up into the fifth and final high ... but a high that will have a definite maximum target (to be determined once the fourth wave is fully in place.
Summary: We should turn down early this week into the fourth wave of an ending diagonal. Once the 4th wave (down) is complete, expect a final fifth wave to a new high. That fifth wave up to a new high will be the end of the 500 year bull market.
___________________________
Trader's Gold Subscribers get a comprehensive view of the market, including hourly (and even smaller timeframes, when appropriate) on a daily basis. They also receive updates through the comments area. I provide only the daily timeframe for the free blog, as a "snapshot" of where the market currently trades and the next move on a weekly basis.
______________________________________
Sign up for: The Chart Show
Next Date: Wednesday, July 25 at 5:00 pm EST (US market time)

The Chart Show is a one hour webinar in which Peter Temple provides the Elliott Wave analysis in real time for the US market, gold, silver, oil, major USD currency pairs, and more. You won't find a more accurate or comprehensive market prediction anywhere for this price.
Get caught up on the market from an Elliott Wave perspective. You’ll also get Andy Pancholi cycle turn dates for the SP500 for the balance of the current month. There’ll be a Q&A session during and at the end of the webinar and the possibility (depending on time) of taking requests.
All registrants will receive the video playback of the webinar, so even if you miss it, you’ll be sent the full video replay within about an hour of its conclusion. For more information and to sign up, click here.


Wow! I felt a bit silly going short NDX when I was so uncertain about SPX and DJI but your charts clearly explain the rest of the story! Some of my momentum indicators for NDX were so crystal clear ( powerful bearish momentum crossovers) that I pulled the trigger just before the close today. I fully agree that SPX and DJI cannot be far behind. I would not be at all surprised to see a futures ramp Sunday night to suck in a few more hapless bulls before the hammer falls on Tuesday. I am betting they keep it ramped for most of Monday (high distribution volume) with the dive beginning in the futures market overnight Monday evening. I will be trading SPX via Aug 3 280 puts…lots and lots ’em!!
Thanks for the early delivery Peter. See ya at the chart show on Wednesday.
Wowza!!!
I just wanted to show that virtually everything is finishing up, as I’ve been saying. They’re all in more or less the same position: Near the end of the final pattern of the bull trend. Couple these with the dollar charts from last week (and the NYSE, which is also in last week’s post) and it’s hard to see how we get through the fall without a good deal of “action” to the downside.
Thanks Pete.
Verne – you talked about margin debt the other day. How accurate do you think these charts are in this article. If correct this whole deal is going to get very nasty.
https://www.advisorperspectives.com/dshort/updates/2018/06/25/margin-debt-and-the-market
Peter T,
You mentioned that in your “Market this Week” segment that in a nightly video update that the NYSE’s contracting triangle was showing the way to what could be the END of this 500 Year Rally. Would you be willing to share that labeled chart?
Hi Ed,
It was the first chart in last week’s blog post. You can find it here: https://worldcyclesinstitute.com/pushed-around-by-the-us-dollar/
It shows a contracting triangle in a fourth wave position. There is only one more actionable wave in the current trend after a contracting triangle (or any triangle) in a fourth wave position. So there’ll only be one more wave up to a minimal new high after the triangle completes the E leg down.
Or did you mean something else?
Peter T,
That was exactly what I wanted to know! Thank You!
Yep! Another ticking time bond is the massive float from so many corporations issued to engineer stock buybacks, which now dwarfs that of the last crisis. Those bonds are going to implode when stocks take a hit. Add to that the explosion of so-called “passive investing” by way of the buegeonig ETF universe and and you’ve got more fuel for the coming conflagration. As huge a pain in the tush the price action in the markets has been the last few months, there is something very satisfying about seeing the indices all fall in line converging on the ED pattern. This in my mind confirm the late hour on the clock, and gives us traders an excellent road map going forward. EDs are very well behaved animals!
Take a look at the noaa data ……Lots of 0 spot days
http://www.solen.info/solar/indices.html
http://www.effectivevolume.com/showthread.php?10757-Grand-Solar-Minimum
Hi Joe, the current cycle is due to end in 2019.
The correlation with sunspot minima and market lows is well established by several studies.
Do any of your indicators call for a 2019 low?
If the sunspot correlation holds for this cycle, that implies the market is going to give back the last nine years of gains in the
the next roughly 18 months, a very steep and dramatic dive indeed! Thanks!
Joe,
Lack of sun spots equate with a potentially weaker market, right?
Just adjusted everything on the website. http://www.prognoseus500.nl/
Monday a little LOW to shake up everyone then we go up to Thursday and then the decline into the weekend. There is almost no direction of my indicators. So let the earning season start to make the movement. 11-13 july is the High (Bradley and indicator 1) But this week my indicators gives no real decline. We could make a second High on Thursday and then starts the decline to 2 or 10 of august.
Peter I have a quick query about the ES chart. The C leg of the third wave looks a bit strange. It looks like what I think is a fourth wave going below the first of the five waves up for the C wave to complete the third wave zig zag. I know the fourth wave of the ED has to return to wave one territory but did not think it was permitted for a C wave. What am I missing? Thanks!
Verne,
I’ve been looking at the chart trying to understand your description, but I don’t know if I fully understand your concern. The a wave of the third wave is a zizag. Then it’s followed by a zizag and the final wave could also be characterized as a zigzag, so you could label it as a triple zigzag, although there are other ways to label it.
It’s a corrective wave and as such, the C wave can be any configuration it wants to be. If you’re referring to the usual ending diagonal ABC wave I talk about, it’s there, just not as pronounced as other examples, as ES appears to be so weak.
I don’t know what your concern is because you have articulated it, so I not sure what underlies it; I may be missing your point.
I guess I was assuming the C wave of the third wave zig zqg would be a five waver….
http://www.effectivevolume.com/showthread.php?10757-Grand-Solar-Minimum
Rare gap open in futures….possible exhaustion?
Quite possible. A break above 2800 just to stop some shorts and suck some longs in. There may be another attempt at it in the next couple of days. I am already short half my size from Friday. I will look to sell upto full size on next break higher or lower.
Starting to to look like consolidation at the critical DJI 25K and SPX 2800 pivots.
I am holding long positions as I think we go higher from here. This kind of sideways price action at these pivot battles almost always lead to more upside. If we are going to get turn this week, it won’t be today. Just one trader’s opinion. You cannot argue with price.
Agree Verne. Looks like a 4th wave of small degree. I am looking to sell the pop higher from this mini triangle. My time frame is a few weeks to months and I target about 5-10% move on SPX. I do not wait for the absolute top to sell just because I am not that good. I have targeted 2800-2840 as the sell zone between right now and Aug 10-14. Then I use smaller degree Elliot wave to get good entry points. Seems like I will get 2815-2820 later this week.
I posted a chart of Jeff Bezo’s wealth at the top of the post. Elliott Wave structure is apparent through almost all trends, and here’s another example.
Haha! Peter you do realize there is an inherent assumption in that chart don’t you?
And that is of course that he will ride the wave down!
Bezos is a very smart guy. What if ge goes to all cash??!!
In a deflationary environment his net worth would actually increase substantially as the dollar goes higher!
Then again, he just might hang onto all those AMZN shares on the way down…lol!
No, this is a paper profit. It’s based upon Amazon as an asset. The only way he could do what you suggest is to sell right now for cash. Otherwise, the value of Amazon (which also has a pile of debt, which balloons in a deflationary environment), will implode like every other asset. EW doesn’t lie. He’s sitting at the top of 5 waves
To that end, the latest warning from the IMF: https://www.zerohedge.com/news/2018-07-16/imf-warns-sudden-repricing-asset-prices-it-trims-economic-forecast
There is going to be a double whammy when the market heads down. Both the shareholders and bond holders alike are going to get whacked.
Strangely enough, the bond holders could end up felling the most pain.
At some point the share holders can salvage at least some of their capital after the plunge commences. If the market is at the inflection point so many of us think it is those bonds are going to zero!
What a conundrum!
Can you imagine what would happen to the price of the stock if Bezos tried to cash out all at once???!! I think he is stuck….
Yikes!!
I think he’s been reading the history of Louis XVI, as now his European employees are revolting. But he keeps leveraging up. Will be a great short soon.
Speaking of revolting, I no longer shop at Whole Foods. Bezos, like the greedy neanderthal that he is, all his billions notwithstanding, has completely destroyed a magnificent retail model and turned those outlets into a pale shadow of what the used to be…terribly sad!
Yep! That’s what I see as well Vivek…
Eyeing those SPX July 25 280 puts with an open “stink bid” of 1.20. Now trading for 1.75. I expect to get filled by no later than Wednesday at the close.
Interesting. Not looking very bullish for DJI.
The banksters keep frantically dumping cash to close downward gaps in the cash session. Just how long can they do dat??!! 🙂
Once again NFLX delivers post earnings.
The pop is usually to the upside, but not this time…down over 50 handles on report after the close.
400 strike straddle should return a double at 32.20 entry cost per…
WOW!!!!!
Haha! I am looking at the option prices on that beast and YOWZA!
Those spreads are all over the map. I have done a cursory check of the best risk/reward of a few chains and if what we think is going to happen to that insanely leveraged tech sector is even remotely close to what unfolds, a few carefully selected option contracts offer the potential to be 10 baggers. Keep in mind that with vol at stupidly low levels considering the true nature of market risk, particularly in that sector, ten bagger returns could be quite conservative! The criminal malfeasance of the bankster cabal with their insane suppression of implied volatility to recklessly juice the risk/parity trade is going to come back to haunt them with a vengeance. If fact, one could make the argument, and a very cogent one at that, that the most obscene returns anyone is going to see in this market is a long vol trade a year or so out…just set it and forget it! I predict that sometime in the not-too-distant-future those option chains on volatility instruments are going to go missing. Talk about counter-party risk! What interesting times we are living in!
Well,well,well…! They sure are pulling out all the stops trying to prop up Nasdaq. NQ is even more blatant. What you are witnessing is massive market exits being slyly covered by the criminal bankster cabal. They have to spend the billions they are spending. The index is being held up by so few big names that collapse would be instantaneous if they failed to throw money at those components at any sign of weakness. They are ultimately destined to fail, and they know it.
The plan is to game the herd just a bit longer….just a little bit…
I can’t disgree with you there Verne. The prop/pump/fix is so obvious today.
I got absolutely robbed on my NFLX puts. I sold at the open as I knew the BTF Dippers would swarm. The corrupt market makers refused to pay even intrinsic value on those puts. You know they are colluding when the ask is under intrinsic value.
Judging from how they have bid it up, clearly the fix was in! Dangerous markets for the unwary…! 🙂
Some interesting commentary on Nadsaq today. Others are also noticing…! ☺
https://www.zerohedge.com/news/2018-07-17/wtf-chart-day
I was expecting a turn today but I may be wrong on that score. The strong move past the contested DJI 25K and SPX 2800 pivots
has to be viewed as short term bullish. Only a move back below those levels would change that view.
As far as you being wrong abt today, let’s hold off on that.
A possible similar scenario is 9/13/15 solar eclipse & 9/28/15 lunar eclipse.
Swing high 9/17/15 down to 9/29.
For 2018, solar eclipse 7/13/18 & 7/27/18 lunar eclipse.
Let’s see if today is swing high or tomorrow and a similar fade will occur.
Aha! Things could be about to get quite interesting! A few busted wedges being back-tested… 🙂
Adjusted bid on July 25 280 SPY puts to 0.95. Stink bid of 1.20 was not stinky enough it would appear, lol!
Now bid at 1.05. Also have buy stop at 1.20 bid. Do I hear 0.75?! 🙂
Food for thought only.
From my point of view the cash dow has been a B wave rally .
the weekly chart on this link shows how a larger triangle would trace out .
https://imgur.com/zi4DDiH
Very interesting idea Joe. I would imply the new low below Feb was needed to complete the C wave of the initial zig zag down, so avoiding a C wave truncation.
That idea also means we have a ways to go to finish the C wave up of the current zig zag.
After reading most of the zero hedge article in regards to the IMF
there comment was :
Finally, we note that the fund did not directly address what might happen when the US imposes full sanctions and secondary sanctions on Iran in November.
So, what to do with this new information from The IMF? Simple – Buy FAANG Stocks..
The author was actually reporting that this was the view of the idiots over at CNBC…!
I suspect his tongue was firmly placed in cheek… 🙂
Looks to me like we need one more wave up after this sideways meander….will we be done by Friday? I think not….
The waves are starting to look beyond ridiculous. Take NQ for example, the price action yesterday is an absolute absurdity.
The problem with manipulated markets is than one can never be quite sure how and when the fiasco is going to end. Slow rollover? Or should we be expecting yet another cash dump?!
The High on the 19th stil looks OK. Then a decline into Monday til opening Wallstreet. Now a Hughe UP starts into 24th and perhaps futher – I do not know yet.
It looks like ther is no start of a Hughe decline yet.
Indicator 1 has on 27th a DOWN-date. That is the decline in 98% of the cases sofar.
The Low’s for 2th and 10th august stay and the 10th is a LOW because indicator 2b demands it. (only how deep?)
This is not normal! It is exhousting to make the wright predictions for the ending diagonal. So the High 24th of 27th?
http://www.prognoseus500.nl/
Be careful
Yep. Clearly no reversal so far. What we have seen is price consolidation ahead of moves higher. We still have steep momentum divergences at recent Nasdaq highs. The PPT is working overtime…!
Frankly folk, looks like a bull pennant to me in ES. It seems we could be headed higher. If that is indeed the case, the ED pattern may run into a problem due to the size of wave 3.
Of course it could morph into an impulse down but from where I sit, that just ain’t happening…!
Reversal impulses are usually sharp and unmistakable. Meandering tends to simply bring more uwards price action.
Oh well, Mr Market will do as he sees fit…
Price in ES attempting to break below pennant lower boundary…will it?
Yep!
This is nuts! Look at that ES 15 minute candle.
The instant price broke lower they dumped a huge wad of cash. Look at that shadow!
How the hell is anyone supposed to trade this freaking market with all this cabal meddling??!!
Price moved higher after the bull flag. Target is now 2840.00
Bid/ask spreads on VIX call options are absurd ( 0.55/1.95 for 12 strike calls). The good news is this is generally a reliable sign of turbulence ahead. We had what looked like a break higher from a bull flag yesterday but futures may be telling another tale. You simply cannot take anything for granted in this dicey market. Glad I attended the Chart Show yesterday.
In my trading experience, important changes of trend announce their arrival by demolishing prior support pivots on the first impulse down. It is one of the most powerful of evidences that you indeed have a genuine change of trend. On the contrary, when there is hesitation of meandering around such previously contested pivots that is almost always a dead give away the the move down is merely corrective, and that the uptrend is destined to continue. The line in the sand for me were the twin pivots of DJI 25K and SPX 2800, and in my humble opinion, the failure of the move down to take out those levels strongly suggests to me that we are not quite there yet. If those pivots remain intact into the close, I think it severely weakens the near term bearish case. Just my two cents.
Volume profile today supports downward movement. We should get confirmation of a completed third with a CLOSE below 2800 tomorrow. I have the truck backed up just in case. Best of luck to everyone and thanks again to Peter for his expert guidance!
tks. Yeah, tomorrow, I hope.
Talk about a CRAZY market!
I was certain, after seeing the overnight dive in futures, that we would take out those pivots with a gap down.
The banksters are alive and well. Those pivots appear to be VERY important.
Possible 5 waves down in dollar futures. The second wave is a lil short and the fifth wave may be in the process of an extension, but I think the top is in. There’s been a strong correlation between Trump’s popularity and the dollar. Not suggesting there is necessarily a correlation between the two, they share the same common root: social spirit, and recently confidence in Trump, per Predictit.org’s market, has taken a turn south.
The ironic thing is Trump rode the wave of dollar confidence into the White House and is signalling he is concerned with its strength.
To the extent that market signals can be trusted, the sharp reversal off this morning’s lows and resulting hammer has to be viewed as short term bullish. I felt foolish for selling my VIX calls yesterday after the pivots held when I saw futures tanking. Now not so much. I have no idea where we could possibly be in the wave count. I expected a fourth wave to make a bee-line for the ED lower trendline and it does not look like that’s going to happen now with that hammer in place.
Since you get to ask one question from the Chart Show, the answer is that we had the fourth wave of the ED bottom this morning. If you remember, I was concerned about the third wave being in 5 waves, with good reason. That made it the A wave of the third (ABC). The short story is that it puts us in the fifth now.
Thanks Peter! That is what I was thinking but thought I had to be wrong as it seemed quite shallow! 🙂
Took another look and the fourth wave is indeed in the territory of the first. At first glance it did not appear to be but when you measure it definitely is.
We also now know exactly how high the fifth wave may go to complete the ED.
Wow!
Looking forward to the next chart show!
Have a great weekend everyone!
A new weekend post is live at: https://worldcyclesinstitute.com/the-influence-of-the-moon/
This website is for educational purposes relating to Elliott Wave, natural cycles, and the Quantum Revolution (Great Awakening). I welcome questions or comments about any of these subjects. Due to a heavy schedule, I may not have the time to answer questions that relate to my area of expertise.
I reserve the right to remove any comment that is deemed negative, is unhelpful, or off-topic. Such comments may be removed.
Want to comment? You need to be logged in to comment. You can register here.