We’ve now completed the first wave down in all the US indices. I’ll post two of them here today. The short story is that we have to retrace 62% (the horizontal line at about 2110) before reversing down into a third wave.
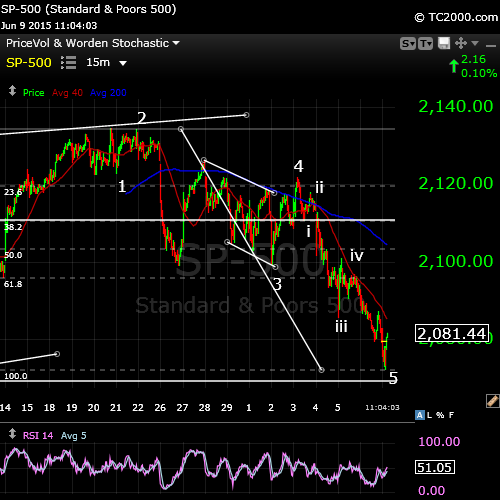 The third wave of the SP (above) completed an ending diagonal, which made it a little difficult to decipher on the way down.
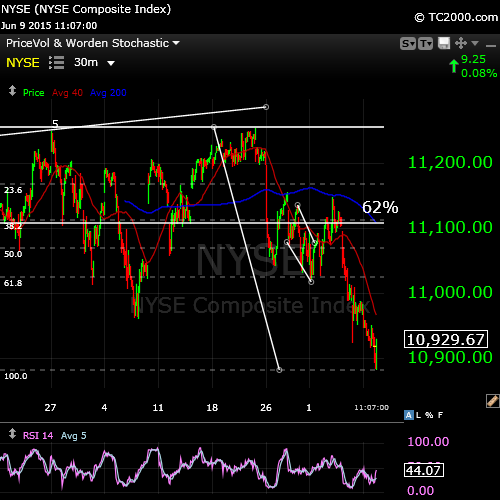
The NYSE above sports the same count. I’ve drawn the target retrace line at 62%. Wave down, when it comes (give it a couple of days) should be at least 1.6 times the full length of wave 1. On the SP500, the end of the third wave down should come in at least $2010.00
Addition for June 12 based on a comment below.
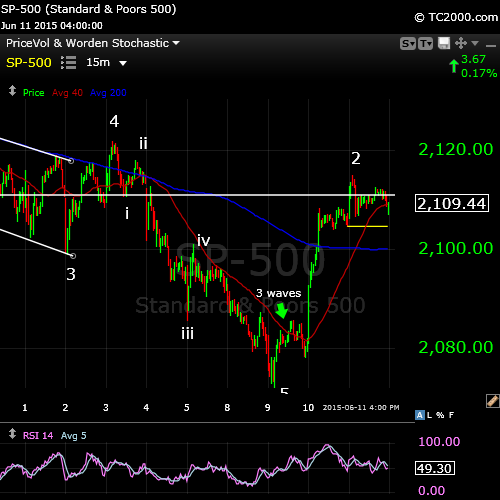
The wave up starting on June 10 is a corrective wave, based upon the first wave of the sequence being a “3,” which I’ve marked on the chart. In Elliott wave, each of the waves in an impulsive sequence must be “5’s.” Therefore, I have labelled this latest wave number 2. It has retraced 62% (the horizontal line). Based on my count, I’m expected us to head down in wave 3.
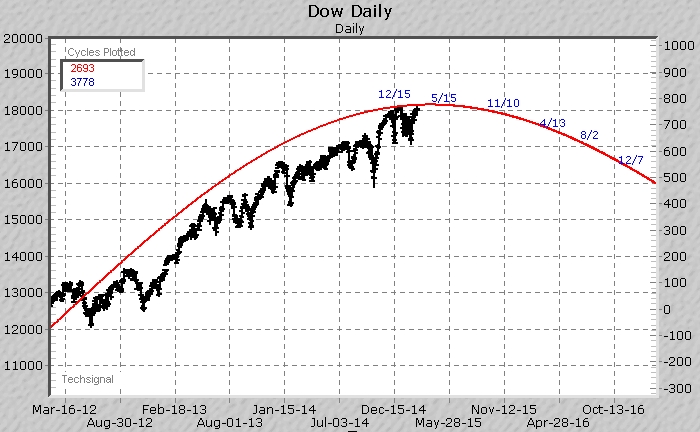
Above is the long-term DOW cycles analysis using Edward Dewey’s original algorithms, posted in early 2012. It predicted the top of the DOW around May 15, 2012.
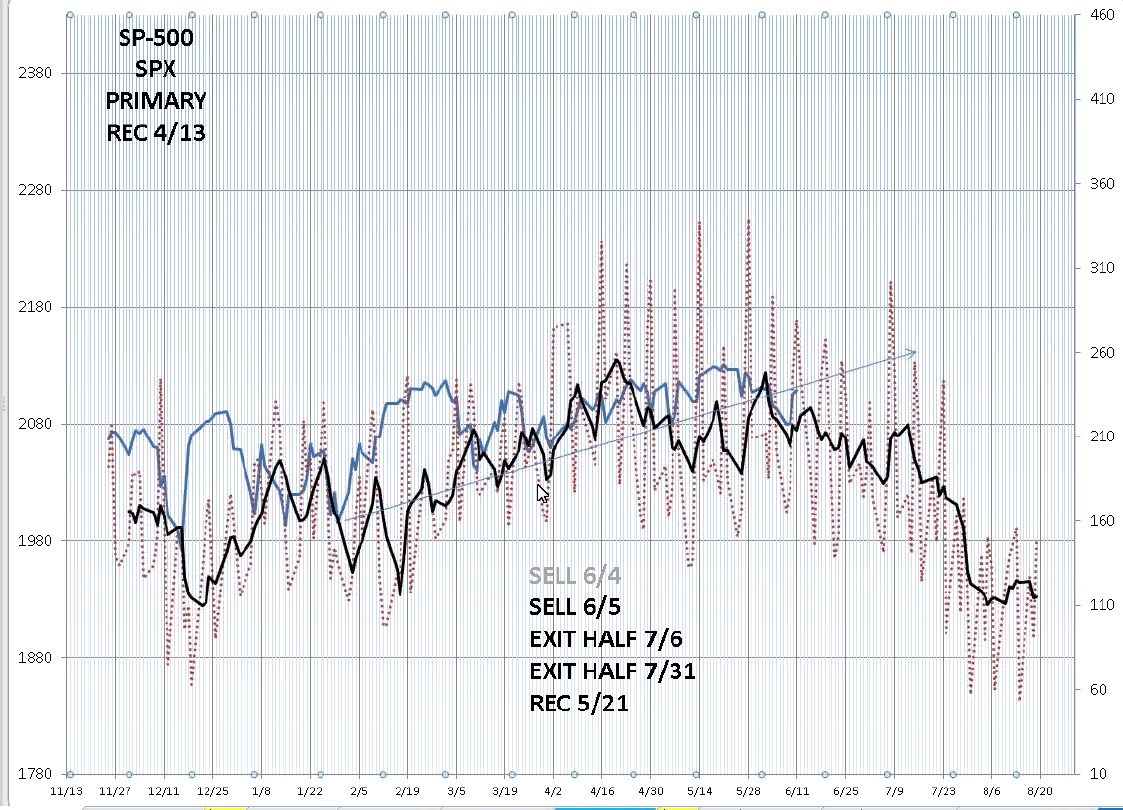
Since I’ve mentioned it in the comment below, above is the planetary prediction of the movement of the SP500. We’re expecting the SP500 to head down into early August before a major bounce.


I believe there needs to be more education on your EWT. Don’t force a count and do not try to quickly finish a count. There are 21 different possibilities of patterns and so these are not very good odds, but one can use the characteristics regardless of count to know the two most important things. Corrective or Impulsive. To me this is much more important of a take away from EWT.
Thanks for your comment.
Of course, I strongly disagree (this gives me a chance to make a few points that I don’t get to make in the blog posts) for these reasons:
Now, if I’m wrong, you can crap all over me, but that has yet to be proven!
Thanks for the reply Peter. I believe your analysis of a top and cycles are great and I’m not here to criticize your work. I think blogs are important and are great of you and everyone for sharing and educating those who are seeking answers.
But as someone who have studied EW. I have seen holes in this theory, even from EWI themselves. The fact there are different patterns in combinations decreases the chance of getting the right count. These are just plain odds. I’m not saying EW is not useful, and I am not saying that your EW analysis is subpar. But from my view of the 1st chart above, I just think it’s not proportioned. I could be wrong, but I always have this in mind. Other than that, I think you have written good articles. Im not here to bust anyone’s nut.
I gave up on the EWI folks a long, long time ago. I have very little time for technical analysts who are not traders. They have no skin in the game.
I like Bob, but as he’s told me himself, he’s not a trader. But I the utmost respect for his work, both in Elliott waves and Socionomics. His underlings, however, don’t seem to be able to count.
You’re not the first one to tell me you don’t understand first waves and the configuration or wave lengths. The EWI people don’t either—they always get them wrong. They’re easily mistaken for a countertrend wave.