
 My theme for last weekend had to do with the options that were available to complete this fourth wave. That hasn’t changed. In fact, the options have become more complicated.
We could either be tracing out a single large flat pattern, or we could be getting ready to trace out the second pattern of a fourth wave combination pattern.
Hence this title for this week: Locking in the Combination (or not). There are several options for the completion of this fourth wave.
- There are also two possibilities for the flat, one far less probable than the other.
- There are three possible patterns for the second pattern of a combination, one more probably than the others.
It’s complicated, so let me deal with one at a time.
Option 1: A Single Fourth Wave Flat
The most probable pattern tracing out in both ES and the SP500 seems to me to be a regular flat. Here’s an description of the traits of a flat (from the Elliott Wave Principle):
“A flat correction usually retraces less of the proceeding impulse waves than does a zigzag. It tends to occur when the larger trend is strong, so it virtually always precedes or follows an extension. The more powerful the underlying trend, the briefer the flat tends to be. Within an impulse, the fourth way frequently sports of flat while the second wave rarely does.”
In both ES and the SP500, the preceding wave up was an extended wave, so the fit here is quite good.
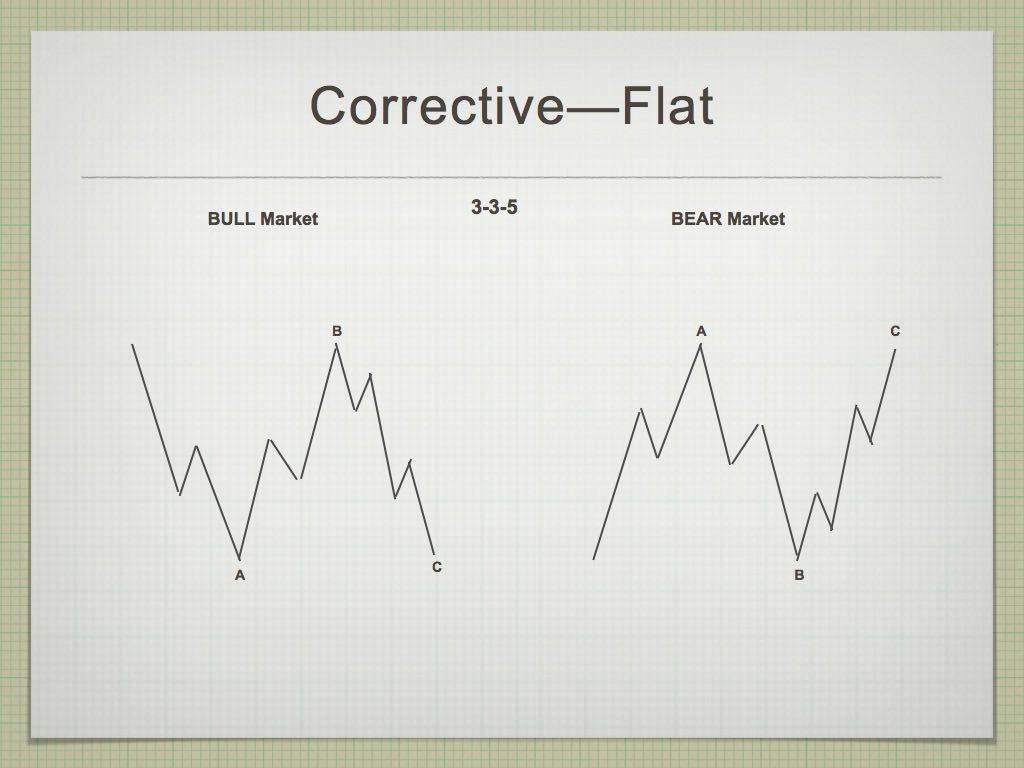 Above is a chart showing a very simple drawing of a regular flat. Think about the large fourth wave in ES that we’ve been tracing out since January 29. The BULL Market wave on the left in the chart relates to the possible pattern we have unfolding.
The first set of waves down from the 2875 area was in three waves (a zigzag). This is the A wave of the flat.
The wave up from about 2530 is also in three waves. This is the B wave of the flat, but as they usually retrace up to the start of the A wave (in this case, close to a new high). They can also retrace right to the start of wave A (but not to a new high). then the C wave turns down to a new low below the bottom of the A wave. Wave C will trace out five waves for a complete pattern (3-3-5).
An expanded flat, which is less probable in this case, would see the B wave rally to a new high before turning and going to a new low (NQ has a higher probability of tracing out an expanded flat than does ES).
Option 2: The Second Pattern of a Combination
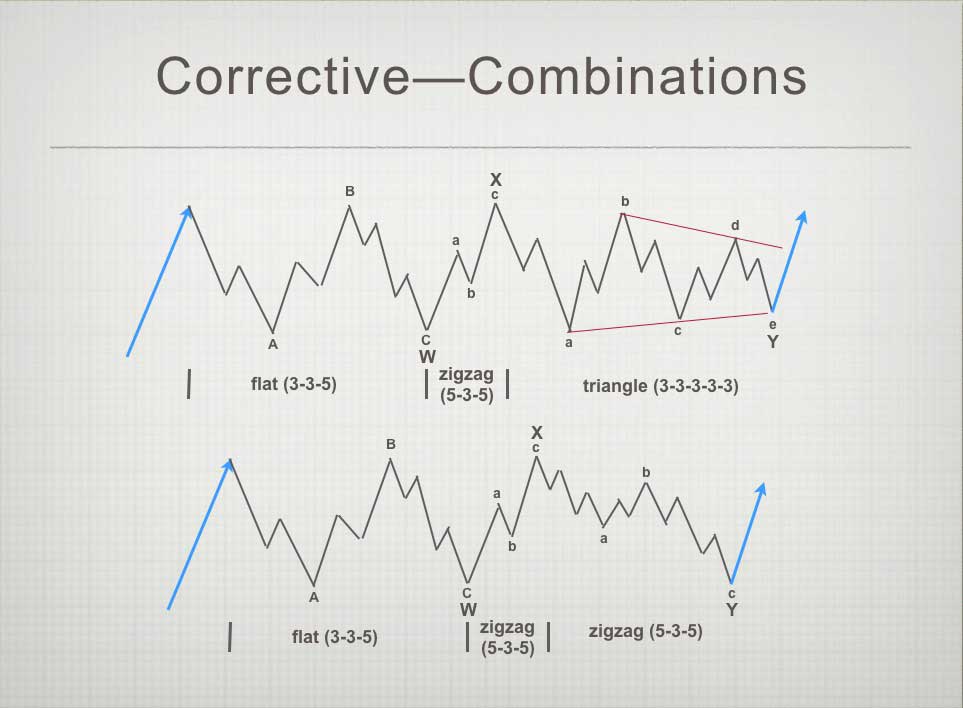
Above is a chart showing combinations and the pattern options that can be contained within them. The two combination patterns above are each called “triple threes.” That’s because each corrective pattern (a flat, zigzag, or triangle) are always in a 3 waves and there are three patterns in each of the waves above.
Combination waves also can contain only two patterns, called a “double three” (a flat and a zigzag, for example). If a triangle is one of the patterns in a combination wave, it’s always the final pattern.
For example, a flat is 3 waves (3-3-5), a zigzag is 3 waves (5-3-5), and a triangle (3-3-3-3-3) is counted in three waves, even thought there are 5 waves (each wave in three subwaves). I know, all very complicated. But as you study Elliott waves and see these patterns over and over again, they begin to make more sense the more you see them play out.
The waves above are horizontal in direction, but in real life, they would either slope up or down, depending in whether we’re in a bull or bear market.
So far in this large fourth wave correction (down from January 30), we’ve completed one pattern, a zigzag. an expanded flat (there are three types of flats). Flats are are 3-3-5 combination. If we get another pattern in a combination, I would expect a turn down at 2760. This could lead to a zigzag or a contracting triangle. A flat as a second pattern of a combination wave at this point, is low probability (for reasons I explain in the video).
Summary: The most probably outcome is for a regular flat, which would mean a rally this weekend and then a sudden turn down in five waves to a new low. The less probable alternative is a second corrective pattern that would likely begin near the 2760 level with a turn down.
Registration for Commenting
Want to comment? You need to be logged in to comment. You can register here.
If you register, it protects your information. It also allows you to comment without filling in your information each time. Once you’re registered, simply go to the home page and click on the login link top right in order to log yourself in. Usually, you’ll be logged in for several days before needing to be logged in again.
______________________________
Problem receiving blog comment emails? Try whitelisting the address. More info.
______________________________
Have not had a losing week RW 2
Have not had a losing week …I have been with Peter almost a year. The only thing that matters is have I made money with his service. I think I have finally turned the corner using Peter’s EW. I have not had a losing week in the last 5 months. Thanks Peter, for your amazing amount of hard work. —RW |
Tops in your field DZ 2
Tops in your field …You are tops in your field. Tried to follow Elliot Wave international for years. They were always behind the market. After discovering you, I perceive that you are an expert in reading the waves, which puts you way ahead of the rest of your peers. And you can read the Waves like you are reading tomorrow’s financial section. I pray you stay healthy. —DZ |
Rise above the rest … SM 2
Rise above the rest …I have only ever met a few people who, in their chosen fields (astrology, medicine, music, martial arts, technical analysis), rise above all the rest and you are one of them…you have ‘the gift’…and that’s why I’m a Trader’s Gold member. —SM |
A true expert in Elliott Wave FL 2
A true expert in Elliott Wave …You are a true expert in EW analysis. What you provide is not available anywhere and is priceless. Subscription on your services is the best thing I have ever done. Many thanks for your effort to make me a better investor. I now have more trust in my investment decisions. I hope you will continue the excellent work! —FL |
Couldn’t be happier … KK 2
Couldn’t be happier …The analysis and insight you provide is simply amazing! I’ve been trading the futures and equity markets for well over thirty years and usually average around 5% monthly. Since joining your Traders Gold Service two months ago, that number has better than doubled. I couldn’t be happier.—KK |
Get an upper hand … JC 2
Get an upper hand in trading …Seeing all the different currency pairs and the wave structures and hearing you explain why this has to do that on a nightly bases gives one a upper hand when trading. Elliott Wave applies to all stock and indices and can be applied to any candlestick chart. If someone ask what you want for Christmas – Tell them a membership to Peter’s “Traders Gold!”—JC |
the real deal SM 2
The real deal …‘Educational, insightful and thorough market analysis for all levels of traders. It’s Elliott Wave at its best….Peter Temple is the real deal’ —SM |
The best of them JL 2
The best of them …Last couple of years, I subscribed to several ‘market traders’. You are by far the best of them and the personal contact is awesome. Daily and daily updates are very well written! Besides your expertise in EW, I also like your cycles analysis. Best investment I ever made! —JL |
The Market This Week
Here's the latest daily chart of ES (emini futures)
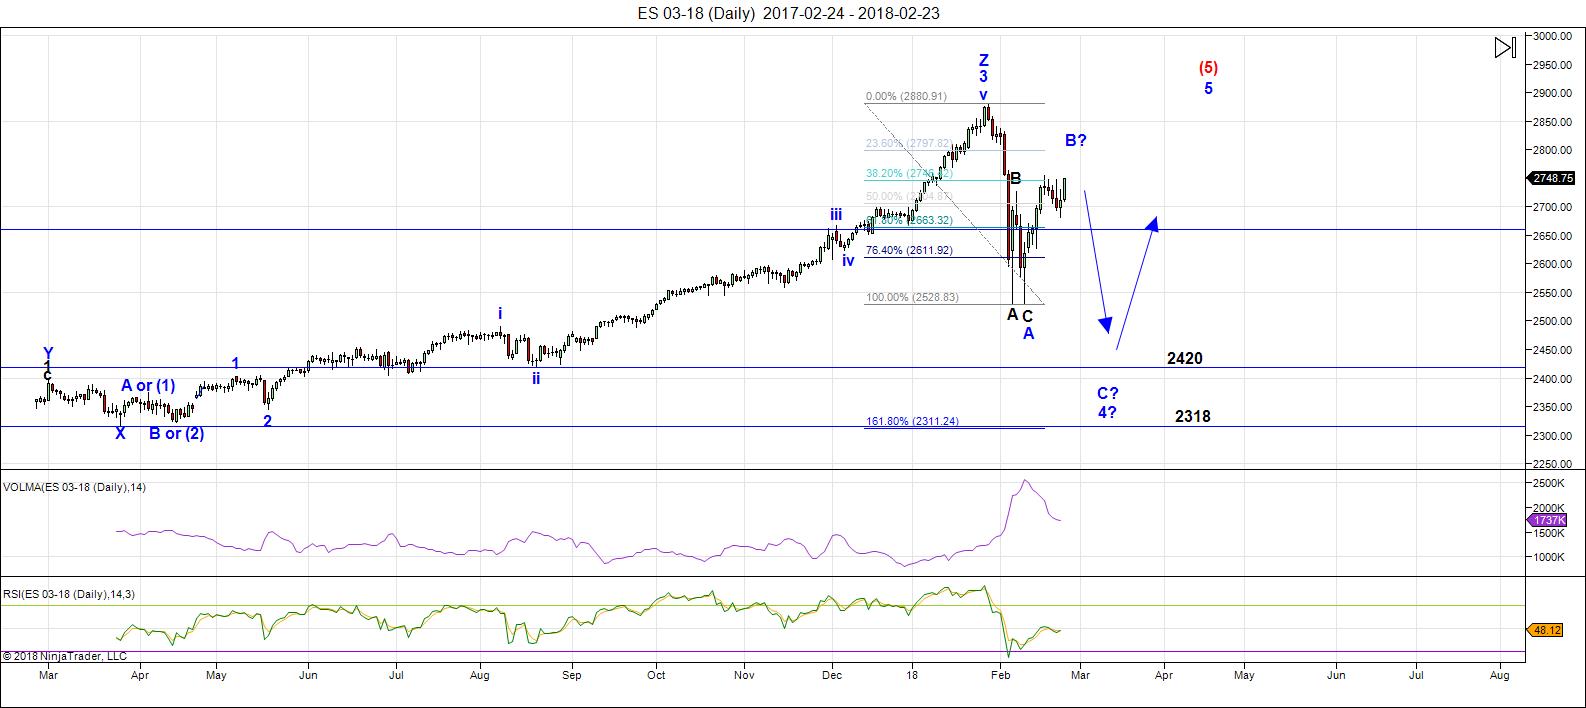 Above is the daily chart of ES (click to enlarge, as with any of my charts).
You can see on this chart that the most recent wave up (blue B) is an ABC wave (three waves), and in fact, if the current wave rises further over the weekend, the entire pattern right from the all time high, will be set up as a regular flat. That would point to a new low, but often with a flat, the actual stopping point won't hit either one of my targets exactly.
There's an option of a very large expanded flat as well, but this would require a new high and then a reversal (NQ in fact, may complete this version, as it's much closer to a new high than ES).
If we have a combination wave in the works, we could head down and trace out a second pattern, either a triangle or a zigzag (a flat as a second pattern seems a very low probability). What happens Sunday and into Monday will determine the pattern that's the most probable. In other words, where the current B wave tops will give us a better clue of what we have on our hands.
Volume: It remains high, as expected.
Summary: We're looking for another turn down into a C wave of the fourth wave. There are options as to how it happens, either as the C wave of a large flat, or a second pattern of a combination pattern (a smaller, regular flat, a triangle pattern, or another set of zigzags). We'll look for a continuation up this weekend with a turn possibly Monday to the downside.
___________________________
Trader's Gold Subscribers get a comprehensive view of the market, including hourly (and even smaller timeframes, when appropriate) on a daily basis. They also receive updates through the comments area. I provide only the daily timeframe for the free blog, as a "snapshot" of where the market currently trades and the next move on a weekly basis.
______________________________________
Sign up for: The Chart Show
Next Date: Thursday, March 1 at 1:00 pm EST (US market time)

The Chart Show is a one hour webinar in which Peter Temple provides the Elliott Wave analysis in real time for the US market, gold, silver, oil, major USD currency pairs, and more. You won't find a more accurate or comprehensive market prediction anywhere for this price.
Get caught up on the market from an Elliott Wave perspective. You’ll also get Andy Pancholi cycle turn dates for the SP500 for the balance of the current month. There’ll be a Q&A session during and at the end of the webinar and the possibility (depending on time) of taking requests.
All registrants will receive the video playback of the webinar, so even if you miss it, you’ll be sent the full video replay within about an hour of its conclusion. For more information and to sign up, click here.


Yes indeed. Analysis that knows what it’s talking ’bout! 🙂
Thank you for the update!
tks
It is going ti be an inteteresting week…we have a rare gap open in futures…
Futures confirming continued upward movement as called for by Peter T’s EW analysis of a possible flat unfolding, as well as the other options. In the case of a flat, we also know HOW high it MUST go minimally. This is trade-able information.
https://invst.ly/6rche – wide view ES
https://invst.ly/6rd5d – close up and personal
getting close to potentially S&P roaring back to ATHs again which would be a super bummer
I am starting to understand the frustration Peter T used to express about the attitude toward the information he provides on the website. I am not saying everyone has to agree with his analysis, what I am saying is that it is really amazing how some folk have to ability to ignore facts no matter how clearly and cogently they are presented. Porter Stansberry often states that there is no teaching, only LEARNING, and I think he is onto something! 🙂
I m still looking for a top today or tomorrow based on my astro indicator.
a pullback till March 5 or 7.
Lets see and wait what is in the cards.
A regular flat must reach 2838.85. There is no reason it could not achieve that target by tomorrow. Regardless of how long it takes, that remains one EW target for upward movement…
For many reasons, the move up likely to be a “C” wave.
with the greatest of respect verne,
look at the AO below……….negatively diverge………from prices above…………..
i have never seen a “C” wave with this type of divergence pattern………….
https://invst.ly/6rg7
it looks to mine eyes like one big “pennant” pattern playing out……
here yo go luri. almost there. 2788. took 10 days. https://worldcyclesinstitute.com/the-big-top-fake-out/#comment-28050
liz,
you were indeed correct!
:-))
I have been using BTC-/ES 3-4 hr chart as possible fractal. If one uses day counting alone from btc 12/17/17 high and 1/26/18 /es high, today is equivalent of 1/6/18.
ok liz,
yes i see what you are looking at!!! i was using a modified “ashi” candle which as you know i a “mean” candle which smooths out the noise…..
i converted the chart back to regular candles, and now i can see exactly what you have been saying…………………
https://invst.ly/6rhrn
sorry liz,
posted the daily time frame for bit.
here is the 4 hour time frame………..https://invst.ly/6rht-
Price has gone beyond what I would expect for an unfolding triangle.
The two recent gaps are frankly also quite bullish, and I can’t dismiss those counting an impulse up, although I still think the move is corrective. I base my conclusion on the momentum. These kinds of moves are generally third or C waves.
Hi Liz,
What is your date for a new (lower) low for ES in the analogie with BTC?
Hello John, based on day counting alone, hypo: date format is in mm/dd/yy
BTC 1/11/18 low == /ES 3/5 then
bounce to 3/7 then down to 3/12-13.
Bounce to 3/16 then
BTC 2/2/18 low == 4/5/18.
Bitstamp BTC 2/6/18 low 5920 == 4/11/18.
Rotrot, if I recall correctly, pls. correct me if I’m wrong, points to March 7 as an important high though.
https://twitter.com/grimweasel47/status/968126064475213824
Thanks liz,
So far so good…. will it be the BTC crash or the 1987 one, Personally I believe in the BTC…
It is also possible that we drop hard into the full moon March 2.
“March 9-12 could well be a high of some significance…”
rotrot | February 23, 2018
https://worldcyclesinstitute.com/options-at-the-top-2/comment-page-1/#comment-28215
“The next 5-10 days could be the most important in 2018. Markets continue to follow our 1 minute 1987 Maps into a major inflection point before either a crash or a final blowout.”
Ed Matts | February 26, 2018
Thanks rotrot. March 12-13 I see it as a swing low based on another indicator. May be a day forming a bearish engulfing candle with a reflexive bounce into opex the next day.
Notable anniversaries:
https://www.wired.com/2010/03/0310nasdaq-bust/
https://www.forbes.com/2010/03/06/march-bear-market-low-personal-finance-march-2009.html#740275663a13
the original pattern is no longer valid…January 26 was ‘the high’ followed by a February 9 low…February 27 was a high…March 9 could well be a low…
Many people are looking at Bitcoin and made the case for the pattern to repeat on the spy but very few have broken it down in the way Liz has I commend her hard work and thanks for sharing.
Given where we are right now I have to think that both the dow/s&p are highly likely to retrace towards circa 23,700 dow and s&p 2585 zone
I say this based on pattern the Nasdaq may just create a higher high tomorrow and the day after will be telling but as many have said and those who are more skilled than I at timing these markets it looks like the next leg down in upon us tomorrow or very soon.
Strange thing is should the NASDAQ make a new all time high I would actually expect that to make a lower low, this will also make the case for a deeper retrace on the dow/s&p than I have noted above but I do not expect lower lows on those two indexes.(This could change but not currently imo)
Once this takes place the run into APRIL/MAY should be huge to the upside before Luri’s call for total devastation is upon us.
“when I look at price analogs to the current environment there’s another one that is a bit more compelling than 1987 and that is the two years leading up to the epic 1990 Nikkei peak. According to Nautilus Research’s analog engine there is a 98% correlation between it and the past two years in the S&P 500. The chart below plots the S&P 500 (in black) against the Japanese Nikkei (in red) over that span.”
Jesse Felder | February 15, 2018
https://thefelderreport.com/wp-content/uploads/2018/02/MrUrJtn6.png
Thanks Rotrot appreciated bud!
Rotrot that does indeed have some great similarities but what about today and last Fridays action? Surely that must have negated the correlation?
Just an observation
Thanks again
“So far this year we’ve seen elevated insider selling but not yet full on panic dumping. We’ll see that in at least 2 of the next 6 weeks (probably 3)”
Greedometer | February 26, 2018
Peter G,
Thank you for responding on the A/D line question from over this past weekend. I have
been out of town.
SVXY & UVXY…sign of things to come?
https://worldcyclesinstitute.com/way-too-much-bull/comment-page-2/#comment-27477
http://www.proshares.com/news/proshare_capital_management_llc_plans_to_reduce_target_exposure_on_two_etfs.html
this STILL looks like a “massive” bearish pennant formation from the outer reaches of our known universe…..
as you know……….a pennant is a “continuation” pattern………………..so a bearish pennant is a continuation to the downside……………….
now i know what …………….y’all…………are thinkin’ right about now…………that i should “refrain” from ………………wearing neon orange sport socks with khaki’s…..
and that………………….”truth telling”……………..is “uncool”………………….so as goes google owned youtube…………which is “terminating” the accounts of great journalists – [like richie allen] ……..for daring to ask the hard journalist questions….. so goes my “neon orange sport socks”…………..!!!
censorship!!!!!! https://invst.ly/6rpbc
DID YOU KNOW THAT GOOGLE’S ENTIRE WORLDWIDE YEARLY PROFIT IS DIRECTED TO “ONE” PLACE – to a P.O. BOX IN BERMUDA. THE P.O.B IS NUMBERED #666………………………………………..
February 25/26/27, 2018…just an observation…
https://pbs.twimg.com/media/DSxUIY6XcAA7Xqs.jpg
http://www.stockindextimer.com/page78.html
https://www.rosecast.com/bradley-2017/
Rotrot,
Whats your thinking regarding the pbs.twimg and the rosecast having essentially the same pattern? Would you agree?
Jeff T
this ……….BE…………..why we drop hard in equities…………………………
its the debt !…………………….. and the lying and stealing and cheating [although that is best discussed at a future moment of time.]
https://invst.ly/6ru7x
yes…..I KNOW…………..”rules”…..this….and……………”rules” that……
rules reek of sulfur……. [oh and an insider note – that is the name of the new, new perfume being developed by H. Clinton – “SULPHUR”]
i need ………………………………””UNRULES””………………………freedom……. unrules to chart within a master/slave system of sulfur smelly “rules”…………………… https://invst.ly/6ruhe
hey liz,
i have a question as per the …………..”amazing”………………work you have done to extrapolate the BTC to SPX fractal that is in play.
you have the “dates”/time function count…..but……………………what about the scale?? how do you……………or do you?………………………deal with the scale drop of BTC as it effects the SPX fractal??? what is your expectations……?
Luri, sorry no scale. Maybe you can figure it out? There’s a difference with BTC though. 401k semi-monthly contributions don’t flow into BTC lol.
So, one step at a time, 50sma, 20sma, 100sma.
Will /es 2722 hold, 2712, 2695, 2650? Feb. 12 low 2622 will it hold?
liz,
…………………this is …………..”ME”…………….you speakth to “me”…………when have you known me to take…..”one step at a time”………. :-))
as for 401k……………..how much of that qualified money has been “borrowed” against?????…………………and then the non qualified money……how about the 700 plus billion in loans against equity accounts………………………………..and of course there is the 200 times leverage used in a one way long equity /short vol trade.
my elevator shaft charting……..seems to think the ratio equivalent is a move to 1600 ish?? hmmm….. we shall see
That will wipe out potus’ entire gain lol. March 2009 trendline must hold.
i have reintroduced the “elevator” shaft. the elevator shaft has always been there………………………..watch yer step!…………………………………………….
too much? perhaps……………………https://invst.ly/6rvwn
vertical blue line reference indicates a move to the 1600’s?????? huh??? or the 3.618 extension of A????https://invst.ly/6rw0z
CELG gapping down on bad news. It happened last October too.
/ES swing low 3 TDs later.
This is not a prediction. It is a reminder of the research by Steve Puetz (pronounced Pitts) on market crashes. 1)Lunar eclipses or full moons one cycle away from a lunar eclipse were always coincident to the beginning of the famous market crashes. 2) The full moon coincident to the beginning of the crash has always been within 6 weeks of a solar eclipse. 3) The “panic phases” of all 12 crashes studied were entirely encompassed within one of the following periods: a) February 4- April 5, b) September 3- October 29. Salient accompanying facts: Jan 31-Total Lunar eclipse. February 15-Solar eclipse. Next full moon (within one cycle of lunar eclipse full moon and within 6 weeks of solar eclipse): March 1, 7:51 pm Eastern Time, i.e this Thursday evening… Puetz never claimed these conditions caused crashes. His claim was that all crashes he studied were accompanied by the above conditions.
The stong sell-off yesterday I think eliminates the flat. A large zig zag or triangle is still in play. Considering Peter G’s most interesting post above, one cannot dismiss the possibility of nested first and second waves, an ominous prospect indeed!
morning verne,
……….and where were you yesterday young man??? hmmmmm???
care to share with the class………………….your exact “whereabouts”?
[verne we here at the forum………we all know about your addiction to “gummy bears”………..strung out on 5 pounds of liquefied inverted gmo corn fructose sugar-sugar……………………” again?”]
at any rate………….good to have you back on board……
now…………………..”class”………………………….. repeat after me – lets kick some butt……
and create a REVOLUTION!
https://invst.ly/6s5bf
Why would the flat be eliminated? Wouldn’t the C wave match the intensity of the A wave down? That is a bit of what we had on a larger degree from May 2015- February 2016 right?
I guess since it didn’t get close enough to the top would make sense for SPX, though for QQQ i would say it was a flat.
Yep. I was talking about SPX.
A few more snippets from Puetz’s crash research…again, this is not a prediction…
Once the panic starts, Puetz notes, it generally lasts from two to four weeks. The tendency has been for the markets to peak a few days ahead of the full moon, move flat to slightly lower —waiting for the full moon to pass. Then on the day of the full moon or slightly after, the brunt of the crash hits the marketplace.
Lots of bulls with long faces tonight. They could not even get a bounce at 50 day…
All looks setup for this market to take a massive hit here. US $ has broken out, SP has retraced and now is breaking down and the astros have lined up. High probability here to go short. As well as the QQQ making close to a double top. Pete T is there anyway re EW that we don’t get back up to make a new high. In saying that it all looks to obvious so we will probably blast straight up.
peter G…….”rocks”…………….!!! thank you for sharing information of the” puetz.”
Monthlies time……… now sit a breathe………………….in and out…………..ok……now look!
DXY daily – https://invst.ly/6sahw [blue projection lines laid down 1/24/18 still in play]
DXY weekly – https://invst.ly/6safo
Bitcoin – https://invst.ly/6sak8 [blue projection lines laid down 2/6/2018 still in play] looking to retest lows, and wedge trendline.
Liz’s Overlay – https://invst.ly/6savu
ES 60 minute – https://invst.ly/6sal3 [fib projection for wave C to either 2300 or 1900] [elevator shaft/liz’s overlay projection for wave C to 1600ish – give or take a fendi bag!]
VVix monthly – https://invst.ly/6sau4 ……y’all should remember this chart [look to the target zone for march]
RUT futures – https://invst.ly/6sayh……………target based on megaphone patterns 823
DAX – https://invst.ly/6saz7………………………….target 6300ish, give or take some jimmy choo’s!
and peoples………………………………”BE WARNED”!!!
Could you find some more links? haha. When you put in more than three, the system flags it an puts you in jail. You cannot pass go until I let you out … 🙂
thank you for releasing me unto my freedom peter………..
i shall try to avoid prison in the future…………………its all this heavy cocaine use!!! :-))
there is some run off on the two reference for charts…
here they are again
RUT futures https://invst.ly/6sayh
DAX https://invst.ly/6saz7
But does she collect 200??!! 🙂
Luri…ummm… hello… where did you get that 1600 target?
12/17/2017 bitstamp BTC high = 19666
12/22/2017 BTC low = 11159.93
1.618 retrace from 19666 = 5903
Bitstamp BTC 2/6/18 low 5920.72
/ES high = 2878.5
2/5/18 11:30 pm low = 2529
1.618 retrace from 2878.5 = 2313 (March 2017 low 2317.75)
Pls. look at Peter’s targets above. Magic!
Feel free to enlighten me.
Peter G,
Very interesting and much appreciated post. I grabbed a calendar and marked the lunar and solar eclipses of January and February…and then marked the next 6 weeks.
Curious if the March 31st “Full Moon” could play into this? Only because there happens to be two full moons in this particular month of March which is somewhat of a rare occurrence. Thanks again for sharing this insight.
How’s this for a truly rare occurrence, Ed?…In the past 100 years, there have only been 3 or 4 months in which there was no full moon for a full calendar month. Obviously, because the lunar cycle is ~ 28.6 days, they would all have to be Februarys, so indeed they are: 1934, 1961, 1999, and now 2018. 1980 partially qualifies but only in some parts of the world, and that’s why I said 3 or 4. Going back to 1900, there was one other, 1915… How did this or could this affect markets, if at all? Sorry, I have no answer for that… 🙂
Another very inteteresting observation about futures is that of late they have not been giving much indication of what will transpire in the cash session. How long before panic starts to be reflected there I wonder…?
Peter G,
I have been investing for 45+ years and I only became aware of Steve Puetz over the past 20 to 25 years. Do you happen to know when was the last successful identification of this phenomenon? At nearly 70… I would like to actually experience one rather than read about it. Ha
I smiled when I read your comment, Ed, because I have had virtually the same experience. That’s why we always need to repeat the disclaimers!! To the best of my recollection, there actually was a crash in one of the Asian markets that followed the Puetz scenario to a T, either in the late ’90s or the early ’00s. True crashes are such rare phenomena that it is somewhat foolhardy to attempt to predict them, but I’ll be damned if I won’t keep looking for the signs that might predict the next one.
Thanks Peter,
I remember this crash very well,
https://en.wikipedia.org/wiki/October_27,_1997,_mini-crash
https://kalender-365.de/lunar-calendar.php?yy=1997
I remember this day very well, because an astrologer told me in Aug 1997 that there will be a crash in the markets on Okt 27, so I bought put options on the AEX index , that day the indexes fell around 10 %, If we start counting the days in Okt 1997 after the full moon we have 11 days.
The analogy would bring us down on March 13.
The same date (12 or 13 March) Liz came up with the BTC analogy. ( and 1+1) lol…
Liz,
i tried to make the bitcoin to spx overlay as “apples” to “apples” as possible – which is why i kept asking you about scaling issues…….
here are the “back of the napkin” rounded numbers i used to get my “scaling” correct and the 1600’ish number of the spx
bitcoin starting point is 0 [rounded – it was .0001 to begin with] it goes to 20000
so we have a difference of [ 20,000 – 0 = 20,000]
same time period the spx starting point was 666 and goes to 2900 [rounded]
so we have a difference of [2900 – 666 = 2234]
so a quick visual show that the scale is “roughly” around 10 to 1 ratio [ratio rounded up slightly for easy math]
so apples to apples calculations would need to incorporate this ratio.
so the lower high in bitcoin from the chart produced was 17, 252 and goes to 6000. so we get a point move of [17, 252 – 6, 000 = 11,252]
so to compare to the spx, we take that difference of bitcoin of 11,252 and divide by the rounded ratio of 10. this give us [11 252/10 = 1125]
so the spx must drop by 1125 spx points to compare with the bitcoin drop.
the secondary high [the one you called “short squeeze” perfectly to 2788]
so the spx must drop 1125 from the 2788 level to compare to the bitcoin drop.
2788 – 1125 = 1663…………………which is why in the projection claims above i projected 1600″ish”…………………………. this was liz overlay calculation was confirmed to me by the elevator shaft channel i drew, which i also showed in chart form in detail previously, and which gives the same result. i cut and pasted it below for reference………………………………………………………
*****************************************************************
“luri ”
February 27, 2018, 3:02 pm
i have reintroduced the “elevator” shaft. the elevator shaft has always been there………………………..watch yer step!…………………………………………….
too much? perhaps……………………https://invst.ly/6rvwn
vertical blue line reference indicates a move to the 1600’s?????? huh??? or the 3.618 extension of A???? https://invst.ly/6rw0z
“Who is the man,that would risk his life for his brother man?”
“SHAFT!!!”
Sorry Mr. Hayes…. 🙂
……………………’can ya dig it’?????…………………………”shaft”……………….”SHAAAFT”!!
i love that song verne!!!!………………
🙂
Who’s the cat that won’t cop out
When there’s danger all about?
SHAFT!! Right on
They say this cat Shaft is a baaaad mother – (Shut your mouth)
But I’m talkin’ ’bout Shaft – Then we can dig it!
still learning a lot. Tahnk youe fokes. 🙂
So far so good. Today the low and then we recover to 6 march and then it is not clear yet. We could make an big HIGH on the 7th and start directly an big dicline. Tomorrow or in the weekend it will be clear.
http://prognoseus500.simplesite.com/
The LOW today. I have 2 options with the red line. We start up at 4-8 am or we start up after 10-12 pm.
Succes and use it only as confirmation it is not all tested
The red line is now stabel I think. It was a perfect LOW. And now we recover to the HIGH on 7 march. The pattern of the lines is unreliable in this recover period. The panic is the factor that makes it unpredictable. http://prognoseus500.simplesite.com/
Willem,
I think what you’re doing is terrific. Keep up the good work!
small bounce to 2730?
https://invst.ly/6slwz
Closed weekly puts. Luri, wasn’t 2666 that your initial target? Tomorrow is another day.
As for the 1663 target, the secret sauce is to add 666. 😛
1663 + 666 =2329. March 2017 low 2317.75
liz,
someone once told me………………”one step at a time”…………. heheee…..
let’s see what happens when the 200 dma is broken to the downside.
bubbles resolve themselves ONLY in one way – they pop! period.
there is no coming back from the biggest ‘everything” asset bubble in history – popping……..resulting instead with a pullback to 2300 and then push to new highs…………..
the other issue i have with the w4 theory of 2300 is the idea of wave degree. this nominal size of this w4 [?] renders the idea of “degree” of wave non functional. why label the degree of wave when this smaller degree w4 is nominally larger than degrees of higher order………………………………..
Yep. Some wave counters seem to completely ignore any such constraint…
Peter G,
Any more snippets on what Puetz’s research would indicate? Would the weakness of the past 3 days possibly enhance or distract from what Steve Puetz’s research and what might be dead ahead? I ask because your post indicates that the market might bide it’s time waiting for the “full moon” to pass. Probably unknowable.
I don’t think we should “over-analyze” what the parameters are, Ed. You and I both know there have been multiple “setups” in the past where it appeared the “Puetz Window” could lead to a crash. The great majority of times the crash never comes. But we do know we are now in another such time window. The full moon has come and gone as of a few hours ago as I write this. If this window proves to be fruitful in terms of a crash we should see an immediate decline of a couple of weeks and the first week or two should be very meaningful to the downside to the point where there are no more than 2-3 up closes or rebounds. Yes , the odds are strongly against it, but the setup is there and the sentiment couldn’t be more supportive. I don’t know what you’re hearing but I’m hearing this is a great buying opportunity. Hmmmmm! We will know in the fullness of time!
The rate of decline would reinforce the idea that the eclipse cycle per Puetz is playing out. The question is whether we will get a crash or not. In the event that we don’t, the market still usually follows the eclipse cycle which portends weakness into as least the next new moon. That could be part of a crash or it may just be a retest of the prior low. I’ll be buying heavily if the prior low is as far as the market can make it in the next two weeks.
Pro-Shares continue to defraud traders. First they steal 100 million in option premium by changing the rules in the middle of the game, now they are lying through thier teeth by claiming UVXY now tracks VIX at a 1.5X clip. Judging from price action today it’s more like 1/2X VIX. Nonetheless, today was a good trading day.
UVXY is now sporting the same TWS candlestick pattern VIX did last December…shape of things to come?!
Dan Goulding,
Thanks for sharing your insight and perspective!
“Farewell and adeiu, to you Spanish ladies…!” 🙂
someone ………cough……….”verne”…………..cough……
is singing freely these days?? hmmmm……………… methinks something is up???
what “be’ith” up verne???…………………..
Just gazing at all the futures red in wonder…! 🙂
I am looking for this move to end the wave 4 in the low SPX 2400 area for a few reasons.
The C wave started at around 1985-86 after brexit. a 50% retracement of that move is around 2426.
The previous wave 4 of a lower degree which was the low August 21st was around 2420
The 20 Month Simple Moving Average is at around 2433, but if the price does continue dropping, that should fall to closer to 2420.
Lastly if the C wave equals the A wave, A wave was 2872.87 -2532.69 = 340.18, which from the top of the expected B wave 2789.15-340.18 = ~2449.
Probably to obvious now, but just my thoughts.
Meant wave 2 of a lower degree with that August 21st low.
John, thank you for the timing you predicted despite a naysayer or two. The same person saying majority of comments are hogwash & useless and was targeting 2838 over the weekend is now singing sad songs. I feel commenters who share timing are important because EW is weak when it comes to timing. To unclutter the comments section, this is my last post and good luck to everyone.
ok liz,
i openly admit two things – #1] i know absolutely nothing, and the longer i live the more sure i am of this fact…………………………AND…………………………
#2] i ate a can of baked beans for breaky!!! ………….now i know what you are saying liz……………………………………………..and well, i happen to agree……so if i “promise” to step outside ………”often”…………………..[cough]……………….will that change your mind for you to comment?? ……as none of your comments can ever be classified as “clutter”!!
Thank you Liz,
Sad to see you go, I like your sense of humor and market approach.
By the way ,I do not care about what other people have to say about my contribution to this blog.
I m wearing wooden shoes, so I will keep drifting around.
If you want ,I can give you my email adres to share some information?
Good luck.
Sorry to see you go.
Sad songs? Are you kidding me???
In the last months I pulled in 6 figures on the vol implosion and am about to do the same thing on this dive…Jeez! Some people!!! 🙂
I want to again reiterate that I mean no offence to anyone posting on the forum. All I have ever asked is for those posting to help those of us less erudite with reasons for what they assert. Just because I was expecting a re-trace to at least 90% of the A wave FOR A FLAT, does not mean I was bullish. It is remarkable that anyone reading anything I have posted on this forum could come to such a remarkable conclusion. See ya LizH. Best of luck to ya. 🙂
Oh and by the way, I admit I was WRONG about the flat….. 🙂
While having a bearish bias has been correct
I am beginning to see signs of an inversion taking place
Today’s swings included .
The next turn date is March 17 followed by April 4 .
Only having a bit of data to go on I’ll simply say
I’m mixed on direction at the moment .
The puetz window is questionable as a bearish cycle at this time.
Venus is in a bearish cycle until October
Mars Uranus is in a bearish cycle until January 2019.
Mercury will be going retrograde in mid March and it’s mid point
Surrounds April 4 .
Something is a miss at this juncture .
As for the wave count I have to agree with Peter on all fronts .
Joe
I thought were in a C wave down.
Looks like I was incorrect….again! 🙂
Joe,
Good to have you back! I posted a question a week or two ago concerning your
“Joe Index” that you configure using multiple indices. Did your index have 5 waves down off the peak?
end of day ES………………https://invst.ly/6t3lc
Neat! That certainly puts things in perspective. Seems I may have been missing the forest from the trees. The stemgth in small caps was very counterintuitive and had me somewhat in doubt…I have been wrong… 😉
We now, as we did last December and which I noted on the forum, have another Three White Soldiers in UVXY. For several weeks after many traders were quite confident it was a dud and stated as much
Another early tell?
yeah, verne…………the (iii) of iii of 3 should be the lowest reading of the AO, which it is……………..or so the story goes……………………..you can also see the beginning of positive divergence building on the 60 min…… and the AO is close to the zero line for w4…….all supportive of this count.
https://invst.ly/6t3rp
Luri,
What does AO stand for?
ed,
i use a very modified “Awesome Oscillator” that when used with the heikin ashi candle produces a superior momentum indicator…………….
[and for the public record…… AO can also stand for the “Alpha and Omega”, the beginning and the end……………………..which is a biblical characterization of the creator of the “all”]
luri I took another look at DAX. I think we are behind them by a day or two. I was so sure that since they already took out the Feb 9 low that we would this week. Analogies somtimes work, and sometimes not. I gotta make the chart show next week to get the skinny from Peter T on his current count but I do think we’re going lower next week.
Liz, you better come back here and drop your original posts with numerology ,fractals and BTC anology nobody can do it in a way you do.
If you also want Liz to comeback male a statement here:
Do you agree with my prediction, we will go higher till March 7 and after that a drop till march 9.
Have a good weekend Folks … ( and please respect other opinions with out jugements)
The website is updated. for so far. http://prognoseus500.simplesite.com/
Use the information as confirmation.
@Hi Rotrot, a HIGH around 8/3 That what you predicted O.K. But there is also a LOW on the 9th. That can be a deep Low. So watch out. 🙂
energy chart for next week inverted be careful in case it’s not
https://ibb.co/i34nq7
Thank you Tom, but the pattern looks O.K. until the 8th. Then we should make a (little) decline and a very (little up) and then all the way down. Explination: The blue line is very very negative and the red line is giving up on the 8th and the High was on the 7th together very negative. The Low wil be on Monday or further I can not see this for now. So be careful. Later Willem
A new weekend post is live at: https://worldcyclesinstitute.com/waiting-for-the-other-shoe-to-drop/
This website is for educational purposes relating to Elliott Wave, natural cycles, and the Quantum Revolution (Great Awakening). I welcome questions or comments about any of these subjects. Due to a heavy schedule, I may not have the time to answer questions that relate to my area of expertise.
I reserve the right to remove any comment that is deemed negative, is unhelpful, or off-topic. Such comments may be removed.
Want to comment? You need to be logged in to comment. You can register here.