
Forecasting the Top
Elliott Wave Theory has a poor timing component to it. Mostly it’s used on a grand scale “after-the-fact.” I find that it has little predictive capability. So, it’s best to rely on other cycles data to get a sense of where the top of the market might be.
Looking at the subwaves in the contracting fourth wave triangle that seems to be tracing out now, and based upon the length of the waves in place so far (time-wise), I can see a top forming at the end of May.
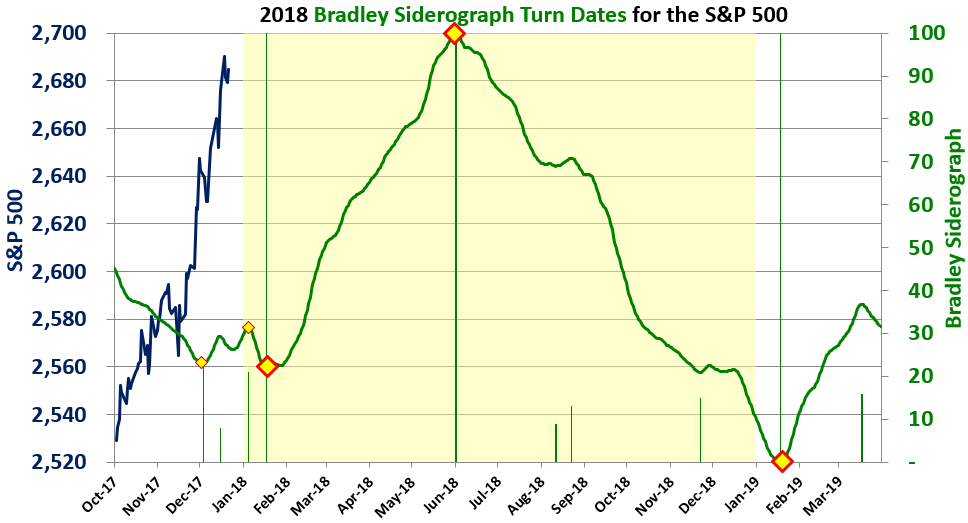
Drawing on the Bradley Siderograph data, which is freely available online, I see there’s a potential turn coming up around the June 9, 2018 time period. This may coincide with the top of the market, as it seems to sync with my Elliott Wave forecast.
This could result in a “crash” in the early to mid part of September. This is highly speculative, but presents a scenario that is reinforced from two technical tools.

Above is the 2 day chart of the SP500. We’re currently in the final fourth wave (an unconfirmed contracting triangle — will be confirmed once the D leg up is complete (see the daily chart below of ES).
At the moment, my measurements suggest the top of the fifth wave may be 2960, but let’s round that off to 3000 for a sake of this simulation. In this case, a first wave down in 5 waves will likely drop to just below the 1800 level.
Once this impulsive first wave down is complete, a second wave (in three waves) should trace out to the 62% level, which in this case would be about 2,500.
In the event that we achieve a final top at the end of May, or early June, this sets up a potential third wave crash for September. The first and second wave sequence can easily take two months to unfold (the timing here is somewhat speculative, of course).
The eventual multi-year drop may trace out similarly to 1929-33. In that case, it may look somewhat like the chart below, extending over a longer period to about 2022.
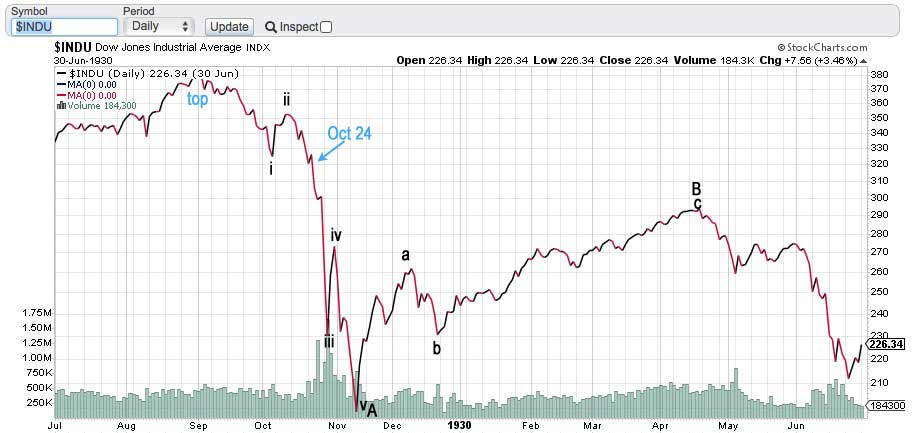
Above is a daily chart of the DOW for the period 1929 – 30. showing a large portion of the ABC wave down that ensured after the top was in. The C wave in the chart is not complete, having eventually bottomed at about $41.00.
You can see that in this chart, the top of the market was in the beginning of September, while the “crash” didn’t take place until a couple of months later (Oct 24). However, the bubble this time around is very much larger, so we may see more time in required for the fulfillment of the wave i/ii requirement after the top.
____________________________
Registration for Commenting
Want to comment? You need to be logged in to comment. You can register here.
If you register, it protects your information. It also allows you to comment without filling in your information each time. Once you’re registered, simply go to the home page and click on the login link top right in order to log yourself in. Usually, you’ll be logged in for several days before needing to be logged in again.
______________________________
Problem receiving blog comment emails? Try whitelisting the address. More info.
______________________________
the real deal SM 2
The real deal …‘Educational, insightful and thorough market analysis for all levels of traders. It’s Elliott Wave at its best….Peter Temple is the real deal’ —SM |
Couldn’t be happier … KK 2
Couldn’t be happier …The analysis and insight you provide is simply amazing! I’ve been trading the futures and equity markets for well over thirty years and usually average around 5% monthly. Since joining your Traders Gold Service two months ago, that number has better than doubled. I couldn’t be happier.—KK |
Have not had a losing week RW 2
Have not had a losing week …I have been with Peter almost a year. The only thing that matters is have I made money with his service. I think I have finally turned the corner using Peter’s EW. I have not had a losing week in the last 5 months. Thanks Peter, for your amazing amount of hard work. —RW |
Tops in your field DZ 2
Tops in your field …You are tops in your field. Tried to follow Elliot Wave international for years. They were always behind the market. After discovering you, I perceive that you are an expert in reading the waves, which puts you way ahead of the rest of your peers. And you can read the Waves like you are reading tomorrow’s financial section. I pray you stay healthy. —DZ |
The best of them JL 2
The best of them …Last couple of years, I subscribed to several ‘market traders’. You are by far the best of them and the personal contact is awesome. Daily and daily updates are very well written! Besides your expertise in EW, I also like your cycles analysis. Best investment I ever made! —JL |
Rise above the rest … SM 2
Rise above the rest …I have only ever met a few people who, in their chosen fields (astrology, medicine, music, martial arts, technical analysis), rise above all the rest and you are one of them…you have ‘the gift’…and that’s why I’m a Trader’s Gold member. —SM |
A true expert in Elliott Wave FL 2
A true expert in Elliott Wave …You are a true expert in EW analysis. What you provide is not available anywhere and is priceless. Subscription on your services is the best thing I have ever done. Many thanks for your effort to make me a better investor. I now have more trust in my investment decisions. I hope you will continue the excellent work! —FL |
Get an upper hand … JC 2
Get an upper hand in trading …Seeing all the different currency pairs and the wave structures and hearing you explain why this has to do that on a nightly bases gives one a upper hand when trading. Elliott Wave applies to all stock and indices and can be applied to any candlestick chart. If someone ask what you want for Christmas – Tell them a membership to Peter’s “Traders Gold!”—JC |
The Market This Week
Here's the latest daily chart of ES (emini futures)

Above is the daily chart of ES (click to enlarge, as with any of my charts).
On Friday, the fourth wave of the C wave of this D leg of this contracting triangle we appear to be in, dropped to within 3 points of my measured target (2657) and then turned up. Expect a continuation up from here.
The large fourth wave contracting triangle continues to play out, as predicted. I've been projecting about a month (or a bit more) left is this topping process, but the length of time this D wave has taken to trace out is pushing that date back slightly. The Bradley chart above might be closer to the truth.
The target on the upside remains 2780 and the action the latter part of this week certainly support a full wave to the fibonacci target (I address this under the 60 minute chart, below).
I would expect the next wave down (after we reach the 2780 area) to be much quicker, as this market is so near the top (we're seeing a lot of underlying weakness).
After the E wave down is complete, we'll take off again to the upside in a fifth wave, which will simply finish off the pattern. We'll get to a new high and probably more, but don't expect (as I've been saying for a very long time) a large fifth wave that travels any great distance.
Over the next week, we have the fifth wave left of the C wave of the D leg of the contracting triangle.
Summary: We should head up this weekend in a fifth wave of the C wave of the D leg of the contracting triangle. This fourth wave triangle has the balance of the D leg, the E leg (down), and a final fifth wave to a new high left. That fifth wave up to a new high will be the end of the 500 year bull market.
___________________________
Trader's Gold Subscribers get a comprehensive view of the market, including hourly (and even smaller timeframes, when appropriate) on a daily basis. They also receive updates through the comments area. I provide only the daily timeframe for the free blog, as a "snapshot" of where the market currently trades and the next move on a weekly basis.
______________________________________
Sign up for: The Chart Show
Next Date: Wednesday, May 2 at 5:00 pm EST (US market time)

The Chart Show is a one hour webinar in which Peter Temple provides the Elliott Wave analysis in real time for the US market, gold, silver, oil, major USD currency pairs, and more. You won't find a more accurate or comprehensive market prediction anywhere for this price.
Get caught up on the market from an Elliott Wave perspective. You’ll also get Andy Pancholi cycle turn dates for the SP500 for the balance of the current month. There’ll be a Q&A session during and at the end of the webinar and the possibility (depending on time) of taking requests.
All registrants will receive the video playback of the webinar, so even if you miss it, you’ll be sent the full video replay within about an hour of its conclusion. For more information and to sign up, click here.


“Elliott Wave Theory has a poor timing component to it. Mostly it’s used on a grand scale “after-the-fact.” I find that it has little predictive capability. So, it’s best to rely on other cycles data to get a sense of where the top of the market might be.”
– as to “Elliott Wave Theory” your representations are nothing short of astounding
– as to “cycles data” your representation is spot on
– in both instances, your representations are totally consistent with the viewpoints contained in my emails the last several months to readers/posters at this public blog
https://worldcyclesinstitute.com/locking-in-the-combination-or-not/#comment-28310
rotrot,
haha … the price predictability of EW is astounding, imho, if the analyst has any idea what he/she is doing.
Thanks for the kind words.
http://www.thesaurus.com/browse/astounding
I am obviously out of sync with the majority of posters at this public blog…to demonstrate my point, below are several of my recent tweets:
https://twitter.com/allerotrot/with_replies
@allerotrot Apr 16
nice observation…EW counts should be consistent with obvious technical indicators…
@allerotrot Apr 16
cycles and astro cause me to believe the market will stay afloat until April 18/19…be well!
@allerotrot Apr 20
it will remain to be seen if Thursday was “the most important pivot since the January 26 record highs”…however, it was a pivot…
@allerotrot Apr 21
SPX daily…next week selling is likely…
@allerotrot Apr 21
VIX has made a low…might prove to be a significant low…
@allerotrot Apr 21
BPCOMPQ has made a lower high…
@allerotrot Apr 23
BPCOMPQ sell signal this morning…
@allerotrot 4 hours ago
DISTRIBUTION…different day…same scenario…ramp the overnight futures so the retail investor/trader buys the market open…on another note, yesterday’s BPCOMPQ sell signal was spot on…
SPX weekly
https://tinyurl.com/yd8t27eq
SPX monthly
https://tinyurl.com/ydd2t6zz
NYAD weekly…orange/blue trend indicator is at a critical juncture…bulls do not want to see orange cross below blue…
https://tinyurl.com/y8ve6o79
Hi Peter … should I take your blue (C) wave projected for June, as the end of the move from 2011, and the end of a larger B wave from 2009?
Yes, but the June 9 date is so far somewhat speculative.
OK This week down. Some recover on wednesday, because the ECB-announcements are on Thursday. Strange pattern is on that day and 3-4 indicators are negative on that day. So Beware! After the recover from the LOW on Thursday we decline into the weekend. Probably into 1th or even 4th may.
http://www.prognoseus500.nl/
Daily Chart of the russel 2000 ( $RUT )
in Wave E Now ????????
Looks like very Clean contracting triangle
It’s exactly the same configuration as the SP500.
Not clear what you mean, Peter. Does your comment of “exactly the same configuration as SP500” mean you disagree that RUT (and SP) are in Wave E now, thus suggesting neither RUT nor SP are in Wave E yet as Wave D is still expected to reach ~ 2780 on SP500. Thanks for any clarification…
Peter,
They’re the same, so that puts both of them in wave D.
Sorry, I was looking at the Russell 3000 as rut (as I went out the door). I get those confused at times. Rut (2000) is not in a triangle that I can make out. I don’t know what the pattern is. It’s the 3000 that’s the same as SP500.
DOW also is not in a triangle. It’ll likely just to 5 waves to a new high.
Are you suggest that Dow needs to still complete it’s wave 4 down, as a new low to finish wave 4 when all other indices finish wave e of the wave 4 triangle? Or something else?
No, the DOW has a double bottom. That’s wave 4. It’s now in wave 5 and has to reach a new high. SP500 is technically in a wave four triangle. Wave 5’s out of triangles are not large waves, so everything will more or less top at the same time.
Just keeping my notes from prior thread .
24455.44-24393.62 is the pivot range for the cash dow .
Dow held the level on a closing basis .
No other thoughts at the moment .
I’ll agree to disagree on the $rut .
My bias is it may become the leader on the way up
And be the leader to break down after the top.
This implies after the triangle completes the rut
Would bottom in a wave 2 of the final 5 th wave as the spx
Or Dow completes wave E. This also allows for a bit more downside
Action in at least the $rut in the coming days .
To go a bit further the $ rut could be in wave a of E now
Which would allow for a wave b bounce then wave c down to complete E.
The $ rut to me looks like a much cleaner wave count .
Just my view is all.
We will know soon enough .
Wave E tends to bottom near the .618 retrace.
Either way a bit more sideways action in the broader sense
Before the pattern proves itself .
My opinion based on typical triangle formations
A few interesting notes on current positioning and timing Using SPX
– We have Retraced a little over 50% of the move from 4/2 Low o 4/18 High
– Looking at the timing and 50% retracement in the B wave That happened on the 15th trading day, inclusive of the Feb 9th bottom We are the 17th trading day in the D wave, assuming today is the bottom of a B wave
– The April 2- April 18th high was 163.69 points. If we add that to today’s low 2632.8, that get us to 2796.49, a little above Peter’s target.
Using the C wave of B length of 154.58 that gets us to 2787, close to Peters Target. If we are at the bottom of B, we should get a pretty strong wave C that tops right after the fed Meeting.
2617.8 As the day low on the SPX. Adjusted targets from above numbers
163.69 + 2617.8 = 2781.5
154.58 + 2617.8 = 2772.38
Everything is pointing to a low on April 30 into the full moon.. also moonwobble peak energy, I think it will surprise everybody how deep.
Thinking today may be a swing hi or tomorrow morning at open with a fade like 3/27.
I think so too Liz, a sharp drop into next week.
Let’s see reaction to AMZN and MSFT earnings.
A new weekend free blog post is live at: https://worldcyclesinstitute.com/ew-the-penultimate-wave/
This website is for educational purposes relating to Elliott Wave, natural cycles, and the Quantum Revolution (Great Awakening). I welcome questions or comments about any of these subjects. Due to a heavy schedule, I may not have the time to answer questions that relate to my area of expertise.
I reserve the right to remove any comment that is deemed negative, is unhelpful, or off-topic. Such comments may be removed.
Want to comment? You need to be logged in to comment. You can register here.