
Market Update for Friday, December 16, 2016
This is a longer version of the usual Market Update, to replace the Chart Show. It’s approx. a half hour.
 |
 |
Make sure you zoom the video to full size with frame expander (arrows) in the bottom right hand corner and also set the quality to as high as your web connection allows. This is an HD quality video so the best viewing is at that level. |
_______________________________
Market Update for Thursday, December 15, 2016
 |
|
Make sure you zoom the video to full size with frame expander (arrows) in the bottom right hand corner and also set the quality to as high as your web connection allows. This is an HD quality video so the best viewing is at that level. |
_______________________________
Market Update for Wednesday, December 14, 2016
 |
|
Make sure you zoom the video to full size with frame expander (arrows) in the bottom right hand corner and also set the quality to as high as your web connection allows. This is an HD quality video so the best viewing is at that level. |
_______________________________
Market Update for Tuesday, December 13, 2016
Technology challenges tonight! And then there’s my brain: I say this is for the 12th in the video, but it’s really for the 13th (Tuesday)!
 |
|
Make sure you zoom the video to full size with frame expander (arrows) in the bottom right hand corner and also set the quality to as high as your web connection allows. This is an HD quality video so the best viewing is at that level. |
_______________________________
There has been so much crazy speculation in the past 48 hours as to where this market is going, I thought it best to focus in on the “never ending diagonal” to reinforce the fact that it’s just an ending diagonal, we’ve seen it many times before (at least I have), and it always traces out much the same pattern, with a time projection that really isn’t going to change that much from the norm.
This particular ending diagonal is extremely rare. In fact, nobody to my knowledge has ever seen one at cycle degree or higher at the end of a corrective wave (at least, in a bull market).
Let’s get some of the emotion out of the equation and take a look at the pattern from a technical perspective to get a realistic look at where we’re going and when. Then you can tell me I’m crazy (I’m used to it … lol).
Ending Diagonals
 We continue to work our way through the ending diagonal.
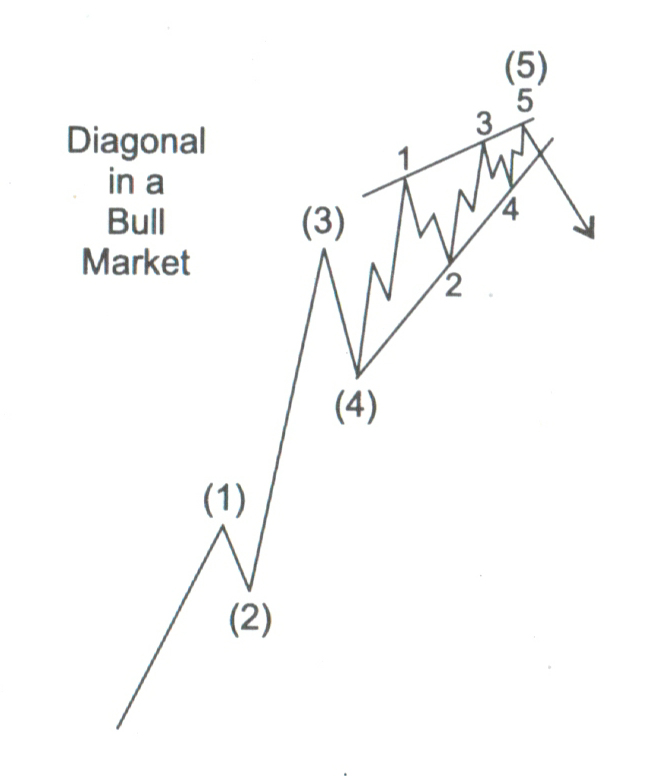
Ending diagonals are rare at cycle degree. Wherever they trace out, they suggest a market that is extremely weak and barely able to achieve a new high. Although ending diagonals usually fall under the banner of a motive wave, they have properties more aligned with corrective waves. Ralph Elliott described an ending diagonal as occupying the fifth wave position of a motive wave when the preceding move has gone “too far too fast.” He maintained that it indicates “exhaustion of the larger movement.”
This particular version of an ending diagonal is extremely rare. That’s because it’s at the end of a corrective wave. And that, I believe, is primarily due to the fact that the rise from 2009 has a large central banker component—an “unnatural” element to it. It has fuelled the bullishness of the herd, but not in a sufficient way to effect a truly “motive” market. We’re barely making it to the top.
Last week, I posted a video relating to my original projection for a third wave with a maximum high of 2237. Once we exceeded that number, I immediately posted a video projecting higher levels due to the fact that I’d missed a tiny defining element of all ending diagonals: all waves must be zigzags.
You can see in the diagram above that the first wave of the ending diagonal (wave 1) starting from (4) is in three waves. This is the usual structure of a motive wave—all waves must be zigzags, starting from the fourth wave of one degree higher. Usually, they begin after the fourth wave of a motive five wave pattern.
However, in the chart below, you can see that from the red (4) to the red wave 1 of the ending diagonal, there are only three waves (blue ABC). In fact, the three waves are a zigzag and actually make up the whole of the first wave of the ending diagonal. That’s because the wave from blue B to red wave 1 is in five waves (it is NOT a zigzag; it’s just a “zag”). This gets down really deep into the intricacies of Elliott waves—and supports it as a science.
And that gives me a new mini-module for the course I’m working on that nobody else seems to be aware of!
Projection for a Top
Based on the ending diagonal we’re currently in (which is the pattern playing out in all the major US indices), I’m still projecting a final top to our five hundred year set of Supercycle waves at the end of the 2016 year or into early January. I’m leaning towards the end of December or first part of January (more likely). I’ll explain more about the timing below.
______________________________
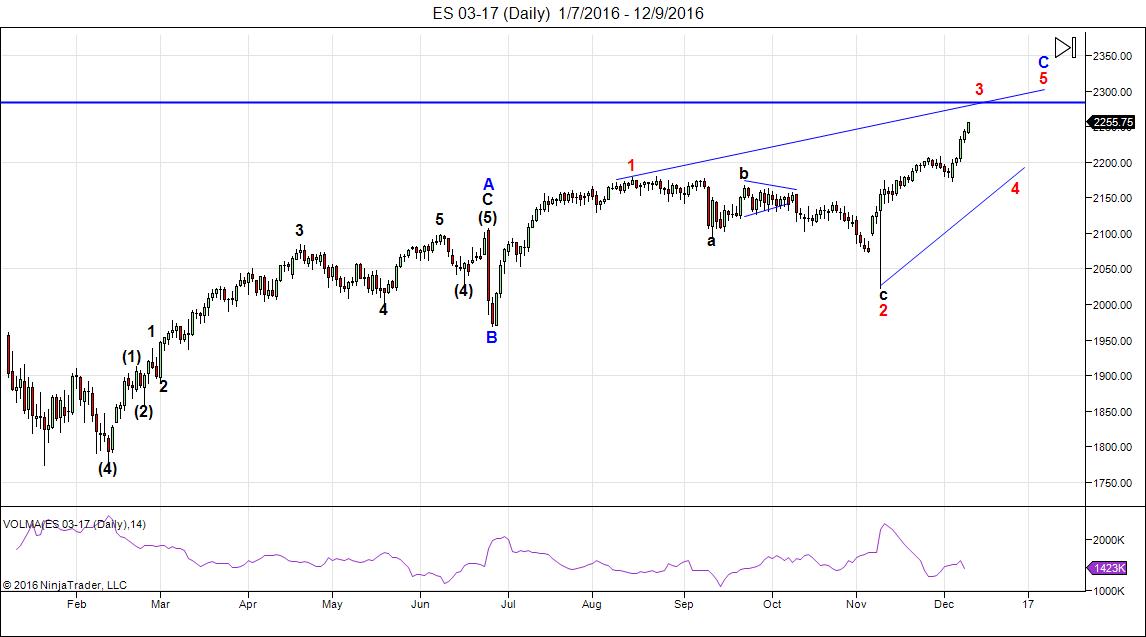
Here’s the latest daily chart of ES (emini futures):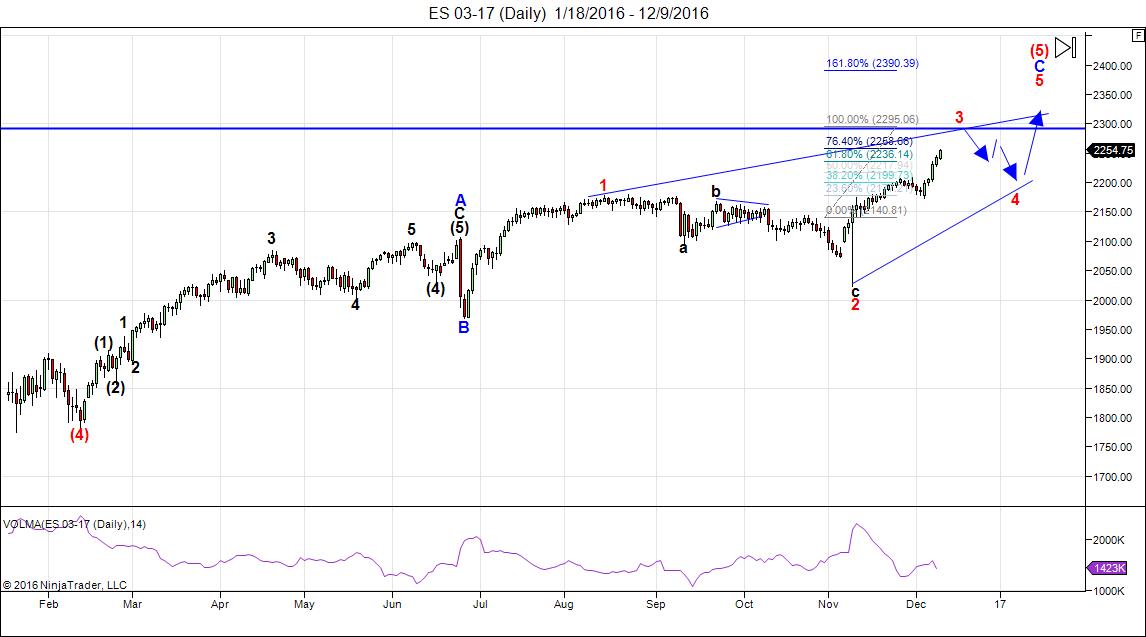
Through fibonacci ratios, I’m projecting a possible top for the third wave of the ending diagonal for ES of 2294-2300. By extension, it projects a top for the third wave for the SP500 of 2300-2315.
Note the extreme drop-off in volume for this wave (it’s the purple indicator line at the bottom of the chart). Volume is almost none existent. It should surge in the fourth wave down and we should get a volume surge during the first part of the fifth wave.
Here are the rules going forward:
- Wave 3 must be shorter than wave 1 and reach a new high.
- Wave 5 must be shorter than wave 3 and reach a new high (usually it does a “throw-over”—extends above the upper trendline defined by the tops of wave 1 and 3, but it is not necessary.
- Wave 4 must be shorter than wave 2 and must drop into the area of wave 1.
- All waves must be in 3’s (zigzags).
- The trendlines of the ending diagonal must converge.
Timing
If wave 3 in ES were to reach 2315, that would be a 20% extension of the fifth wave (C wave) that we’re currently tracing out. The first four-fifths of the third wave (from ~2024 to 2055 now) took about 3 weeks (if you discount the US thanksgiving holiday). Similar progress would suggest another week at most to the 2315 area. This may coincide with the Federal Reserve meeting announcement at the end of the day Wednesday, Dec. 14. If there is an interest rate rise, I would expect a sharp drop into wave 4 of the ending diagonal.
The higher wave 3 rises, the shorter it makes wave 4, simply by the fact that the trendlines must converge. You can look at the diagram at the top of this section to see how small wave 4 and 5 usually are compared to waves 1 through 3.
It may take longer to get to a top than my speculation but we’re not months and months away as per some of the projections I’ve heard. We’re much closer than that, more like weeks away.
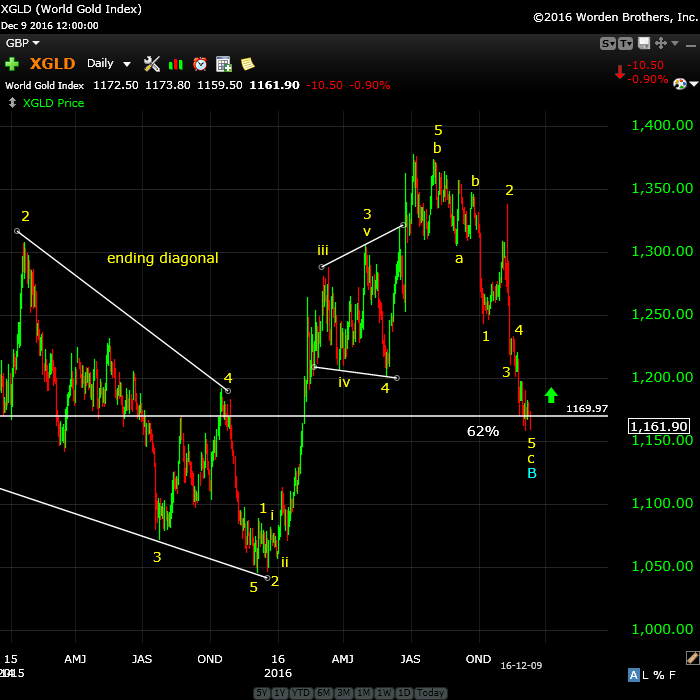
As a comparison: Below is a chart of gold. look at the time factor in wave 4/5 compared to wave 3.
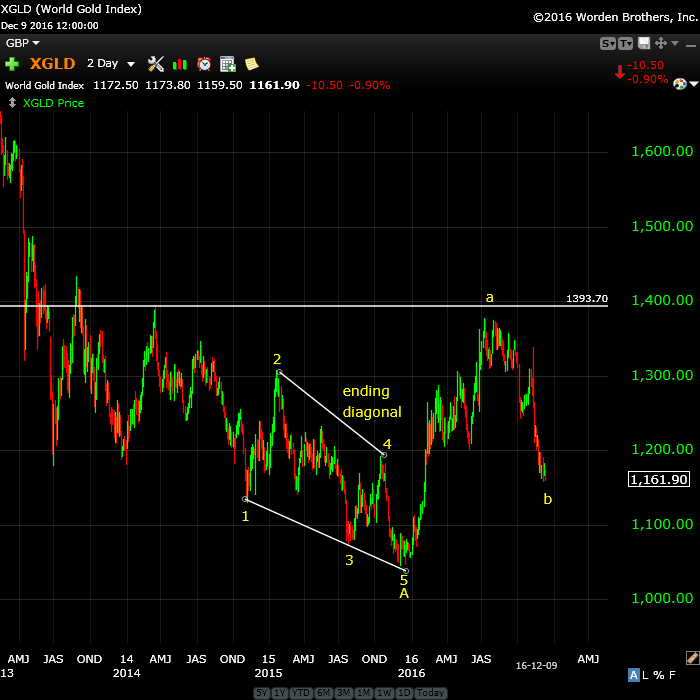
Above is the 2 day chart of XGLD showing an ending diagonal to the downside. Note the length of time it took the third wave down to trace out compared to the 4th/5th wave. The 4th and 5th wave together took 2/3rds the time of the entire third wave. This is typical of an ending diagonal. In this case, if the third wave (in our case above) takes a month to trace out, it could well be less than a month for waves four and five to trace out.
In the case of XGLD, the ending diagonal did not do a throw-over. In the present situation, I’d be very surprised if the opposite were not the case.
Summary: We are completing the third wave of the ending diagonal before zigzagging to the top of the largest bubble in history. The long awaited bear market is getting closer.
Random Updates for this Week
Gold and Oil are turning. Gold and silver will turn up and oil is turning down. Great opportunities for both as they tend to move in opposition to each other.
Bonds (I’m now following TLT in the chart show) have topped and this is ominous for the continuation of the larger trend in the US markets. They are close to a bounce, though.
We still have some time to go before a final high in the US indices. I’m still looking at the end of the year or into early January for that to happen.
Until then, it’s a dangerous market. Retracements tend to be extreme. This is not the time to get aggressive.
Here’s the latest HOURLY chart of ES (emini futures):
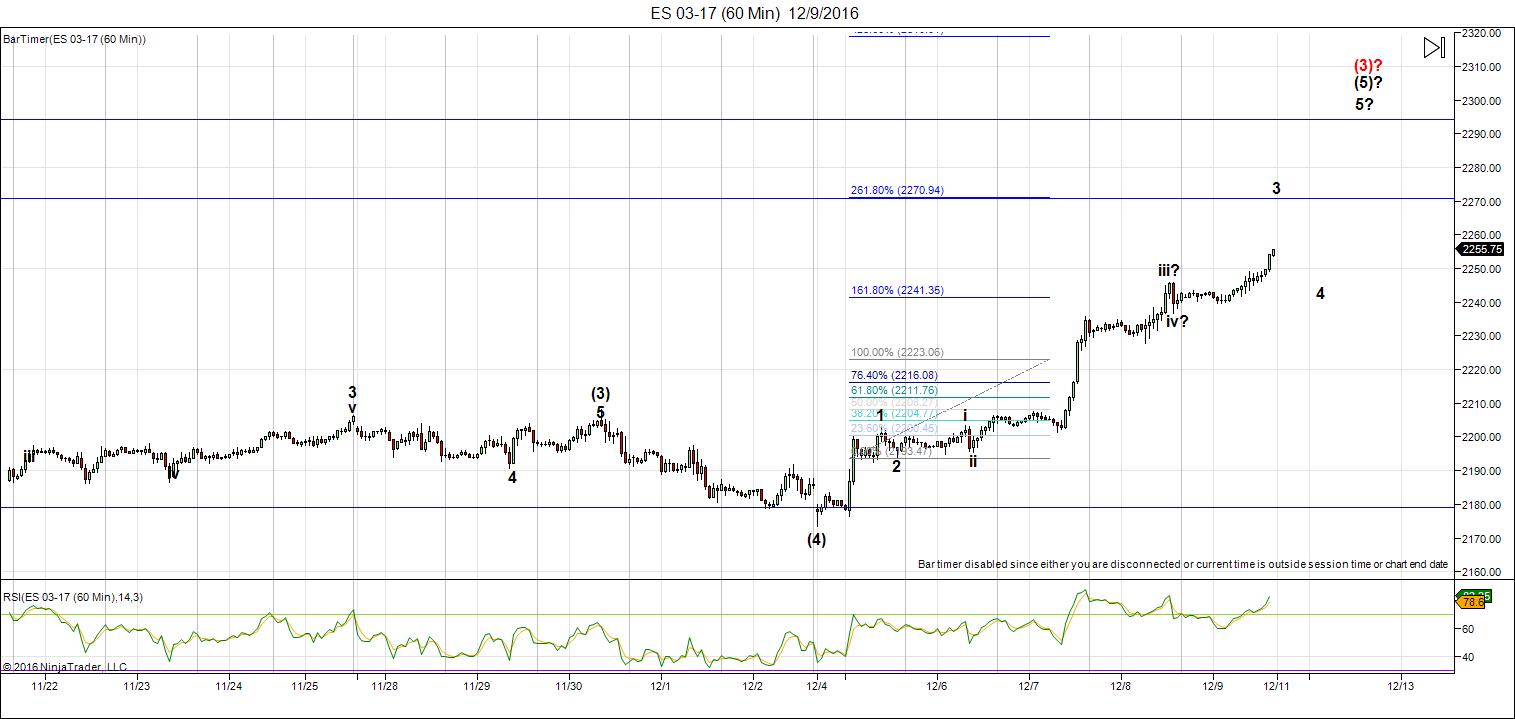
Above is the 60 minute chart of ES showing our progress to the end of the day on Friday.
The wave labels are becoming much clearer now, although the final labelling may change somewhat. We had a series of 1,2-1,2 waves at the start of the fifth wave of the third, as I said last week. I also said they’d play out with multiple fourth waves at the top. The major move for this wave is over—we’re in the final stages of wave three of the ending diagonal.
A possible top for wave 3 of C of wave 3 of the ending diagonal is 2271 (that would denote a wave 3 of C of 2.618 X wave 1 of C). That would leave another down/up move for a final wave up that would target 2294-2300 in ES. That should lead to a turn down into the 4th wave.
As I’ve mentioned, the Fed Meeting announcement of Dec. 14 may be a market mover.
_____________________________
Some housekeeping:
Andy Pancholi Turn Dates (December)
- SP500: 19-20, 21-22*, 28
- EURUSD: 16, 22
* Denotes major turn date
Next Federal Reserve Announcement (Yellen)
Wednesday, December 14, 2016, 2PM, EST (There is also a press conference listed with this meeting schedule and preliminary talk about raising the interest rate.)
The newest free blog post is Revolution in the Land of Myopia
I’m travelling this week and in New York City for the entire week. The Monday night report will be very late as it’s a long travel day for me. The other reports shouldn’t be too out of the ordinary, I don’t think, but may be later than normal each night.
I will not be around during the daytime.
There will be no Chart Show this week as I won’t be able to provide good enough quality for a live broadcast. However, I’ll post an extended video on Thursday night, based on changes in the market.
The Chart Show sign up is live for December 22. You can sign up now in the usual spot: Webinars
________________________
Here’s a video overview of the market for Monday, December 12, 2016:
 |
|
Make sure you zoom the video to full size with frame expander (arrows) in the bottom right hand corner and also set the quality to as high as your web connection allows. This is an HD quality video so the best viewing is at that level. |
_______________________________
The Charts Going into Monday
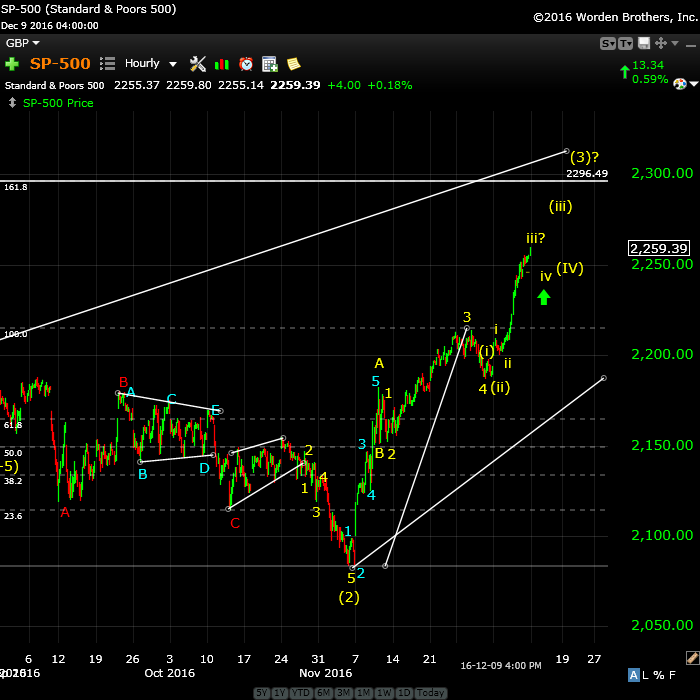
Above is the hourly chart of SP500 showing the same ending diagonal we’re seeing in ES futures. My prognosis mirrors ES almost exactly because there’s little difference in the levels between the two (6 points). I put us in the fifth wave of the C wave of wave 3 of the ending diagonal (same as ES).
The most likely target for me for the top of wave 3 is about 2294-2300. That’s due to treating the wave up to about 2214 as the A wave and then targeting the 1.618 extension of that wave. It would mean re-labelling this chart, as we may end up with a double zigzag when this is all over. Zigzags (5-3-5 confgurations) most often contain a and c waves that are the same length, but can also extend to a fib ratio of 1.618. There are multiple possible fibonacci wave relationships possible with this wave now.
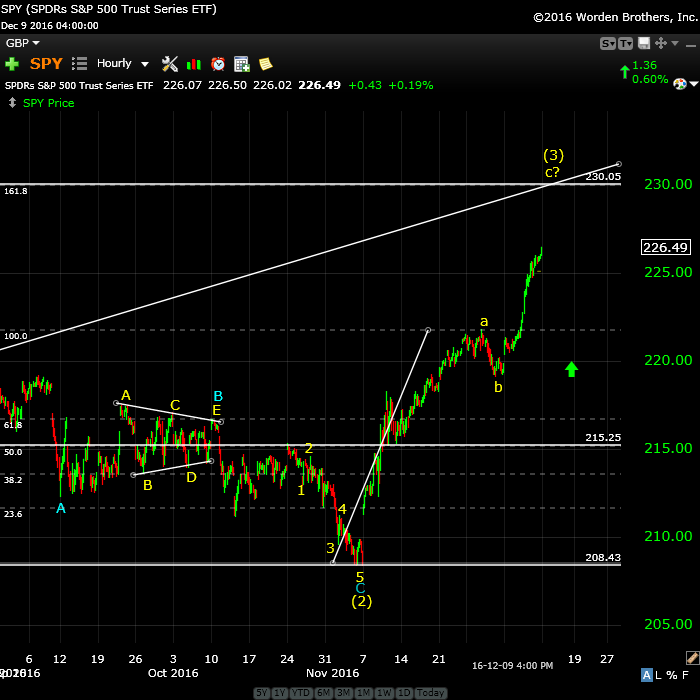
Above is the hourly chart of SPY showing the same ending diagonal configuration as in ES futures, and the NYSE (chart below).
The extension of wave a (as shown) would give a target of ~230.00. There are other possible fibonacci ratios which could give slightly different targets.
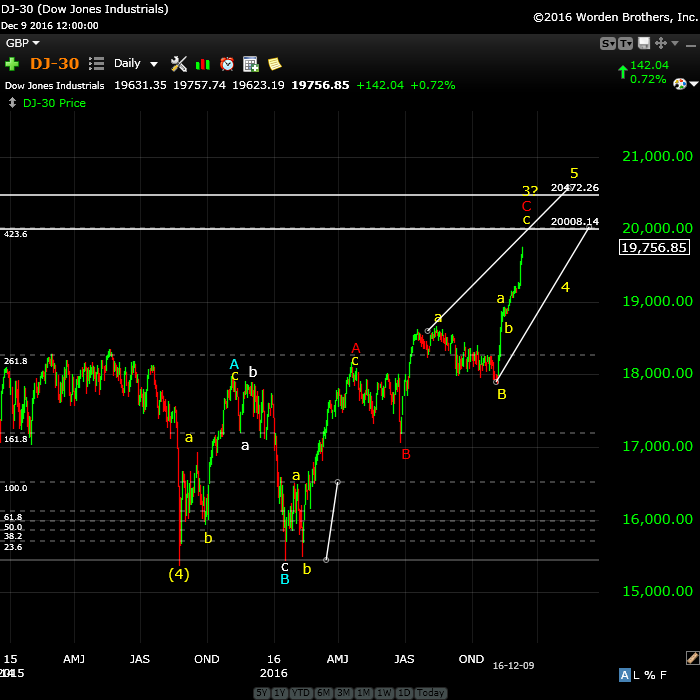
Above is the daily chart of the DOW. Wave three of the ending diagonal has gone straight up for this index. As I mentioned above, it means that wave 4 will be tiny in comparison.
I’m taking a measurement off the first ‘a’ wave here for the entire wave. I don’t know if this will be the third wave top or the fifth wave top, but I think 20,000 more than likely for one of them (I suspect the latter the better bet), as it’s a nice round number, which is usually a target in these situations.
Wave 4/5 will possibly be quite rapid compared to the rest of the wave so far.
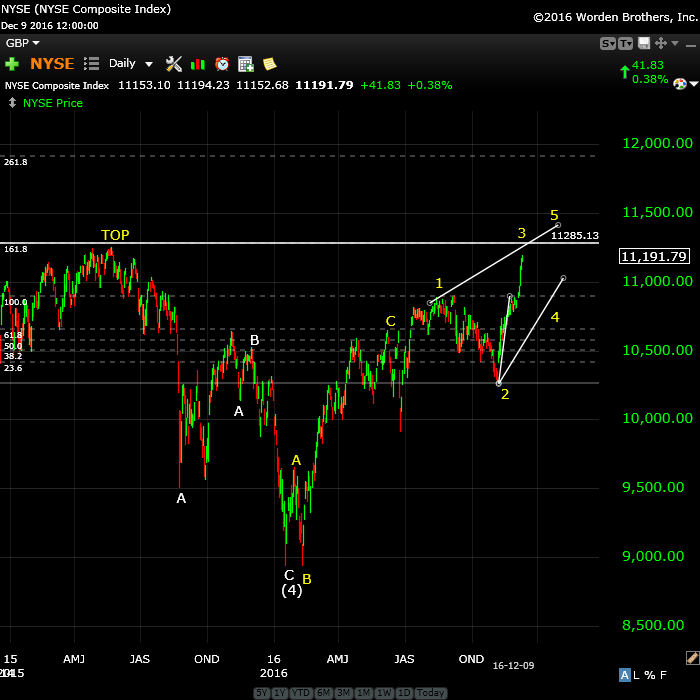
Above is the daily chart of NYSE. As I’ve been saying for some time, because all the other US indices have reached new all time highs, it will be important for this index to also reach that same level before before ending the final wave up. Based up the configuration shown above it appears to be lining up to do exactly that. The previous high is at about 11,253. I’m looking at this level (at least) in this index as being a final target for a top.
On a near term timeline, wave 3 has shot up, which along with the other indices, makes the wave 4/5 combination (still to come) look like it will be relatively short time-wise.
As I’ve said many times before, if one US index reaches a an all time new high, all the remaining US indices must also reach a new high.
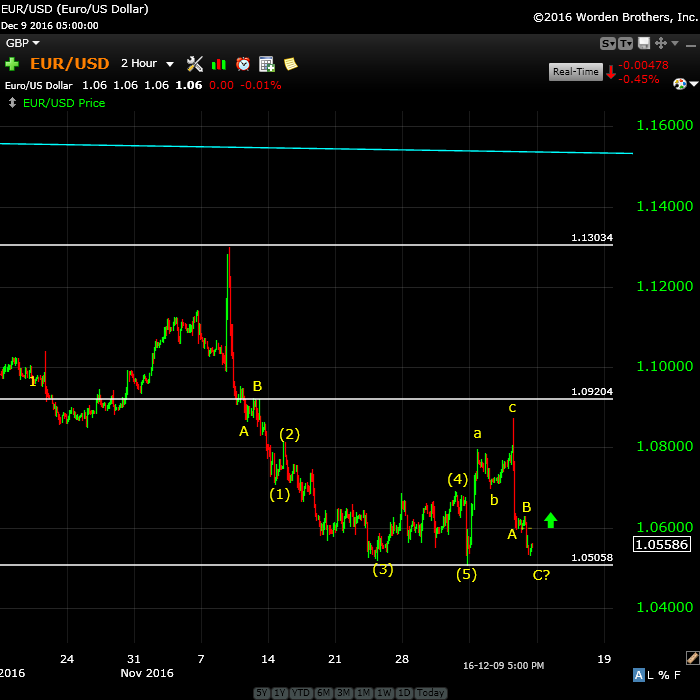
Above is the two hour chart of EURUSD. I expected a C wave as I mentioned late in the week. However, it’s now dropped so far that I’m expecting a double bottom. This would confirm the wave down as a “3” and support a rise to the target I’ve been focused on of 1.13.
Two weeks ago, I’d uttered a caution that this index might go back down to a double bottom. I didn’t expect it to happen in this way. Obviously, the EURUSD is extremely weak. When it reaches the top, it will be a very lucrative short as it will drop like a stone. Be careful with this one if you’re going to play it. The surprises are going to be to the downside.
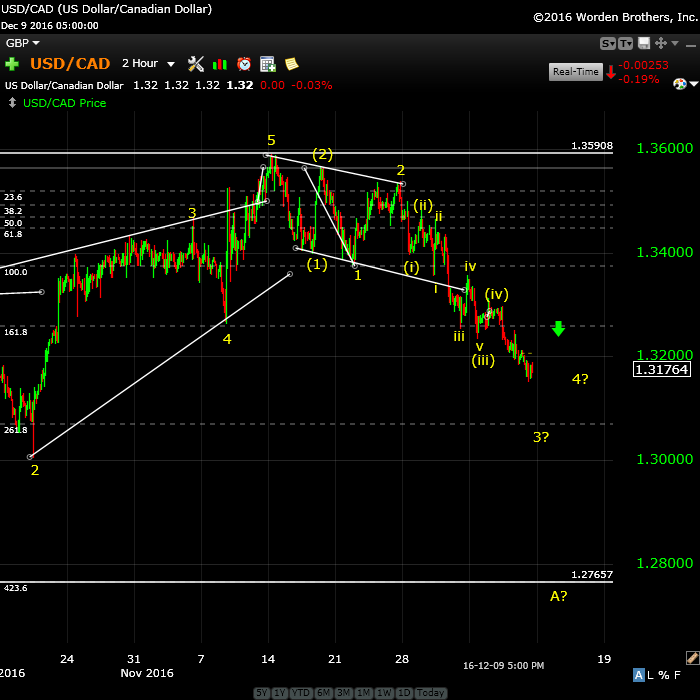
Above is the 2 hour chart of USDCAD. I’ve now labelled this as a set of 1’s and 2’s of lesser degree on each drop. We’re now into the 3rd wave, which should continue down. My target for this wave down is ~1.27657, which is also the 50% retrace from our longer term target of 1.19, as well as the starting point of the previous ending diagonal of the wave up to ~1.36.
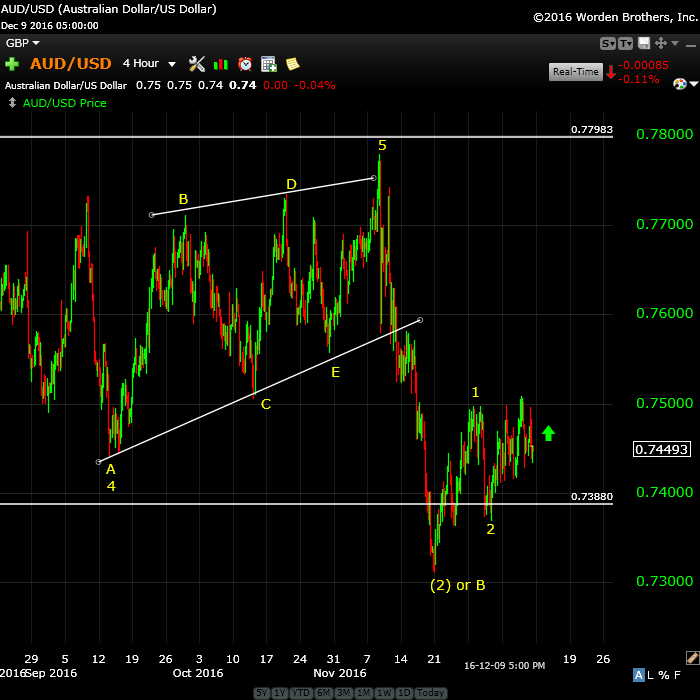
Above is the 4 hour chart of the AUDUSD. It keeps on rising but it doesn’t have a lot of momentum behind it. However, I put it in wave 3, so we should see some action to the upside soon. That doesn’t lesson the importance of tight stops.
I’ve an eventual target of .8435 for this pair, which is the 38% retracement level of the entire larger wave down (from the year 2011), which would make this wave 4.
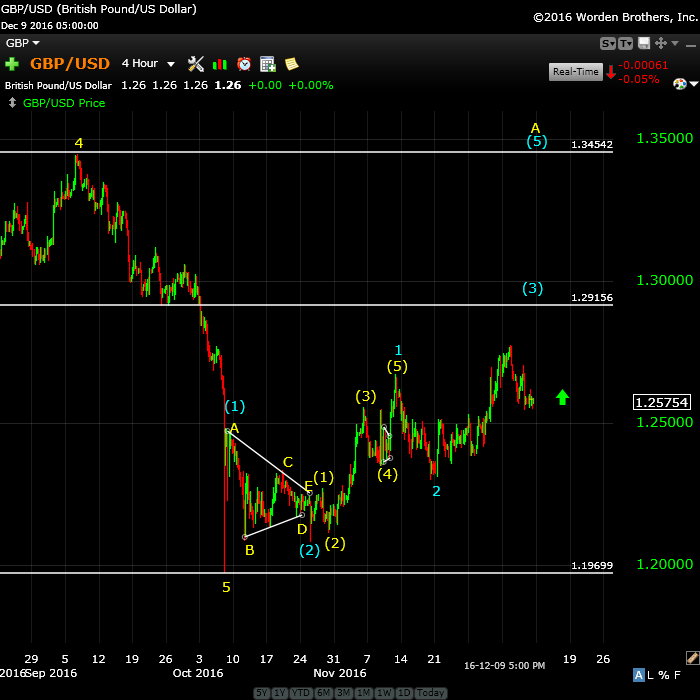
Above is the 4 hour chart of the GPBUSD. Wave 3 has now taken off as expected. The target for this A wave is still ~1.34542.
It will not be a straight trip to that target, so don’t get too aggressive. Once we reach it, I expect to see a large B wave.
Above is the daily chart of gold. Gold has hit the target and on Friday we looked like we were attempting to complete a double bottom. My preference for an entry would be to watch for 5 waves up to about 1198 and then a 62% retrace down from there, with a turn to the upside. That would be the entry point.
The upside target is around 1585.
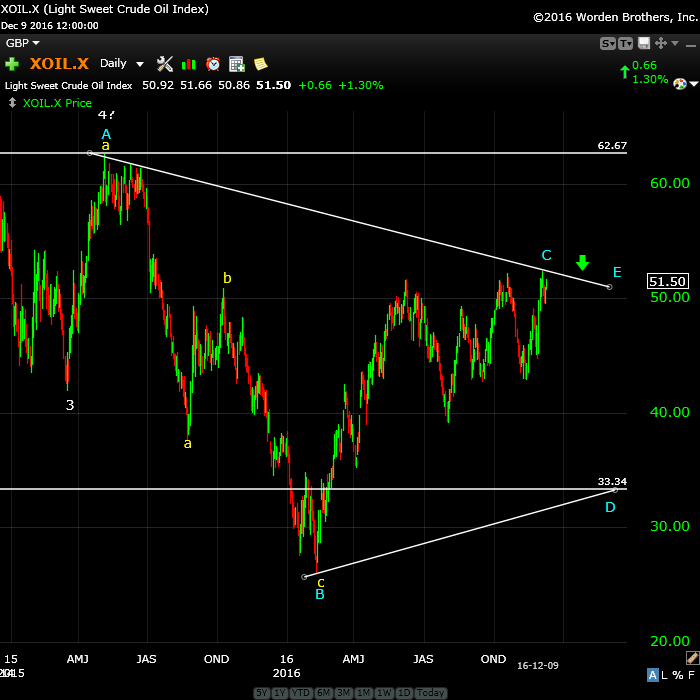
Above is the daily chart of oil. OPEC threw a wrench into the works a week or so ago, but really didn’t do that much damage. The wave up is an expanded flat, (3-3-5) which is a corrective wave and must fully retrace.
The subwaves on Friday are suggesting we’ve topped. My projection has not changed. I’ve now done a more precise measurement for the target and I put it at about 33.34. Once we have an A wave down in place, I’ll be able to project a more accurate target (or perhaps a more firm target, based on two different measurements).
Finally, we should get an E wave up to the upper trendline to complete the larger pattern. That would be followed by a final 5th wave down to a new all time low.
Good trading!
_______________________


Looks like we need a new oil forecast.
This should be a permanent loss of market share for OPEC as shale starts to fill the supply gap.
Oil just opened the week at 54,2$. What could be the potential top (since it’s above the double top target)?
My chart of WTI is not updating for some reason, so I’m not seeing the move. The next fib level I have for WTI is ~55.60.
$60 or $80 or $300 or $1000….whatever Yellen fancies will be the top.
Indices already up 1% and futures have been open for 10 mins. This is insane.
It is! I was short oil and long gold and both going the opposite of what i was expecting. No bottom in site for gold and oil just keeps going higher. This market is brutal!
Looks like oil is going to hit Peter’s $60-$70 target soon! Only 11% away. Is there another wave pattern we are missing? I know we thought it was going to drop before the rise to $60,70. Maybe something is off in the count, with the new highs?
Euro and pound moving in the right direction against the dollar. Could we get a more dovish than expected FED to really fire up those trades?
That’s what I’m thinking because we have no turn dates this week.
Hi Peter, I know you’re traveling today and will be tied up this week. Any changes in your projection in this weekend’s report with respect to oil as a result of the significant move up last night and this morning?
Thanks and safe travels to you!
Joseph,
We’re still in a triangle and the wave up is corrective, so it’s just a case of waiting for a turn down. We’re still defining the C leg, as far as I can see. I can’t access intraday charts of oil where I am, so it will have to wait until the report tonight, which will be late, I’m afraid.
As I’m sitting waiting for the plane, I’m finding a better to way to search for a top on oil. My method tells me is should be about 55.40.
This is a contracting triangle and, as such, should be horizontal. I’ve arrived at that number now by using the fib tool to measure the AB wave of the triangle. The CD wave should be roughly 62% of the length of the AB wave (an EW guideline). If I place a horizontal line at the 50% level of the AB wave, that’s 44.25 on WTI. The trend lines should be 31% higher and lower and my fib tool in this program is flexible enough that I can dial that in. That gives me a top trend line of 55.40. I hadn’t thought to measuring the target this way before, but it should work. The lower trend line would come in at 33.00. Those numbers might be off a few cents either way, of course.
If we head appreciably above 55.40, then something else is going on.
I lied, apparently. I can get intraday. I don’t see 5 down yet, so WTI should retrace back to the top and of course, there’s a big gap so I can’t see the subwaves.
Thanks for taking the time to share all of that Peter.
It’s about midnight EST. The video update for Tuesday should be live in about 5 minutes or so!
Keep getting an error when trying to watch the video. Hope your travels are going well!
J,
That’s odd. I watched most of it and it plays back OK. I haven’t done anything differently. I just don’t have the compression power I have at home so everything takes a whole lot longer. Been a very long day …
WTI crude looks like 5 down this morning and 53.62 as a second wave top. If it turns down there, we should be good until 33.00 roughly.
EURUSD working on a second wave down to 1.0574 approx. If should turn somewhere around there and head up in a third wave.
Oil has turned down i think. Once we get below $50 I’ll be more comfortable. I fully expect the OPEC agreement to disintegrate as part of the move to $33.
The market update for Wednesday is at the top of the post.
Hi Peter
What are your thoughts on oil doing a double top or is now a good time to go short?
That depends on your ability to withstand a bit of pain. We’re close to a top. It’s a triangle so doesn’t need a top. At best it’s a guess. If you’re talking about SPX, I think we have another small wave up, but could be wrong on that. Have to see what happens with Yellen …
My guess it that this will mark the start of wave 4. We’ll see.
I would want to be under SPX 2253 in order to feel better about confirming a 4th wav (that’s under the previous 4th).
Peter
How much further do you think CAD will retrace? Its gone pretty far. Any target number?
Darin
measurement off the a wave up tells me we might turn right about here 1.317 or so and we’re coming up against Yellen.
more like 1.3167
This is likely the fourth wave I’ve been expecting.4th of the A wave.
We’re now up at the 38% retrace level for this wave down, so that’s a typical wave 4 level (of a motive wave). I didn’t think we’d go that far as this is a corrective wave, but I would think this would have to be about it. Long retrace!
Darin,
Could also be the B wave, which would suggest a long C wave down, but it’s impossible for me right now to do any kind of measurements or otherwise project where things are going.
Do you think we could go to 50% or 62% retrace? Blew through 38% little while ago. Seems like we are hitting in between fib nbrs on the retraces. for CAD.
I would say USDCAD is done. This should be the B wave of a zigzag, looks like it will be the first of two (zigzags, that is). From the top we’re at, another wave down the same length as the a wave takes us to 1.27657 (the original target) and 1.618X the a wave takes us to 1.24622, which is more likely.
EURUSD bottomed properly, which was the concern I mentioned in the video last night. So that’s another reason to think CAD is done. AUD and GBP dropped but not to be of much concern.
US indices should be in the fourth wave, which will need to be in 3 waves. SPX will need to get down to 2192 to overlap the first wave.
Looking like SPX in 4th wave of 3rd now?
With limits on what I can see from where I am, I’d say the odds are pretty good that we’re now into the fourth wave in the SPX and other US indices.
The actual 4th wave down or the 4th of the 3rd wave up with one more wave to the top of the 3rd wave?
In SPX we’ve already done 5 up. I can’t see ES at the moment but I expect it’s the same. We should be in the larger 4th now as we’ve dropped below the previous 4th.
Are you saying we already topped out and are on the final descent down? I thought we had to hit 2294-2312 range.
No, I put us in the fourth wave of the ending diagonal. We would have another wave up to go.
While I say that, I haven’t had a chance yet to look at the market in any kind of detail. There’s also a chance it could be the fourth wave of the third. I’ve been away from the market all day, except for a half hour around Yellen’s annct.
The market update for Thursday is live at the top of the post.
Peter I’m trying to follow the five waves up and 3 waves down to get the euro/dollar bottom. Do these waves need to be on a certain timescale? I’m looking at the 1 min chart and it looks like we are getting 5 waves but not sure if I have zoomed in too much and should be looking for 5 waves on the bigger picture. 5 min chart perhaps?
Well I went long as I think I’ve seen 5 up and 3 down and stop just below the bottom so let’s see how it goes.
On eurusd? No, i don’t see 5 up. You’re playing with picking bottoms and I don’t have a lot of confidence in the euro right now, as I said last night. In this situation, I’d be looking for a double bottom. I’m not going to be around the market much today, so I’ll be of little help.
I’d also be looking at other currencies for a bottom on one of them. As a write this, that’s a 3 up wave so far.
There’s are early signs of possible turnarounds on AUD and CAD and GBP may turnaround where it is now (by a measurement off the A wave), so we could be near a turn up, but now seeing any signs on the euro so far.
5 waves should have a long 3rd wave and no overlaps between 1 and 4 and go to a previous 4th, then turn down in 3 waves.
Peter I have measured this third wave down in gold being 1.618 times the first wave down and it gives a 1122.5 target roughly. We just hit it so it could be the bottom for gold unless it breaks much below.
Yup, that could work. I haven’t gone into the gold sub waves yet tonight, but I will.
I went long at 1123 I case it is the bottom. Stop loss at 1118.
Peter, interesting times. I am getting concerned that there may be some serious drama on Monday when Electoral College officially casts their vote. The Globalists are doing everything they can. If so, would you consider that the Wave 4 to come? Is there any significance to the date of 12/19?
In the blog post, you’ll find the Andy Pancholi turn dates for this month. There’s a major one for SPX on 19/20 and another one for EurUSD tomorrow. I think both have a good chance of working, based on what’s happening. In fact, I’ve said a few times this week that I had no turn dates for this week, so I didn’t really expect the Yellen announcement to have much of an effect.
When I looked at the sub waves last night, it looked like we were going to head back up, which we did.
Currencies tonight look like they’re turning and I would expect double tops and bottoms tomorrow from the USD ones, based om what they did towards the end of the day. I’m just getting into the report for tonight, which will be a bit longer than normal.
So I think we’ll see EURUSD turn up tomorrow and SP500 perhaps turn down on Monday/Tuesday (perhaps towards end of day Monday).
video not working
It’s not uploaded yet. I’m working on the second attempt. I always add a comment when it’s done. It’s being difficult tonight.
It’s there now, Charles.
The Market Update Video is live at the top of the post. It’s a longer version tonight to replace the Chart Show.
I’m seeing a lot of wave counts that indicate we could be in the 5th wave.
Wave 1: Feb bottom 1818 up to June high 2119
Wave 2: June high 2119 down to Brexit low 1990
Wave 3: Brexit low 1990 up to Aug high 2193
Wave 4: Aug high 2193 down to Nov low 2085
Wave 5: Nov low 2085 up to current levels wherever they stop
I know you normally don’t comment on other wave counts but I’m confused on how Wave 1 in your wave count starts all the way back in Feb and has a decent sized drop from 2119 to 1990 before climbing to 2193. Why isn’t that 120 point drop a separate wave? If you could go over the bigger picture on where are in the wave count it would be helpful. Thank you for all you do! I appreciate the hours of work you put in in 🙂
What you’re telling me is that you don’t believe me and I’m absolutely fine with that. I can’t provide a fuller explanation than I have in the blog post.
The 120 point drop (in ES or SPX, since you don’t mention what asset you’re commenting on) is a separate wave (2119-1990). It’s wave blue B on the ES chart. It’s very clearly marked.
No not at all! Your longer term targets have been spot on. Not doubting you, just trying to better understand that first wave as it was long and lots of ups and downs. I believe that we are in Wave 3 on SPX I was just trying to better understand how the big drops within Wave 1 are not separate waves (I think that is where alternate counts are getting it wrong). I was trying to find the bigger picture that went from Feb to now so I could look at the subwaves to see how they were labeled.
Maybe I’m confused. Did Wave 1 in your ending diagonal count start at the Feb low or the June Brexit Low?
Wave 1 has to start at the Feb low, because, as I’ve been saying, the rule is that the first wave must be a zizag and that’s the only way it can meet that requirement. That’s what most of the other counts out there are missing. EWI is certainly missing that point, but they’re missing a lot more than just that … lol.
The new post is live: https://worldcyclesinstitute.com/down-the-up-staircase/