
OK … I meant “market.” No market for the feint of heart. But one of my favourite movies, nonetheless.
We’re at a US market top. Everything’s a little out-of-whack. It’s fairly even bulls and bears and the waves aren’t very long, there’s virtually no volume … because everybody’s “in.” So, unless you really know what you’re doing, it’s a really good idea to stay well away. I learned about overtrading a couple of years ago and found out it’s a really dumb idea. Patience.
But the markets are setting up. They have a long way down to go down, and once the first set of waves is in, the downtrend will be confirmed; the path will be clear.
Don’t get me wrong; to me, the path is already clear. However, right now it’s not a fun market to trade.
Now, let’s look at where we are tonight. I’m going to make this fairly short as not much has really changed from the weekend. We’re in a second wave, with a big third wave down on the horizon. Second waves can be brutal and they come down when they’re good and ready.
In a bear market, they typically end up with two spikes. That’s because the wave down following is so large. The pendulum needs to swing to the “hurt stage” … to get everybody on the train, and then it reverses. Ah … what we all love about the market.
The Short Term
I’m just going to post three sets of charts tonight: The SP500, the NYSE, and the Nasdaq. For a medium and longer term view of the markets, you can click my previous post here.
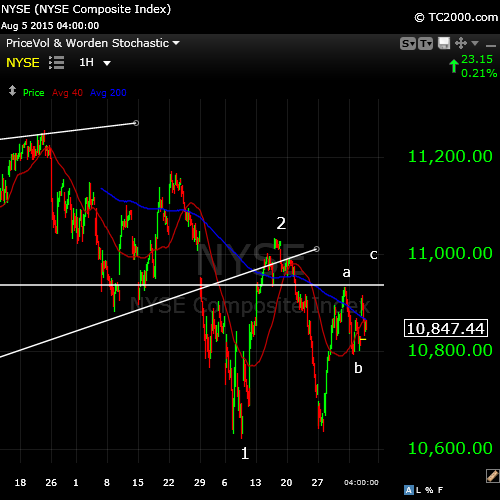
The NYSE (above) is the first chart I look at … the exchange is the largest in the world. It usually gives a very clear picture of what’s really going on. I’m showing the top in the upper left (the end of a very clear ending diagonal) and then a first wave down and a second wave up. The second wave is not quite finished and I expect the c wave up to continue to either test the a level, where the horizontal line is or, more likely, test the top of the second wave. That will set us up for a large third wave down.
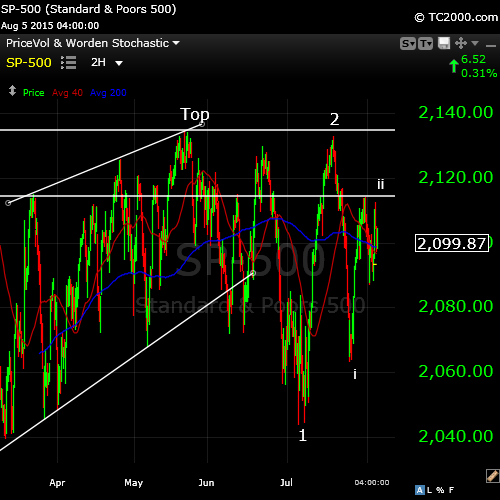
Here’s a 2 hour chart of the SP500. It’s set up in a similar fashion to the NYSE. I’m showing the most recent wave up as wave ii (a smaller second wave). The wave could end there or retrace all the way up to test the second where the 2 is on the chart. However, it should not go to a new high.
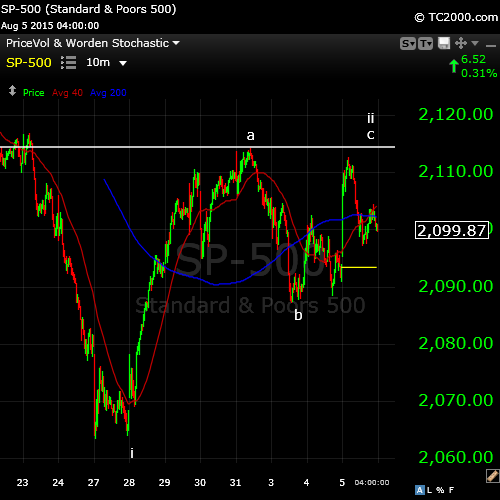
Zooming in to the SP500, you can see the wave set-up. The c wave here is overlapping and the waves appear to be in 3 waves, as does the small first wave (the start of the a wave up). To go to a new top, this wave should be in 5 waves, but it’s not. It’s a countertrend wave. We just have to wait for it to end.
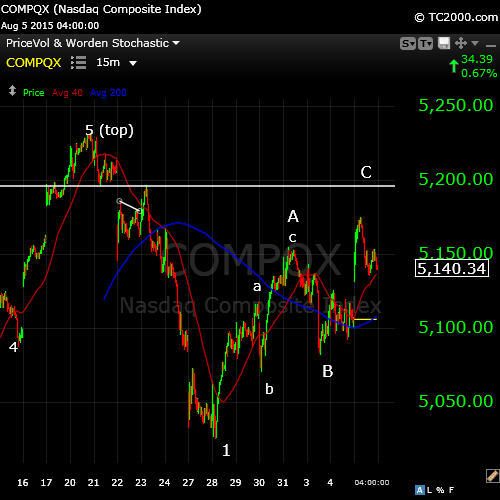
The Nasdaq appears to be attempting to get in sync with the other indices by forming a second wave here. You can see very clearly that the first wave up, the A wave is in three waves (abc). This is a countertrend wave and will likely end at the horizontal line. It should not go to a new high.
That’s a short and sweet look at the markets. Being in this “country” requires patience. The opportunities are yet to come. We should head up Thursday. The labor report Friday morning at 8:30am EST is a likely spot for a turn.


Hi Peter
Would like to thank you for your Analysis , and for your hard work . Also like to thank you for your great informative website with a very good quality books recommended .
I have studied Elliot wave many years ago , and followed the work of people like Robert Prechter and Robert Miners , and I was very surprised how wrong they have been calling the Top since late 2010 to date .
My question to you is why do you feel so confident in Elliot Wave method , while the leaders of that method has proved consistently they have been wrong , and don’t you think that Elliot wave is a no more than a lagging indicator rather then being a leading indicator .
Have you ever studied the work of Gann ? don’t you think his work could be more interesting than EW ?
Any way according to Gann’s work we should have a crash this year between Sept / October , same thing happened 7 years ago 2008 , and same thing did happen 28 years ago in 1987 ( 4 X 7 = 28 ) .
Regards
AZ
AZ,
Thanks for the kind words on the site. It’s a work in progress; I have six more videos just about ready to go :-).
Excellent question! I ,too, have been down the EWI path, and know Bob. He used to be connected to the Foundation for the Study of Cycles, which I’m affiliated with, but “fell out of love” with cycles—they “stopped working for him.” I didn’t get a chance to drill down as to why. I think that’s a part of the answer to your question.
I followed the work of his people for a long time and lost a fair amount of money. Some of their conclusions made me crazy and I determined that I’d get better than that. So here are some of the reasons for my level of confidence (not specific to this post or this market).
My underlying belief is in cycles … they’re in everything … and electromagnetic waves influence the actions of human beings on Earth, because the market, climate, social mood, wars, revolutions, etc. all happen (for the most part) in predictable cycles. I’m mainly as speaker and writer (35 years in television) and brining cycles to the world is my true love these days. I’m starting to work on a book in that regard. So, I guess it’s a holistic approach that helps me gain confidence in a count.
I also have a fairly good grasp of the vast amount that I don’t know, so consider me a student. I’m fallible, like everyone else. But I’m not afraid to take a stand, right or wrong … lol.
On a personal level, in tests, I “go off the chart” in the ability to manipulate three dimensional object in space. That innate ability helps me see patterns quickly.
More than you ever wanted to know … lol. I have to write a page answering your question with a bit more thought … I know that … so I very much appreciate the question and the resulting exercise.
And yes, the seven year cycle is really important, and goes back to the bible, of course. Appreciate the post. Hope I answered your question.
Hi Peter
Thank you for your reply , and I am more than happy to learn more from you by reading your future posts.
Regards
AZ
And please comment at any time! Thanks, AZ!
Together with André, you are my hero! 😀 Your way at looking at life/the markets, same here! 😉 A party of recognition or in Dutch: ‘een feest van herkenning!’ 🙂
Keep the articles coming Peter! (Y)
Cheers,
W
Haha … I was thinking of you this morning, Wouter!
I will post some targets for this wave tonight. Still a long way to go.
Hi Peter,
I feel so special, haha. 😛
Let’s see if this is the beginning (wave 1 of wave 3 (big one) down). That is where we are right now, right? Correct me when I am wrong, still learning (busy with EW for about a month, however intensively).
Greetings,
W
Wouter,
It depends on the index. In the SP500, we’re in wave 3 of 3. I should get down to at least 2044 before a substantial bounce.
Hi Peter!
Than we are on the exact same page since I have this wave 3 plotted out the same way as you just told me! 🙂 This would mean wave 1 = wave 5. 😉 Have a great evening, bedtime overhere in NL (23:30).
Cheers,
W
Wouter,
Not sure what you mean by wave 1 = wave 5. Wave five is usually 1.618 X wave 1 (if you’re talking about length).
Thanks Peter……..Nick
Interesting comments Peter… enjoyed the TA lesson.