
A Change of Trend
It’s still early to call a top, based upon Elliott Wave methodology. However, here are some facts regarding Friday’s action:
- at 665 points, the DOW had the largest decline since Dec. 1, 2008
- more than eight times as many stocks on the NYSE closed down than closed up
- every single one of the 30 DOW stocks closed down
- 469 of 500 stocks in the SP500 finished the day lower
- in 5 days, the SP500 wiped out 2 weeks of upward progress
- the DAX has completed (or almost so) its first wave down.
AAPL has traced out an extended third wave and is poised to rally in a fourth wave of the first. TSLA turned down after a double-pronged second wave. FB turned down after spiking up in what looks like the final rally of an ending diagonal.
The wave structure of the USD currency pairs I follow don’t support a turn … yet. It looks like the US dollar has one more low to go before all the currency pairs turn. I would expect the turn here to happen as the second wave of the US indices reaches its high.
Oil looks to be topping. Gold and silver are heading down while USDJPY traces out an expected bounce.
Everything I’m seeing tells me a top is forming internationally.
The First/Second Wave Combo
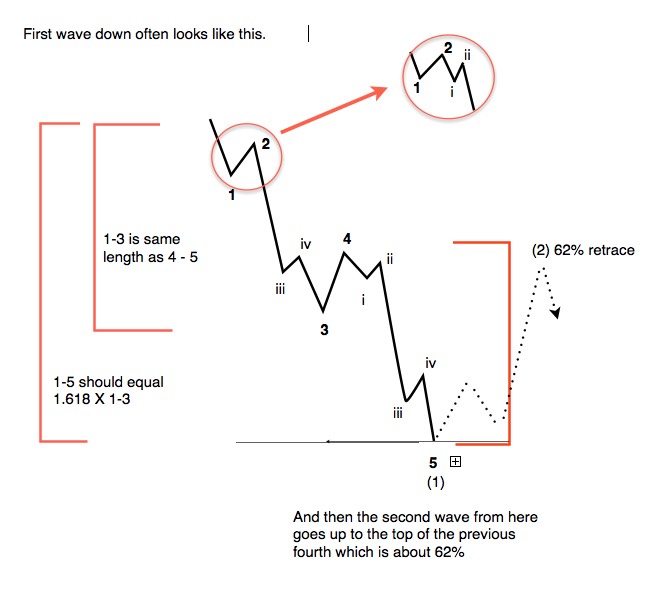
The above chart is not something you’ll find in the Elliott Wave Principle book. This is the typical configuration of a first impulsive wave down, with a second wave shown in dotted lines.
There are certain criteria that are critical in the determination of an impulsive first wave rather than a zigzag (a corrective wave):
- There must be two small first/second wave combinations at the start of the pattern (shown in the inset).
- The third wave must contain a subset of five waves.
- Wave 4 must retrace 38% of the progress down thus far from the top.
The current wave down seems to meet the above requirements. However, a further determinant of a change in trend is the need for a second wave retracing at least 62% with a subsequent drop to a new low. This is what we’ll be watching for over the next ten days or so.
In this week’s Chart Show (links at the bottom of the post), I’ll be providing the targets for entry for the next phase … the 5 year (at least) bear market we seem to be entering.
Turning the Ship — A Process
Let’s look at an update of the US Dollar.
I’ve been maintaining for the last couple of years that once the US Dollar found its low (it’s in a large fourth wave—a corrective wave), that it would mark the top of the US market.
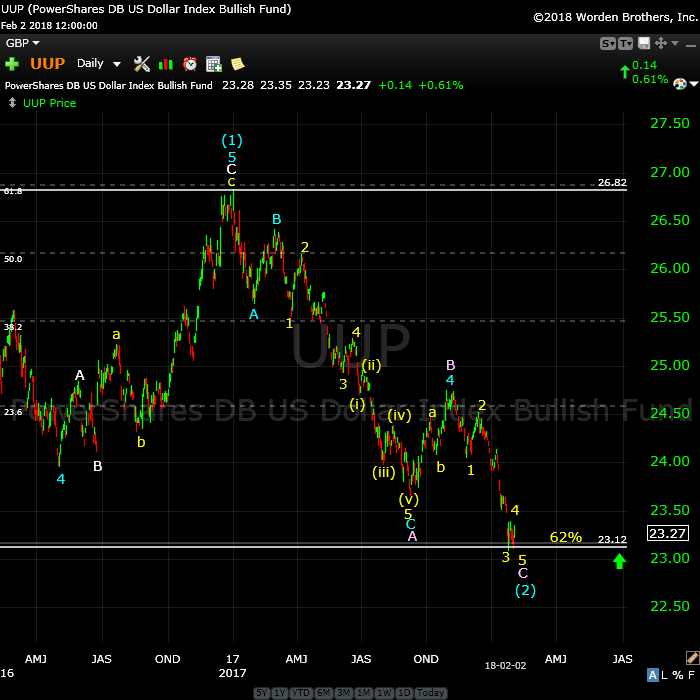
Above is the daily chart of UUP (US Dollar ETF). UUP is representative of the structure of DXY (the US index) and will provide an excellent predictor of the impending top in currency pairs and the US indices.
Last weekend, I wrote here that I was expecting a small yellow wave 4 and then a new low in a wave 5. We now have that pattern in place, but it doesn’t look quite complete yet, although very close. I’m expecting one more small final fifth wave down to conclude this trend, culminating in a turn up and leading eventually to a new high above 26.82 for UPP and a similar new high for the US Dollar.
The movement of the dollar strongly influences the movement of just about everything else, so it’s important to pay attention to what it’s doing on a large scale.
___________________________
The Tesla Train is Confirming a Trend Change
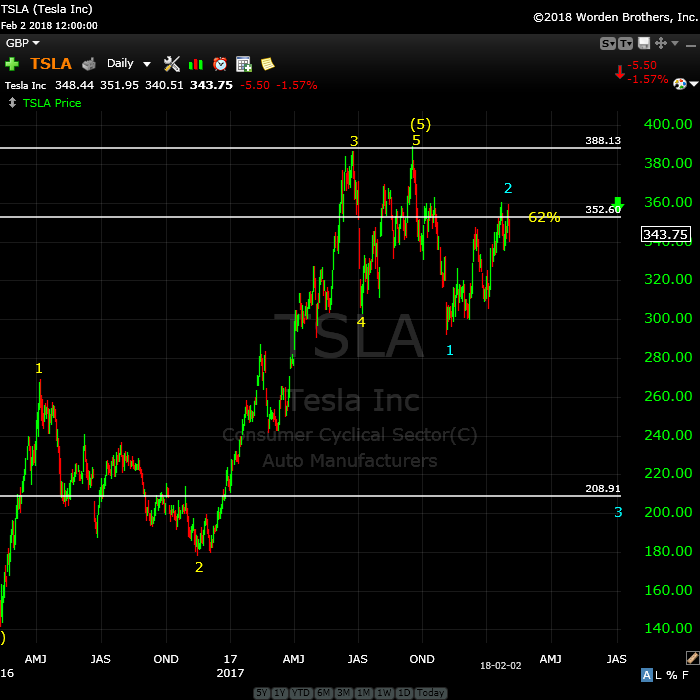
Above is the 2 day chart of Tesla, showing my prediction playing out. The top is not officially in here; we need a new low below ~290.00.
Last week, I suggested we’d head up in a “double-pronged” second wave, which is exactly what we’ve done. We’ve now potentially turned down into a third wave with a target in the 209 area.
There are potential variations to this pattern, but the ultiamate goal for a full first wave down should be below 140.00. (This includes the first and second waves already traced out, a large third wave down to about 209.00 and a further drop in a fourth and fifth wave.)
Apple Continues to Drop
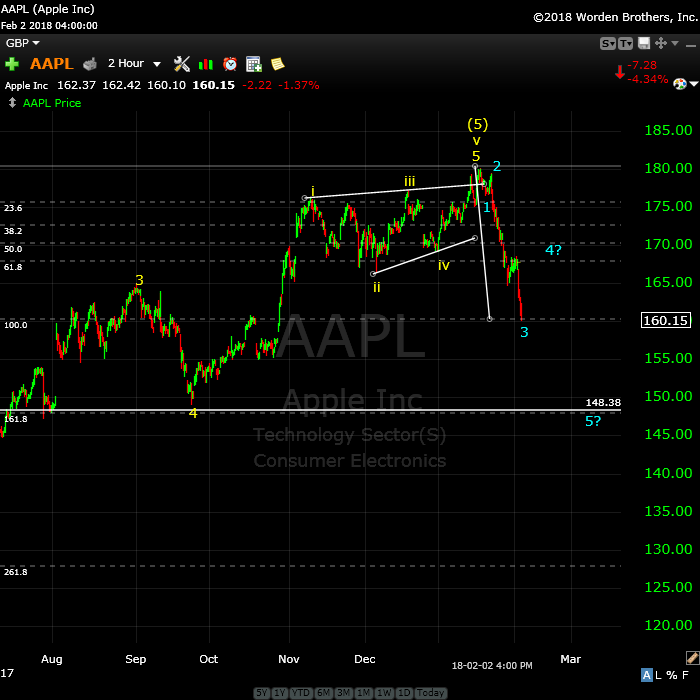
Above is the 2 hour chart of AAPL.
Last weekend, I identified a pending top here, with a third wave currently in progress. We’ve continued down in that third wave to the point where we have five waves down.
Expect and fourth wave bounce and then a drop to a new low. It looks like the target is indeed the 148.00 area, the same target I identified last week.
On Deck: Facebook
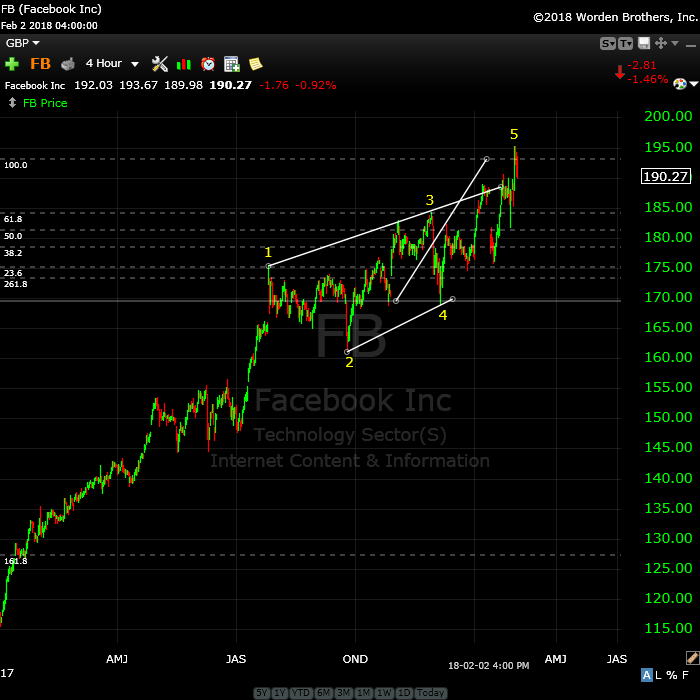
Above is the 4 hour chart of Facebook (one of the FANG stocks). This shows the final pattern I described last weekend, which is an ending diagonal. Ending diagonals gained that name because they form at the end of a trend. You can short a pattern like this when it drops below the lower trendline.
The bigger they are, the harder they fall. This is potentially the start of a first wave down, which should revert back to the beginning of the ending diagonal, the previous fourth wave, around the 145.00 area.
__________________________
I’m Moving (but hopefully, you won’t notice)
This last week, I had a big blow-up with my current hosting service (Bluehost). They have a bug on their server, but they refuse to acknowledge it. The WordPress code on my site doesn’t communicate with their php engine, which we’ve proven, BUT …
… so we’ll agree to disagree, and I’m forced to move the site to another hosting company, which should happen sometime this weekend.
My current site has been tested on the new server and it works just fine (as it does on two other servers we’ve tested it on). I’m hoping that the switch will be seamless, but if the site is down for a short period, that will be the reason.
Registration for Commenting
Want to comment? You need to be logged in to comment. You can register here.
If you register, it protects your information. It also allows you to comment without filling in your information each time. Once you’re registered, simply go to the home page and click on the login link top right in order to log yourself in. Usually, you’ll be logged in for several days before needing to be logged in again.
______________________________
Problem receiving blog comment emails? Try whitelisting the address. More info.
______________________________
The best of them JL 2
The best of them …Last couple of years, I subscribed to several ‘market traders’. You are by far the best of them and the personal contact is awesome. Daily and daily updates are very well written! Besides your expertise in EW, I also like your cycles analysis. Best investment I ever made! —JL |
Rise above the rest … SM 2
Rise above the rest …I have only ever met a few people who, in their chosen fields (astrology, medicine, music, martial arts, technical analysis), rise above all the rest and you are one of them…you have ‘the gift’…and that’s why I’m a Trader’s Gold member. —SM |
Get an upper hand … JC 2
Get an upper hand in trading …Seeing all the different currency pairs and the wave structures and hearing you explain why this has to do that on a nightly bases gives one a upper hand when trading. Elliott Wave applies to all stock and indices and can be applied to any candlestick chart. If someone ask what you want for Christmas – Tell them a membership to Peter’s “Traders Gold!”—JC |
A true expert in Elliott Wave FL 2
A true expert in Elliott Wave …You are a true expert in EW analysis. What you provide is not available anywhere and is priceless. Subscription on your services is the best thing I have ever done. Many thanks for your effort to make me a better investor. I now have more trust in my investment decisions. I hope you will continue the excellent work! —FL |
Have not had a losing week RW 2
Have not had a losing week …I have been with Peter almost a year. The only thing that matters is have I made money with his service. I think I have finally turned the corner using Peter’s EW. I have not had a losing week in the last 5 months. Thanks Peter, for your amazing amount of hard work. —RW |
Couldn’t be happier … KK 2
Couldn’t be happier …The analysis and insight you provide is simply amazing! I’ve been trading the futures and equity markets for well over thirty years and usually average around 5% monthly. Since joining your Traders Gold Service two months ago, that number has better than doubled. I couldn’t be happier.—KK |
Tops in your field DZ 2
Tops in your field …You are tops in your field. Tried to follow Elliot Wave international for years. They were always behind the market. After discovering you, I perceive that you are an expert in reading the waves, which puts you way ahead of the rest of your peers. And you can read the Waves like you are reading tomorrow’s financial section. I pray you stay healthy. —DZ |
the real deal SM 2
The real deal …‘Educational, insightful and thorough market analysis for all levels of traders. It’s Elliott Wave at its best….Peter Temple is the real deal’ —SM |
The Market This Week
Here's the latest daily chart of ES (emini futures)
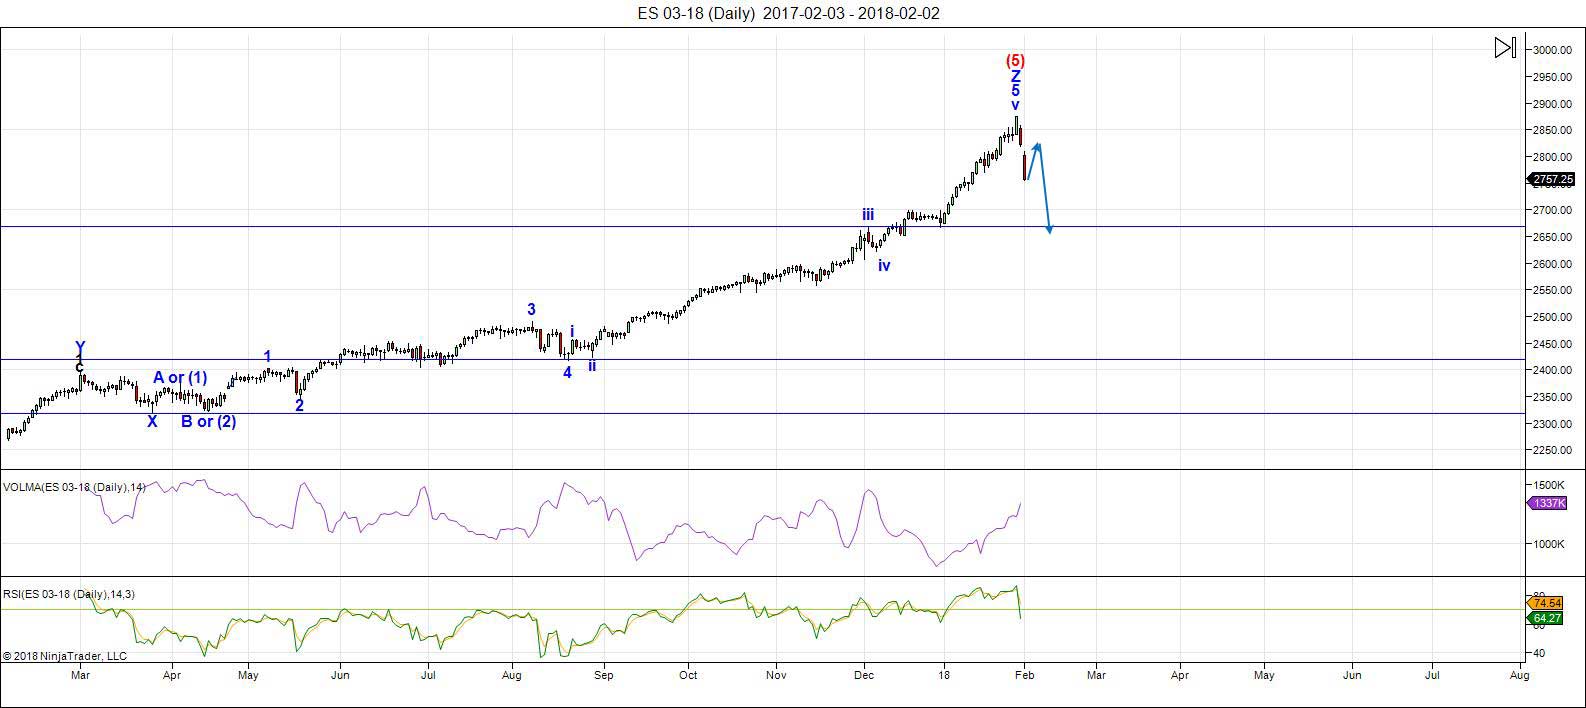 Above is the daily chart of ES (click to enlarge, as with any of my charts).
As predicted, we reached the final high and have turned down with gusto! The methodology does not let me call a top yet, however. I'm waiting for a second wave and a successful drop from there to a new low.
We're still in the first wave down and I expect more downside this weekend to approximately 2730 (my lower prediction for a first wave low). Then look for a second wave probably starting Monday morning.
Volume: It's risen as the "early rats are leaving the ship," as expected.
Summary: We've turned down across the US indices. I can't confirm a top yet, but early signs suggest an impulsive wave down in a typical first wave scenario.
___________________________
Trader's Gold Subscribers get a comprehensive view of the market, including hourly (and even smaller timeframes, when appropriate) on a daily basis. They also receive updates through the comments area. I provide only the daily timeframe for the free blog, as a "snapshot" of where the market currently trades and the next move on a weekly basis.
______________________________________
Sign up for: The Chart Show
Next Date: Thursday, February 15 at 1:00 pm EST (US market time)

The Chart Show is a one hour webinar in which Peter Temple provides the Elliott Wave analysis in real time for the US market, gold, silver, oil, major USD currency pairs, and more. You won't find a more accurate or comprehensive market prediction anywhere for this price.
Get caught up on the market from an Elliott Wave perspective. You’ll also get Andy Pancholi cycle turn dates for the SP500 for the balance of the current month. There’ll be a Q&A session during and at the end of the webinar and the possibility (depending on time) of taking requests.
All registrants will receive the video playback of the webinar, so even if you miss it, you’ll be sent the full video replay within about an hour of its conclusion. For more information and to sign up, click here.


OK red,
here you BE……………………. “bit” coyne!……………..https://invst.ly/6j-a1
Luri, your chart is bullish. Did you know tulip bulbs just stopped trading Feb 1637? Using your term, “Be warned!”
http://www.bbc.com/culture/story/20160419-tulip-mania-the-flowers-that-cost-more-than-houses
During SBUX earnings call, Starbuck’s Schultz said BTC will not be the annointed one.”
liz….liz……”LIZ”………
ahhh……”BE WARNED”!! has been trademark by me! i will send you the bill for unauthorized usage………….no biggie……………. $30k will do!!!!
and the chart IS short term bullish, and medium term very bearish.
i count a wave 1 up………..wave 2 down follows – which can retrace 99.9% or in other words, it can retrace back to the value of….. ………”ONE PENNY”…………
my thoughts – TPTB want to build out the trustless based – block chain….and will do so by using the poster coin of “BIT” as the draw for talent…..it is the cheapest way to build out the technology…………using the old pump and dump scheme for prices…………….
it allows for the public to be immersed in headlines of a vaulting bitcoin prices as the markets crash into their own instability………..in other words……bitcoin “UP”……..while markets “DOWN”……….potential new correlation………
after the build………….TPTB will crash prices, and co opt the technology for a digital currency based world…………………………….. this is their playbook, which they have used over and over again…………………for reference – see internet bubble………….
now about your outstanding balance……………….[cough]………
Luri,
I just transferred 30k kodak coins to your Mt. Gox account. Enjoy. 🙂
Remember the 3D printer stocks ddd, ssys, xone? Last good high was early January 2014. Where are they now?
One 3D stock cnbc didn’t pump was PRLB. Where is it now compared to the then more popular 3D stocks? I want to know which crypto is PRLB and based on what Schultz said I don’t think it is btc.
Trying to reply to Luri but it jumps down to LisH’s chat. Strange.
liz,
payment received…………………and bitcoin has the cache! it has the branding!……….they are using it ONLY for this….to draw in the talent…..
i am unsure what will be ………………….the most popular……………..being “popular” is overrated!
Nice
Thanks – time to load up
If you ever had any doubt regarding the incorrigible stupidity of the crowd there you had a stark example. Some no doubt ignored the VIX gap higher at the open yesterday, indicating that some informed traders were prepared to add hedges at market price….always revealing. I guess some folk whining about the fact that they did not see that carnage during the session forgot that these animals re-balance DAILY. Staying in those short VIX ETNs overnight after a day like yesterday was an act of monumental STUPIDITY!!!
Judging by a few long upper wicks that showed up in VIX yesterday, we apparently even had a few complete morons trying to short volatility in in the middle of the blood-bath. The banks have turned market participants into raving lunatics.
I talked to a friend who manages brokers at Schwab this morning and they have been spending a lot of time making calls to customers to give the bad news about margin calls. He said it is not a pleasant experience.
Verne — Twitter FredJeans told me to always watch the $VIX : $VXV IF @/> 0.91 — the bears in charge. well…looked at the data I’m daily collecting & the 0.9196 appeared last Monday Jan 29, 2018 at the close and subsequent days @ 91+
and I should have known .. I keep track of it daily, amongst other data & also SPX + SPLV both made NEW 52wk HIGH on FRI Jan 26, 2018 — normally indicating one of the TOPS in. normally.. NOT BOTH make NEW 52wk HIGHS on SAME day.
anyhow rookie mistake.. could have picked up some VIX calls.
made fun of Feb being a Valentine Massacre — didn’t look at the signs closer to Feb and NOT feb 14.
feel for those traders .. recall my rookie year 2000-2001
noon time ………….what’s on the menu verne??
napalm??……….?? :-)) https://invst.ly/6k0gl
Looks like Mr. Market is prepping some bull chops in today’s furious and oh so typical furious reversal. No doubt the masses are merrily singing ” Happy Days Are Here Again!” Never mind the blow-up of the short vol trade and the implosion of XIV and SVXY. I am now expecting a mad upward dash toward the overhead gaps. I am holding a few DIA 260 calls left from a bear call spread that I would not be surprised to see return some coin the next day or two…
the correlations driving me crazy… don’t know — but methinks now that the SPX & equity markets tied to Bitcoin and to some extent OIL .
using $NYXBT : $SPX and see
15 Nov 2017 of 2.81 resembles yesterday’s close of 2.79.
but the TOP was on Dec 18,2017 @ 6.96 –around same date Bitcoin hit its 20K/there about — depending which house/currency report…and started correcting
…yet they jammed SPX higher rest of January until the 26th
most of you must have read this on $XIV by now
http://howardlindzon.com/struck-black-swan-course-markets-turmoil/
don’t know about SPX / markets recovery yet… think Feb is a reversal/mirror image of what happened in January 2018.
am basing on what I’m seeing today, so far..
OIL has to hold 63.64 area otherwise 62.81 & 61.98 coming fast
GOLD today SHOULD HAVE ROCKETED w/the carnage this a.m. — but no go — IF we to buy into the narrative when markets down — gold up, etc.
BITCOIN/BIT_CON — the $NYXBT : $SPX — down today @ 2.61 down 0.17
$BPSPX at 56.40 – day low & close .. am thinking 50 coming or maybe 20 if big flush
$VIX : $VXV closed @ 1.276 [ -0.051] the high @ 2.120 & day low @ 0.945
…was expecting < 1.00 close to day low & also saw $VVIX crawl back up at close to the 161 area as SPX was climbing
Day High 181.59
Day Low 140.66
52 Week High 05 Feb 2018 203.73
52 Week Low 17 Mar 2017 71.75
What this fellow did amply demonstrates he has no clue how these instruments work, and that they are re-balanced daily after market close, namely overnight. Not only was it incredibly foolish to do it after a move like that in VIX, he did it with no evidence whatsoever that VIX had topped and reversed. It needs to move back below upper B bands before being safely shorted…absolutely incredible…and lemmings followed his lead??!!
Verne ? Howard Lindzon — he’s the creator of StockTwits. lol… but on another note — Credit Swiss’s XIV ETN should have NOT been allowed to be traded by the RETAIL markets. that’s just my 2 cents. look how VIX’en familia was held back for how long — months and many traders even stated that it hasn’t worked for…get this — 3 years. ring a bell ? Aug 24, 2015 — 2015 being 3 years.
going to be an interesting February.
sorry Verne..my mistake .. Howard Lindzon is the co-founder of Stocktwits.
https://en.wikipedia.org/wiki/Howard_Lindzon
There is something very fishy about those volatility ETNs. Despite the numerous reverse splits, UVXY should have exploded far higher based on what happened to SVXY. Clearly these things are nothing but wealth destruction instruments. What happened to traders holding SVXY and XIV was criminal, plain and simple.
The only time I traded them was to short ’em.
This is the new site – it looks the same as the old site. Right now, there are two in operation as the name server changes update on servers around the world. This new site does not display the login problems of the old site … finally.
As the sites switch over, you may see some previous comments disappear from the blog.
How long before the bulls, as predicted, crawl back out of their hidey holes to yell: “BULL!!!!” 😀
Welcome … on the new site, emojis at back!
Thanks Peter, for all the effort you have done.
I think we have seen the recovery top and we will go down into 8 or 12 feb.
🙂
I popped in a few times early a.m. and got the transition message. Glad the move went sans hitches!
There were hitches, just nothing catastrophic. I’m noticing now that all my version on all 4 computers are updated to the new site, so we should finally all be on the same page. That just happened a few moments ago. There may be some stragglers, but for the most part, we should be a go on this new site version.
Peter, just attempted to respond to you via email…received the following notice:
Sorry, we were unable to deliver your message to the following address.
:
550: relay not permitted!
I don’t know what that means, but I haven’t changed anything in email. However, I was having all kinds of problems on the Bluehost site and it may have to do with email, as well. It also depends on when you sent it. It could have got caught up in the transfer (I wouldn’t think so, but there’s a not of weird stuff going on). I have to get totally away from Bluehost, but that take another couple of steps, which I should complete during the next couple of days). The website change was the big thing, at the moment.
Try again, and if that’s an issue. I’ll give you another email address, but I’m still getting emails, so I know I’m still online …
I notice this new site is super fast.
Yeah, I am having problem with the worldcyclesinstitute.com address. I’ll have to call in an see if I can get that fixed. You should be able to use peter@petertemple.com in the meantime.
today’s high (so far) of 2727.67 corresponds to Jan 5, 2018 day low of 2727.92
the 2727 area hit previous day (Jan 4, 2018)
meanwhile they playing the VIX’en Familia like a violin. even $BPSPX dragging its feet. think they’ll be doing a slow grind to the upside.
meanwhile — watching $VVIX IF it closes < 150 and also IF they can somehow squeeze the $VIX : $VXV < 1.00 — yea.. know the day low (so far) 0.983 — the line in sand is < 0.91 for the bull side
$SPX
Emily,
Now you’re on the new site. I think luri is still on the old site. It’s taking a really long time for these name servers to update.
lol… new site ?? Peter ? the ONLY way I go to your site — I 1st go to your twitter account :: https://twitter.com/worldcyclesguy & click on your latest tweet/blog 🙂 — and then figured out (the dummy me) to look up @ RH corner & Log In. lol — last time I was trying to just put my name “Emily” and that’s how I got confused — NOT reading properly instructions — only had to go to “Log In” lol .. am sssslow many a times. mind’s in 10 different places. that’s MY excuse 😉
thanks Peter T ! 🙂
Same site, different location. All very complicated. Like everything these days … 🙂
ok 🙂
SPLV MY NUMERO UNO INDICATOR for the D.A.I.L.Y. movement of SPX
SPLV 46.60 +0.31
SPX 2,703.91 +8.77
VIX 23.89 -6.09
VVIX 152.81 -8.31
RVX 20.91 -3.05
VXN 23.35 -3.35
XIV 6.22 -1.13
VXX 43.35 +0.47
VWB 23.09 -3.10
VWA 24.70 -6.90
VIF 23.31 -4.86
VIN 23.90 -6.78
VSTF 25.91 -13.21
VSTN 31.43 -9.94
VXST 25.88 -13.58
See more in Watchlists
As of 07 Feb 2018 at 3:21 PM EST.
testing…………… ‘1’………….’2’…………..’3’…………..
am i live???……………………….or have i been sent to coventry?……..
so – if i ……”AM”…………live……………..what does that make all of you???????
oh yes…………….so NONE of you saw my chart postings?? NONE of you saw my “crash” warning @ 50% probability?? …………………………none!!!!!!
gadzooks!
WELCOME!…to Erebor…home of the king under the mountain! 🙂
crash warning – 50%……………………
“BE WARNED”!
https://invst.ly/6kmwe
short term ES update – https://invst.ly/6kmxz
ok.. I’ll bite luri — we seeing 2640 in the horizon ?
am looking @ yesterday’s data & using DeMark levels —
the SPX
R1 = 2752.075 – which is considered a BUY signal
P = 2672.5725
S1 = 2644.105 [ Sell signal]
closed ABOVE the P @ 2681.66
SPLV DeMark levels ::
R1 = 47.035
P = 46.0675
S1 = 45.695
closed @ 46.22 > P
$VVIX closed @ 159.03 ABOVE its S1 of 150.89 BUT Below its P of 166.24 — the R1 = 191.82 TODAY’s range :: 142.97 – 163.79
$BPSPX closed up 0.60 @ 57
I can go on & on & on… but won’t …cause I know many of you here don’t follow my indicators. but this is what I’m seeing. still maintain we grind up higher & the VIX’en Familia teasing many…and its just plain fibonacci levels being tested.
Em…….
what good are “ears”…………if one is unable to hear………….
what good are “eyes”…………if one is unable to see…………..
i see only what the charts reveal to me………………. and that is a 50% probability of a price dislocation in the ES to the 1900 price level…………..
https://invst.ly/6kmwe
i am seeing zigzags down for C…………….like this………….https://invst.ly/6knvv
“BE WARNED”……….
ha ha… luri ? you calling…moi ?? deaf, blind & dumb ? 😉
ok.. looking @ your charts, which btw — have taken screen shots of your charts/work & some others here – including Peter T’s. am not used to the fancy EW most of you guys doing here. am open-minded to any possibility. learn something from everyone here 🙂
thanks ! 🙂
em,
my words were directed at……and, toward ……….me………………….
i attempted to say, “if i am unable to hear/see what the charts are telling me, then i am blind – and – deaf……………………….
🙂 never will the luri be your critic………………………….
watermelon is my emoticon.
nonplussed is my color……….
If watermelon is your emoticon, “persimmon” should be your color…
Yeah. Blows one’s mind doesn’t it? That people can look at that spastic market behaviour and continue to pretend that this is in any way normal. It did not take them long to sttar crowing about the market “recovery”. Market participants have now become so callous, that they cannot recognize a “shot across the bow” even when it comes right up bites them in the you-know-where. I know…”mixed metaphors”…so sue me! VIX had its most explosive intraday move ever recorded. Some bloke in Singapore lost one million in XIV. Even traders who should have known better piled into that titanic on the eve of destruction. And it’s back to business as usual??!! This goose surely is cooked….eh?
only greens from the VIX’en FAMILIA — VXX & VSTN (near term)
SPLV 46.22 -0.07
SPX 2,681.66 -13.48
VVIX 159.03 -2.09
RVX 22.36 -1.60
VXN 24.73 -1.97
XIV 6.23 -1.12
VXX 44.57 +1.69
VWB 25.98 -0.21
VWA 28.75 -2.85
VIF 26.04 -2.13
VIN 27.60 -3.08
VSTF 33.03 -6.09
VSTN 43.42 +2.05
VXST 32.86 -6.60
VIX 27.73 -2.25
See more in Watchlists
As of market close 7 Feb 2018.
also of some interest ?
“Yesterday’s low had high volume and most high volume lows are tested before rally to new highs. $SPY $SPX $Dow $NDX $qqq”
https://twitter.com/OrdOracle/status/961353722822643713
also this might be of some interest — the 4 charts ?
4 Instances in history when a wicked “correction” like this took place in the stock market. http://www.gannglobal.com/webinar/2018/01/18-02-07-Video-Offer-Is-Open.php?inf_contact_key=190c0e0eebd8d03d2120115355751abed698fcbee2d0df6b734aee47d1ed5e47
am not pimping them — just sharing info
oh yea..
$NYXBT : $SPX is up 0.45 @ 3.06
& yes… $VIX : $VXV STILL > 0.91 — but now am doubting it .. for next couple of days. could be wrong… saw VWB (bid for VIX) bidding higher @ end of day… but these VIX’en instruments can flip in a 2nd. was just observing the NEAR term volatility w/ the VSTN — didn’t see VSTF (future volatility) jumping. so this is what I’m basing on.
we shall see tomorrow 🙂
luri … can’t seem to reply to your post/reply to me. seems system not allowing it ?
anyhow — yea… gathered that. 🙂
I see futures red… right now
2650.25 so far low
https://www.investing.com/indices/indices-futures
ES afterhours update – https://invst.ly/6koz2
we shall see soon if my warning was “warranted”, or a persimmon!……..
CONFUSED——Is what we have experienced for the last 9 years the autumn of the K wave??? Is this why gold/silver have been trading dogs??? SO, IF this is a k wave top, is it not supposed to start with a crash??? Or, as peter said, 5 waves down??? If k wave top, will the winter cause gold/silver to become fashionable??
some twitter is seeing 2620 as a magnet in the futures tonight.
got this — might be of some interest re Bitcoin & astrology for this month:
“So here my prediction: Bitcoin, BCH and ETH will rise today. But on February 8, they will start falling. February 12 will be a strong down-day (all coins will lose more than 10% in value) and buy February 14 at the latest, we will see significant lower prices. So, do not invest in cryptos before February 14 as further declines are IN THE AIR.”
http://archive.aweber.com/rosecast/7aI2i/h/Cryptocurrencies_Astrology_.htm
Trying not to be conspiracy theorist here, but on Friday 2nd when MSM reported market down by 666. we all know it was 665.75. Bear with me.
Market Drop 666 points (we all know what this means)
Feb 2nd 33rd day of year (Masonic symbol)
2018 2+0+1+8 = 11 (Masonic symbol)
Just sayin
charles……….
my good fellow…………….thine hast “eyes”………..and can see!!!
verne!! wake up!!
here is your coffee, and here is your morning ES update…………….. looks like “nests”….. [cough ….1-2, i-ii]
https://invst.ly/6kxbp
better shot……………..lens and all that…………https://invst.ly/6kxfi
Retracement
138.2% = 2663.904
161.8% = 2653.015
so far :: Day’s Range: 2,663.12 – 2,684.48
your 2620 coming, luri 😉
think the 2650-53 area has to hold otherwise more downdraft.
am looking @ the VIX’en Familia — they teasing & in a tight range — none have gone above their R1 DeMark levels which gives a BUY signal in this family.
am looking from the VIX (29.685) Bid => $VWB (28.175) to $VVIX (161.41)
..none have (so far) gone @/above their R1
sorry — the VXX only one above its DeMark R1 of 49.985
SPLV 45.96 -0.26
SPX 2,654.89 -26.77
TWTR 31.38 +4.47
VIX 28.53 +0.80
VVIX 160.84 +1.81
RVX 22.95 +0.59
VXN 26.27 +1.54
XIV 5.57 -0.66
VXX 50.17 +5.60
VWB 27.65 +1.67
VWA 29.39 +0.64
VIF 27.46 +1.42
VIN 28.72 +1.12
VSTF 30.48 -2.55
VSTN 31.80 -11.62
See more in Watchlists
As of 08 Feb 2018 at 10:53 AM EST.
2647.62 — Dec 8, 2017 day
today’s day low (so far)
..let’s see where we close. am watching my usual indicators SPLV
not much of a spike in the VIX’en familia — their 52wk highs were made on Monday & Tuesday. today’s Thursday
also see many bulls now going bearish — calling for 2100 — some 1900 — hell… why not 1810.10 ? lol
capsize da boat 😉
haven’t quite figured out — what the ALGO machines are following — oil, crypto (Bitcoin) Bonds, gold ?
or just some old-fashioned fibonacci #s
careful using VXX — know most gurus & divas use it — buttt take a lesson from what happened to XIV ::
https://www.benzinga.com/general/education/18/02/11151739/one-of-the-creators-of-the-vxx-explains-the-problem-with-many-volat
sorry — 4got to add the R/S History of $VXX
VXX Reverse Split Number 5—August 23rd, 2017
https://sixfigureinvesting.com/2013/08/next-vxx-reverse-split/
from: https://www.google.ca/search?source=hp&ei=Ln58WoS9AYXdjAPykooo&q=vxx+etf+reverse+stock+split&oq=VXX+etf+re&gs_l=psy-ab.1.0.0i22i30k1.1152.15616.0.18317.10.8.0.2.2.0.97.465.8.8.0….0…1c.1.64.psy-ab..0.10.479…0j0i131k1j0i10k1.0.X1Y9ENuGQqI
XIV
How Does XIV Work?
“Credit Suisse has terminated XIV due to a greater than 80% drop in its indicative value on 5-Feb-2018. On 15-Feb-2018 the final payout value will be published. I’m guessing the final payout will be somewhere between the 5-Feb-2018 IV close of 4.2 and 21.8 (20% of the 2-Feb-18 IV close of 109.4). For more on XIV’s termination see this post.”
https://sixfigureinvesting.com/2014/05/how-does-xiv-work/
the chatter is the 200 MA on SPX which is around 2538 area b4 turnaround.
that’s Oct 4, 2017 day level. … before we make an uptrend move / or we just watching that level …IF it comes to fruition. there are so many trillionaires in the markets. don’t know why they trying to help us. lol
take the time to……………….”look”……………….
https://invst.ly/6l0ud
lol… am looking luri 🙂
ok.. we shall see. 😉
myself — am watching the 2627 area — like the 2727 area of yesterday — thats about 100 points down
2602 area is where I think we move to– bottoms in. shall see…cause those VIX’en Familia not spiking — making NEWER 52wk HIGHS — which I find suspect.
2602 area has to hold — if not — think 2530 b4 we zoom up ?
this is like January — where everyone bought the dip and here’s February valentines massacre (depending which side of the gun you at) doing mirror image — everyone encouraged to short the markets.
agree w/Francis here — he’s also into the moon cycles ::
https://twitter.com/AstroCycle_Net/status/960745735217139712
seen some pundits now thinking equity markets trading along side of Bitcoin.
remember that $NYXBT : $SPX the top
am waiting for the bottom — for the crying b4 the buying
I know some of you follow that Sven / Northman dude who’s now in his glory cause he called this carnage since 2013 while missing all the upside… he’s stating that VIX @ 25/> = bear market
Time – Price – Research
http://time-price-research-astrofin.blogspot.ca
many go there for their GANN, moon phases, etc fixes
pundits keep stating “inflation – inflation” – just like the snowflakes keep saying “Russia-Russia” collusion. lol… but have you noticed GOLD price skyrocketing this past week ? should be like 1500 at least… but its barely moved…which tells me its NOT inflation-inflation bullshit — but something behind the scenes — the BANK (nasdaq) hardly melting down — neither’s Goldman Sachs stock (GS).
there’s some disconnect — or maybe not ? looking at all the talk in the latter part of the year 2017 — re BITCOIN and it was weird — it made its high in Dec and a month later the equity markets made their tops b4 the downdraft.
am trying to find some type of correlation cause no way stock markets taking such a downdraft. yea.. I know you guys doing EW & every mother, father & child is touting their #s – be it fibonacci or just dreamers #s.
feedback would be welcome. want to hear everyone’s opinion as to why such a market meltdown.
tia (thanks in advance)
i posted a chart for bitcoin for red………….em……………………
i will repost an update………………………https://invst.ly/6l3os
for the public record, because of the massive scale – i am using heikin ashi candles to eliminate some noise…………
thanks, luri ! appreciate it ! 🙂
so am gathering you possibly in the camp of BITCOIN : SPX / equity markets correlation, eh!
if you get a chance — can you do one for OIL ?
I see its down today — some correlate the markets to Oil.
…and while at it — throw in the USD … lol… sorry — couldn’t resist. don’t like putting pressure on anyone here. I just like to get everyone’s feedback — to see what they seeing, etc.
thanks again !
em –
correlation = bitcoin “UP”/ equities “DOWN”…………………………
best to follow the turning US dollar…………………. and you will know all the correlations…………… Dollar/bitcoin up – everything else down……….
watermelon “UP”………..!
BITCOIN UP – equities DOWN ?
is that what you follow the USD ? not the OIL …also ?
ok..
thanks.
Thanks Luri – if a couple of banks fall over then BTC will go Ballistic.
Deutsche Bank could be the first.
y’all
end of day ES…………..https://invst.ly/6l42m
close up ………………………..https://invst.ly/6l43s
now listen up – sale on vienna weenies – the ones in the can,with the pull top lid – 25% off this week only!!!
Nice!
Anybody heard how the BTF dippers are faring these days? 😀
I’m having all kinds of ridiculous fun selling the rips. Do you know what kind of “moolah” can be made with thousand point range days if you are right about the REAL trend?? Beautiful, beautiful volatility!! Yowza! 🙂
Luri,
BTC on the bitstamp chart, can’t go over yesterday’s 8649.
Yang earth dog by next Friday. Be warned!
It was a bloody day 3 days before Christmas and…
3 days before Heart Day is 2/11. ?
hmmmm…..LIZ………..
you speak of “wu xi” the yang year of the dog, and the chinese lunar calendar new year…………………..
perhaps we should invest in ……………………”band aids, and gauze”………..
Unfortunately, BTC has been relegated to the “periphery” as per my attention……………………… as the ES has my full attention right now…..
although…………..i stand behind my chart ………….https://invst.ly/6l5z9
I only see the read line Luri and 2947. 🙂 Hmmm…2+9=11, 4+7=11
Liz…..liz……..liz………….
:-)) the red line is the “overlap” line whereby if crossed – 4 will overlap 1…
do you want “overlap” liz……………hmmmm?
although you have very keen eyes…….i completely missed the 111 connection to that red line!!…..excellent – thank you.
ok… this is the 1st time I’ve seen $BPSPX go down in ONE day. lol
…it’s DOWN 24.00 @ 53.00 now. I’ve stated that 50 is coming — the 50 was made Nov 4, 2016 — before the election.
something to think about as to if the low’s about to come. otherwise we looking @ June 27, 2016 @ 48.05
next on deck:
23.20 = Jan 19, 2016
22.20 = Aug 24, 2015
well… I had the WEEKLY reading on that damn $BPSPX chart. 4got to change it to the daily. anyhow — its down 3.20 @ 53.80 — so yea.. still looking @ 50 for “line in the sand” so to speak — bottom ? shall see.
watching some technical videos — reading other traders thoughts…seems like a replay of Jan 2, 2018 — but a reversal. looking at the option activity here also — recall many were asking when the bleeding was going to stop and then saw some call buying the Jan 19 2018 expiration– on many stocks. November – December felt like the world was coming to an end on many tech and some bank stocks.
we might just end up consolidating for awhile with bulls & bears nipping at everyone’s toes.
All roads lead to 200 day SMAs. Thank You! And You’re Welcome!
Good Evening!
hold on, padre !! all roads, according to WD GANN leads to the 144 MA – where PRICE + TIME squared/meet …which right now is @ 2585.52 which we hit today. lol
the 200 MA = 2538.10
I’ll take it, but I do expect us to penetrate 200 in a classic reversion THROUGH a mean correction owing to its long delay…
/ES hit 200 sma last 2/5 around 11 pm est. SPX didn’t print a hammer candle today. So yes bias is to retest that low. If it goes below that then it broke through the uptrend line from Jan & Nov 2016.
ok… I see — 4got about the ES_F . thanks, Liz !
https://www.youtube.com/watch?v=vSyFxYT_8EI
that was a great video — thanks for sharing !
“Pretty good odds we have an #SPX low on the 9th or 12th and rally into the New Moon of the 15th. However, lows 3 days before a New Moon can be quite deep.
https://goo.gl/GJkxpe
We are not as oversold as Feb 2016 and we could see new lows near the 20th
https://goo.gl/Xur2ZV “
https://www.rickackerman.com/wp-content/uploads/2018/02/Decisive-breach-of-p-could-send-ES.jpg
morning …………. “peep”les!!!
by calling you “peep”les……………. it would infer that you are all my…………”peeps”!
consolidation at the lows…………..such price behavior is usually associated with a “continuation” pattern https://invst.ly/6lduw
Better than “sheeples!” 😀
The first Wave Down (I don’t know how to publish this(-old analist :-)))
i-8/2, ii-9/2, iii-14/2, iv-16/2, 3-(20/2), 4-(22/2), i-(26/2), ii-(28/2), iii-(5/3), iv-(7/3),
5-(12-14/3).
I have sent it to Peter. But he has a lot on his mind. So if someone could help me to publish my pictures we could all benifit.
Today we make a HIGH but following the first wave down principle it must be a lower than before. (2.727,67 – very HIGH now we are on 2610)
ok willem, i will put your dates to a chart for you…………………..i will post it when i am done….
Willem,
you have the dates listed out for w1 [i-8/2, ii-9/2, iii-14/2, iv-16/2]
w3 [ 3-(20/2)]………. only one day??
w4 [4-(22/2)]…………. only one day?
w5 [i-(26/2), ii-(28/2), iii-(5/3), iv-(7/3),
5-(12-14/3)]
is w2 only one day also??
Yes there is a panic – You can see it happening the weeks before.
Hi Juri, Thank you,
The dates between () has to be confirmed by other indicators. Timespan 1 month. But every week an update
I think we have seen the High today on friday 2614- (not certain)
ok thank you willem………..i will do my best………
watching $BPSPX now down 1.60 @ 52.20 — the 50 is what I’m looking for – IF it hits today. confirmation (for me) that the low’s in.
am also basing on the fact that the 144 ma where GANN price + time squared yesterday on the SPX @ 2586 area. we shall see if the 200 ma of 2538 area gets hit today/next week.
DeMark levels for SPX
R1 = 2633.135
P = 2606.8975
S1 = 2528.525
VIX for those who watch it like a hawk: DeMark
R1 = 40.695
P = 32.5525
S1 = 28.935
Em…………….low in??
for context………….this is how egregiously they pumped up this market.
still, historic difference between 34 month moving average AND prices.
perspective is important.
https://invst.ly/6lf9q
I don’t know luri — am just following MY thesis.
seems beginning of year – January… all were drinking same Kool-aid – everyone trying to outdo the other w/their Picasso charts & paint-by-numbers…finally sinking the ship. now everyone’s gone the other side of the ship. what do you think the outcome will be, eh! 😉
like I said — don’t know — just following some of MY indicators — but still looking at the other side of the boat — how the captains are doing sailing their Titanic 😉
just kidding ! 🙂
right now $BPSPX is at 51.60 .. 1.60 more to go ? 😉
also looking @ my SPLV along w/the VIX’en familia — their DeMark levels
this is from Mark Newton — I just entered in the “Twitter Search” box :: ” $SPX GANN ” and found him stating 23 hours ago:
“13 cal days since the 1/26 $ES_F $SPX FUT top, or 45 deg Angle on #Gann SQ 9.. from 2874.50.. Looking for prices which line up on this same angle.. we see 241.. so 2874.50-241= 2633.. 90 and 180 deg angles to this would arrive at 2619 and 2601 for $ES_F ”
now you see the “significance” of 2633 area [ also DeMark ] today
$BPSPX now 50.60 — .60 more to go ? lol
$BPSPX now @ 49
spx, qqq, dia got the lower low with a potential for a swing low hammer today. May just be a dead cat bounce.
OK EVERYONE……
here is Willem’s “time chart”………….remember, this is a “time chart” for low’s and highs and projected out to potential points on the first 5 waves down.
willem…………is time chart ok? is this what you were looking to create?
https://invst.ly/6lgko
for the public record willem………………..i have your time chart saved, so i can post at anytime with the updated results………………………..
your predictions are now part of the public ” time charting” record………………….!
Thanks Luri. Well, the real bottom is probably when Jamie says he bought an additional 500k shares of his stock.
thanks for posting Willem’s “time chart”, luri …I’ve taken a screen shot 🙂
Hi luri, Thank you for your effort. I am stil learning about the waves. I have open an “website” where I can put the chart and now the chart “first 5 waves down”.
http://prognoseus500.simplesite.com/
I hope it is working well.
My indicators – S&P500 – between [ ] look on the “first 5 waves down”.:
29 jan High(2880 in the early morning)
6 feb Low [=1]
7 feb High [=2]
8/9 feb Low [=2 i]
9 feb High [=2 ii] -and starting to go lower High 2.638 and present 2618- A big decline in to 14 feb
14 feb Low [iii] – this must be a very Low with a free fall on Teusday
16 feb High [iv] a little recover from the 14th
(20 feb Low [3])
(22 feb High [4])
(26 feb Low [i])
(28 feb High [ii] a big drop)
(5 mar Low [iii])
(7 mar High [iv])
(9-12-14 mar Low [5])
Between ( ) are not confirmed yet. Next week 20,22 an 26.
It must be an coincidence that the “first 5 waves down” have the same pattern to 16/20 feb and maybe further.
If that is thrue….. fasten your safety belts?
Wishfull thinking perhaps but until now it is correct.
oh yea.. $BPSPX now @ 45.60 — down 8.20
am thinking if the 2220 some predicting — we’ll see 22.20 of Aug 24, 2015 plunge / Jan 20, 2016 23.20.
ES update – close up look…………….https://invst.ly/6lh2t
of some interest ? this caught my interest just now on the VIX’en Familia — his take on the instruments:
https://twitter.com/bxk259
I get more info from those hardly followed. they low key & don’t look to others to be pimped on the net.
so far.. 2551.91 — not the 2538 – the 200 DMA most looking for
$BPSPX now 45.40 — yea.. know 99% of you sick & tired about it.
anyhow — was good cat bounce on some momentum high beta stocks. not chancing anything these days. in & out 🙂
another look at that purple down channel …………otherwise called an elevator shaft!
like alice in wonderland – do prices fall down that rabbit hole? errr…elevator shaft.
https://invst.ly/6lhfp
call me crazy — but methinks we going to see 2702.78 on Monday/tuesday ?
$BPSPX now @ 40.40 down 13.40
last time $BPSPX was around 40.40 area — 17 Oct 2014 — 40.60 was the low
ES did a double bottom, which is a clue that we’re going to a brief new high. I mentioned this in the Chart Show yesterday. The double bottom needs to hold, though, for that to be true.
how high you think we go, Peter ?
Just a new high, but I don’t have enough info. I need a confirmed first wave. It will likely go up in five waves.
ok… thanks, Peter !!!
This wave is only correcting the final fifth wave up, so it’s not a major fourth wave; it isn’t large enough. Everyone will let out a big sigh of relief (somewhat short-lived, I would expect).
Thank you Peter!
we’re being yanked back & forth — am watching Rick Ackerman’s P of 2572.88 — IF it closes there abouts– then methinks my 2702.78 comes to fruition.
VIX hasn’t made a NEW 52wk HIGH since Tues Feb 6, 2018. neither have the other VIX’en familia… so its suspect…given the new lows this year.
changed to wB of wB
https://invst.ly/6lipi
This website is for educational purposes relating to Elliott Wave, natural cycles, and the Quantum Revolution (Great Awakening). I welcome questions or comments about any of these subjects. Due to a heavy schedule, I may not have the time to answer questions that relate to my area of expertise.
I reserve the right to remove any comment that is deemed negative, is unhelpful, or off-topic. Such comments may be removed.
Want to comment? You need to be logged in to comment. You can register here.