
Update Friday, March 18, Before the Open
We look like we’re completing a very small wave 5. I would be looking for a top this morning and by the looks of things, it may be within the first hour or two, if not immediately.
Each of the waves in futures this morning are tiny and each successive one appears smaller than the last.
_________________________
Update Thursday, March 17, After the Close
The vigil continues ….
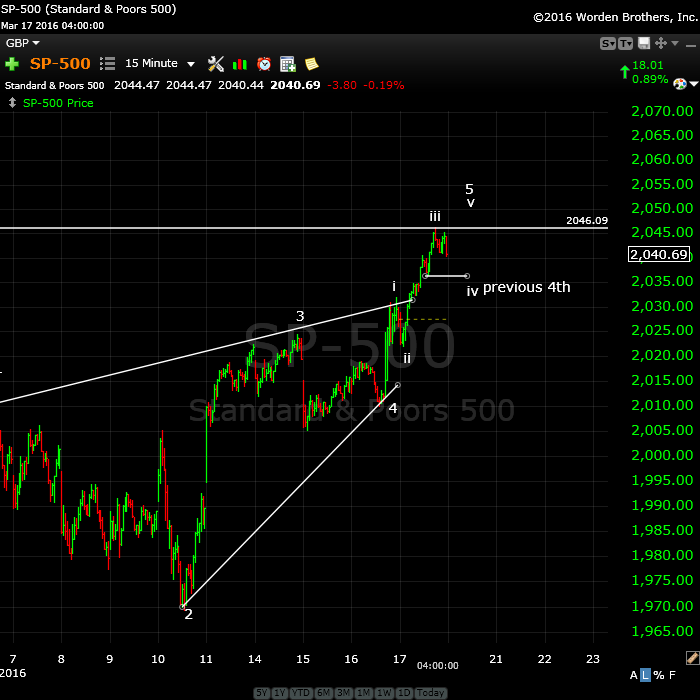
I know this is making us all crazy, but we’re really, really close. Above is a 15 minute chart of SPX. Looking closer at this final wave up, it appears after all to be not quite complete. The wave down in the afternoon is not motive and it seems to me that we have a 5th wave up to go. I note that the third wave up in SPX (wave iii) is actually much shorter than it should have been under the above count (it’s about the same length as the first wave (wave i). It’s actually just a little longer.
So the waves are progressively getting shorter, which often denotes an impending top. I would expect wave 5 then to be short.
I note that IWM (Russell 2000) is one dollar away from its target of $110.00, so this adds credence to the need to a further small rally.
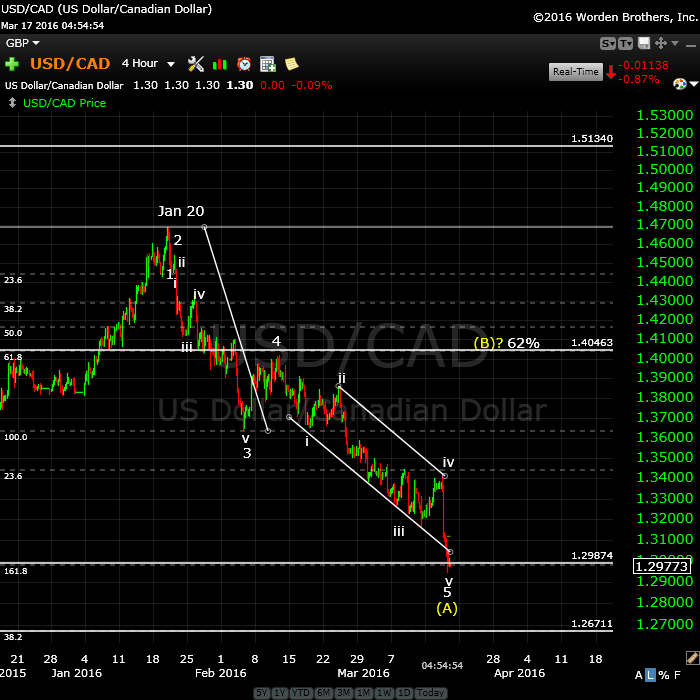
Above is a 4 hour chart of USDCAD. I have been watching this first wave down unfold and last night, it met the target. The wave measures and numbers as a first wave (and A wave in this instance). It has retraced right to the area of the previous fourth. It should now correct to the 62% level in a wave B.
_________________________
Update: Thursday, March 17, 1PM EST
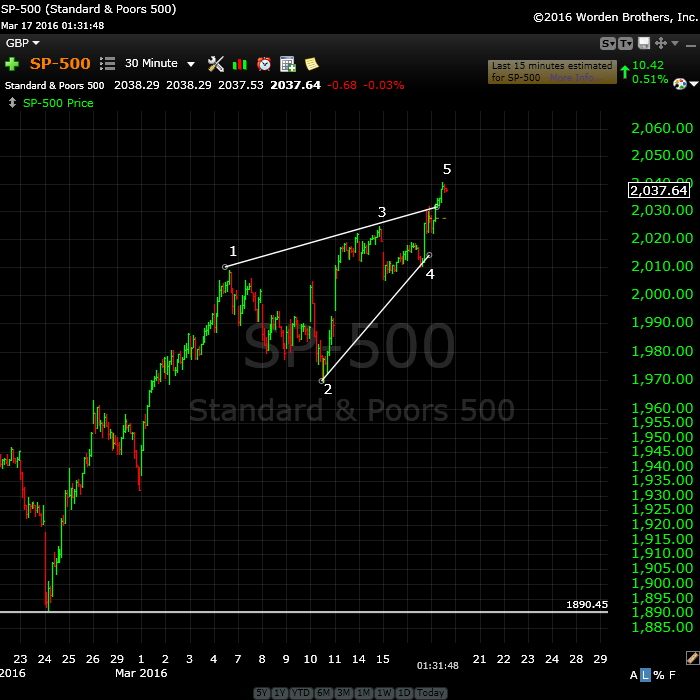
Above is the 3o minute chart of SP500 so you can see the ending diagonal formation I mentioned a couple of days ago. It’s now almost complete.
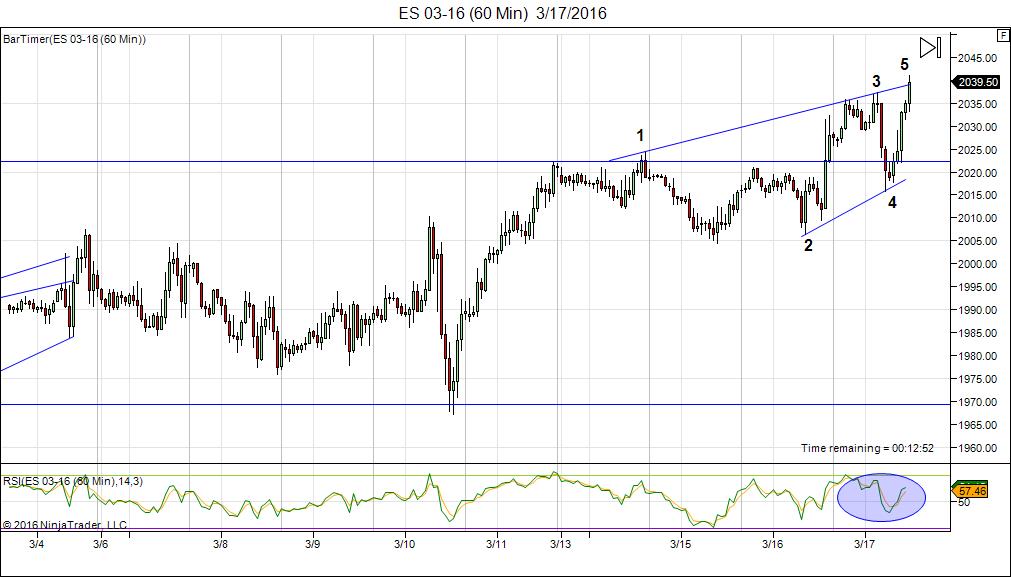
Here’s the pattern I’m seeing in ES (60 min chart). This is the ending diagonal I mentioned two days ago. It is just about “played out.” We’re in the final wave. I circled the obvious RSI divergence at the bottom of the chart.
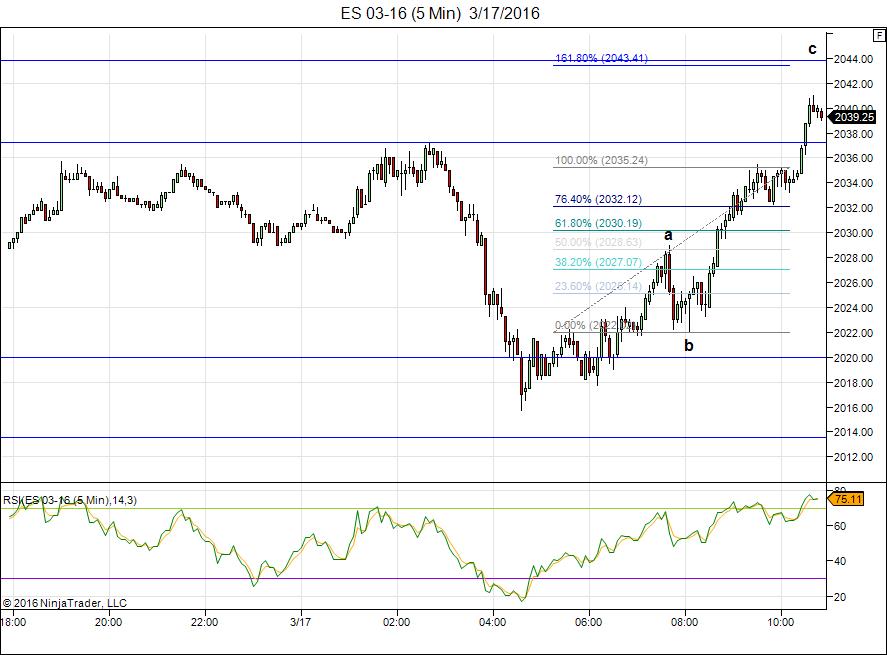
Here’s the 5 minute chart of ES. In the C wave, I can almost count 5 waves up with one more small wave to go. This gives me the target of 2044.
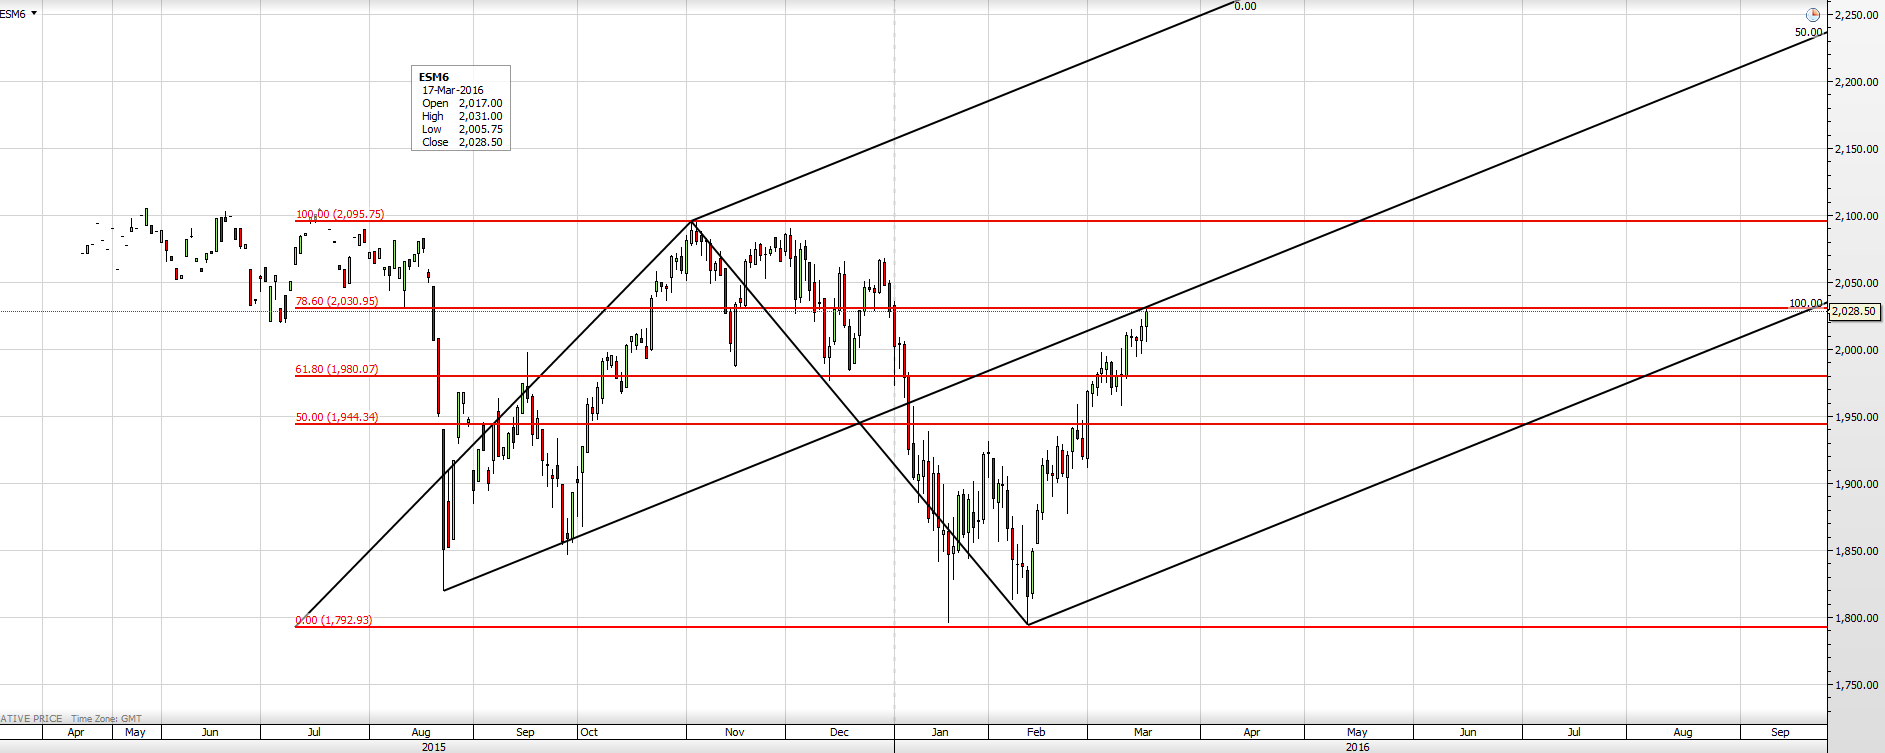
Above is a daily chart of ES courtesy of Mr. Fork (AZ). You can see Andrew’s pitchfork pointing to a turn just about where we are, so this is a different perspective that points to the same result: A turn in the next few hours (I think likely today).
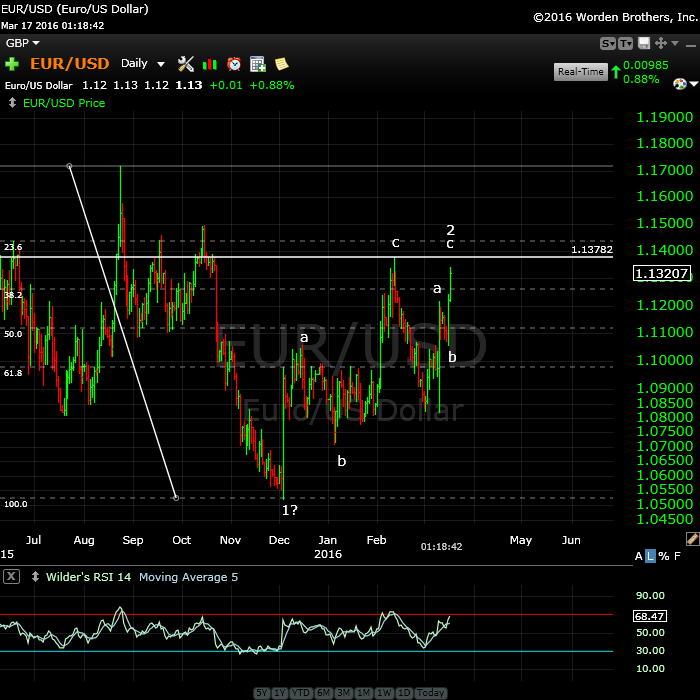
I’ve turned neutral on EURUSD. Here’s the daily chart of EURUSD showing the waves up over the past few days that are not motive so far. I was expecting the motive waves to continue, but this flashes a warning. We may have gotten as much as we can out of this pattern.
I have an issue with the first wave down as it doesn’t look motive to me, but the current look of the second wave forming cautions that we may be changing direction. So I’d watch for a double top with the previous 2nd wave spike and then a turn down.
________________________
Update Wednesday, March 16, 1:30 PM EST
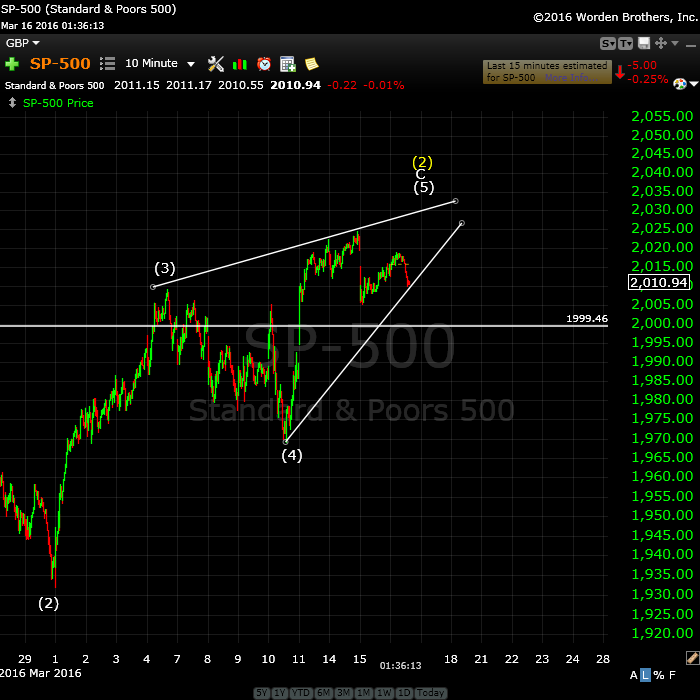
Above is the 10 minute chart of the SP500 showing the revised ending diagonal just ahead of the Fed announcement. It’s calling for a spike up to finish the pattern and the entire wave up. Whether it turns down today or tomorrow morning is the big question.
Update Wednesday, March 16, Before the Open
Scary looking charts in futures this morning (if you’re a bull).
I think what we’re going to see today (the most dramatic part is likely to be after the 2PM EST announcement) is a final wave up and a reversal. And by the way, it doesn’t matter what she says. Anything will disappoint.
The reversal may or may not come today, but we’ll certainly see it by tomorrow morning. I will post the EW preferred entry paragraph below here.
This final wave up will end the ending diagonal I mentioned yesterday and all of wave 2 up. We’re heading down into wave 3 and I’ll post a path once I see where we end up at the high.
Here’s an updated trade setup in EURUSD I posted a few days ago.
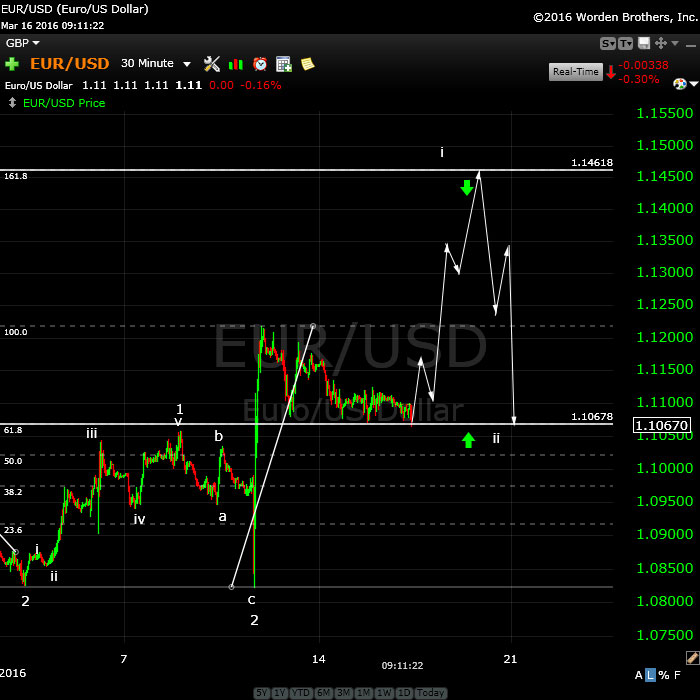
Above is a 30 minute chart as at this morning of the EURUSD showing the first part of a wave i up and a 4th wave retrace to the 38% level. It should head up when we get the reversal and the path after that is shown. Once it retraces to the smaller wave ii area, it will head up again in a large wave 3.
These moves should mirror the moves in the US market, but reverse (just like a mirror 🙂 ).
We’ve been sitting for a couple of days waiting for the US market to move, as you can see.
NOTE: The only issue I have with it is that this “fourth wave” it’s in now has taken a very long time to form and so this could end up being a corrective wave, so be careful if it moves down from here to any great degree. The larger trend appears to be up. I expected it to turn back up a couple of days ago, though.
___________________________
First Wave Down – What to Watch For
Tonight we’re dangerously close to a top of a second wave (in some cases, a 4th wave).
Let’s look at the SP500. When we turn over, we should drop like a stone. A good index to look at in terms of what motive looks like is IWM – perfectly formed motive waves.
The first wave down will be in 5 waves and will likely drop to about 1890 SPX (previous 4th wave). After that, we should get a second wave that will retrace in 3 waves to about 1958 (62%). That’s the preferred EW entry point. So don’t feel you have to rush in. There’ll be a much better opportunity at the second wave level than at the top and the risk is substantially reduced.
______________________________
Update: Tuesday, March 15, 2:15PM EST
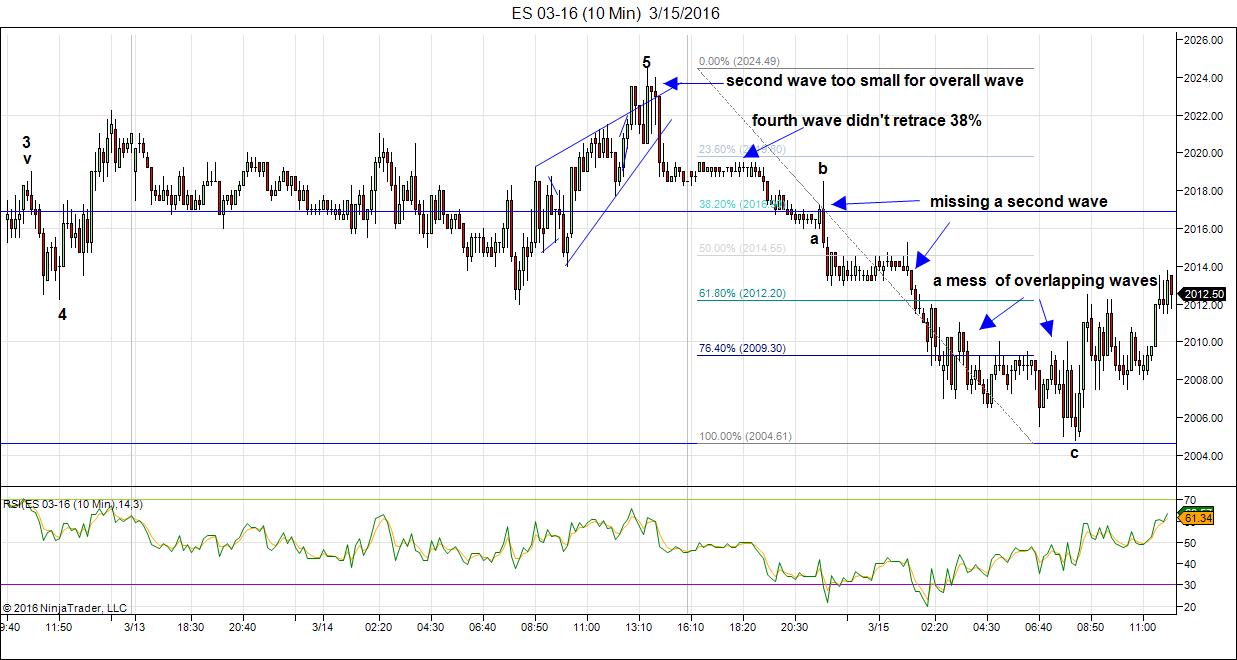
Above is the 10 minute chart of the ES (SPX futures). It shows the wave down last night and the things that jumped out at me when I analyzed it to figure out if it’s motive. It kinda has a motive look to it to the untrained eye, but it has a lot of inherent problems.
Elliott used to talk about the “correct look.” He meant that the key corrective retracements (second and fourth waves) have to look balanced. In this case, there’s a very tiny second wave that isn’t “balanced” with the rest of the wave. It’s way too small.
The fourth wave has to retrace 38%. This one hardly moved off the ground.
The third wave always has a motive set of waves within it, but in this case there are obvious second waves missing. When you have a sheer drop after a spike, it usually means it’s not a motive structure.
Finally, the mess at the bottom has no defined 2nd or 4th waves and it’s not an ending diagonal, which has a very particular structure to it. So what this tells me is that it’s a corrective wave.
So … one more time to the top, and then down for good.
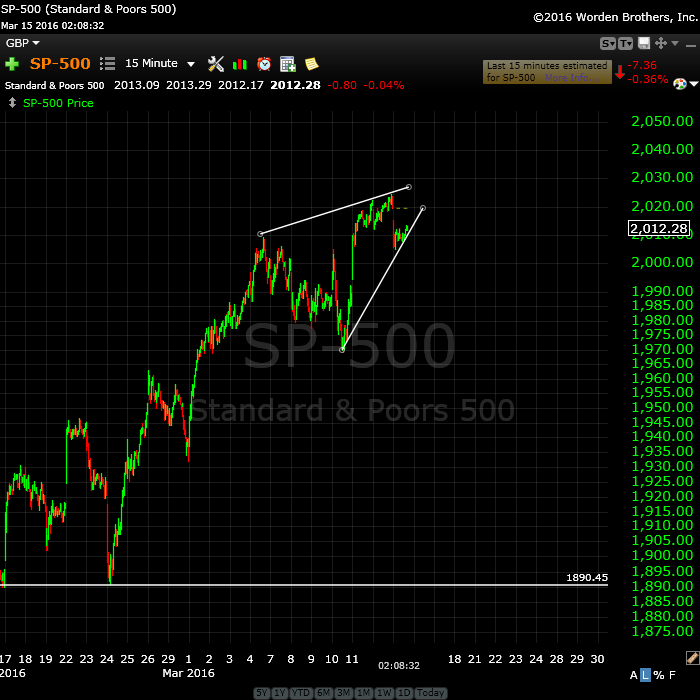
Above is the 15 minute chart of the SPX, showing the C wave up and the five wave structure within it, although I haven’t labelled the waves. You can look at the two charts below for all the labelling.
What I see here is another ending diagonal on a much smaller scale. The reason I went looking for this is that I mentioned in comments that the wave up this morning was in 3 waves … everywhere. If we’re going to a new top (or a double top), that would be an ending wave and should be in 5 waves. However, it’s not; we have waves in 3. So, that leaves only one option—an ending diagonal.
And when I backed out the chart, voilá, there it is! So expect a new high in a fifth of a fifth wave, but I can’t give you a target end number. However, when it stops (it shouldn’t go very far), it will end with a dramatic reversal. They always head for the start of the pattern (in this case, 1969 or so).
We have a Fed announcement at noon tomorrow (Wednesday) so I would expect the drama then.
NOTE: Actually, waves in three in a fourth wave create one general option—a triangle. An ending diagonal is a triangle (one of several different forms of triangle). You find them at the very ends of major waves (a 3rd, 5th, or C waves).
_______________________
Update: Monday, March 14, After the Close
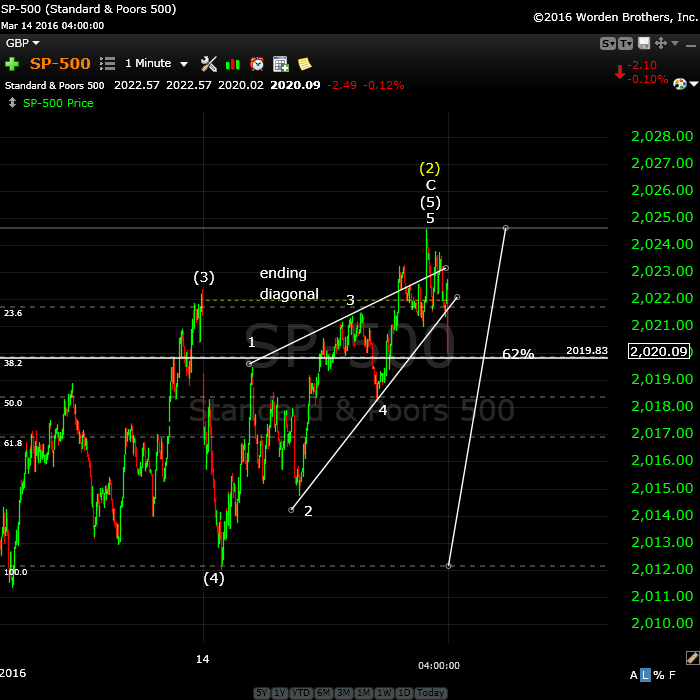
Above is the one minute chart for SPX for March 14 (at the close). The top appears to be in to me.
After five waves up, the trend changes, as I’ve been saying. We appear to be out of “up waves.” 🙂
We traced out an ending diagonal as wave 5 of 5 (the final wave) and we dropped through the lower trendline after completing a 2nd wave. So we’re on track to finish a first wave down, which should drop to the previous 4th (4) before retracing a second wave.
What’s interesting about the last minute drop in SPX is that it stopped right at the 62% level. I always look for clues at the end of the day as to what might happen tomorrow. The clue here is that if ES completes a first wave down tonight, when it retraces a second wave in the morning, it will end at the level the SPX ended at tonight, completely filling any gap that might be otherwise formed.
I don’t know if that will happen, but the possibility is there. There is an option that ES could do a double top tonight, but with the 5th wave seemingly already complete, it should not go up any higher than that.
Breadth and volume were negative today.
IWM (Russell 2000) completed a double top to a second wave today. It looks like it’s already completed a motive first wave down.
Note that EURUSD appears to have turned up. It also completed (or almost so) an ending diagonal. If it continues through the upper trendline, then this would suggest to me that the US indices will continue down from here.
__________________________
Original Post: Sunday, March 13, 2016
The Larger Count is Down
As I’ve been saying since May 20th of last year, this is a bear market. The larger count is down.
Now, there are still a lot of skeptics—both on Elliott waves and the idea that the market is heading down—that view this blog. It honestly beats me how, with the record I have in forecasting this market, how they can still doubt every single count and be proven wrong over and over again.
However, I guess that’s human nature. It’s why people get slammed every time we fall into a major depression. Elliott waves, analyzed properly, is how the market moves. Coupled with Andy Pancholi’s cycles analysis (the best I’ve seen anywhere), you have the holy grail in trading. The major cycle turn date coming up is March 14/15.
I’m in the midst of reading “The Secret Life of Real Estate and Banking” by Philip J. Anderson. I’ll get it added to my reading list before the weekend is done. It’s a fabulous book that documents the ups and downs of the American economy from the early 1800s through about 2007. It’s an eye-opener in terms of the role of inflation, deflation, and real estate to any “free” economy.
Fiat currency, credit expansion, and fractional reserve banking are, of course, the biggest culprits leading to an eventual lack of confidence and ensuing crash. This pattern happened over and over in the 1980s and into the early 20th century. We just never learn.
Well, here we are again. But this time, we have the largest credit expansion in the history of the world. Coupled with a major cycle downturn, the forecast is bleak. (I have a video ready to mount on “Global Cooling” which explains the larger climate cycles and why we should be concerned about this one. Look for it later today or Monday.) So far, it’s on Youtube only.
I have an interview coming up in a week or so on trunews.com on this subject and I’ll update you when we get a little closer.
The best TV right now is the US election. If you think the political landscape in the U.S. is particularly negative now, just wait a few months … the coming downturn should change just about everything.
We’re about to top again and this time, there will be no question as to where the markets are headed. However, there are those who will expect a turnaround and a new high right to the bottom. It happens every single crash cycle.
Time to start getting prepared …
Here’s a video overview of the market for Monday, March 14:
Market Report for March 14  |
 |
Make sure you zoom the video to full size with frame expander (arrows) in the bottom right hand corner and also set the quality to as high as your web connection allows. This is an HD quality video so the best viewing is at that level. |
_______________________________
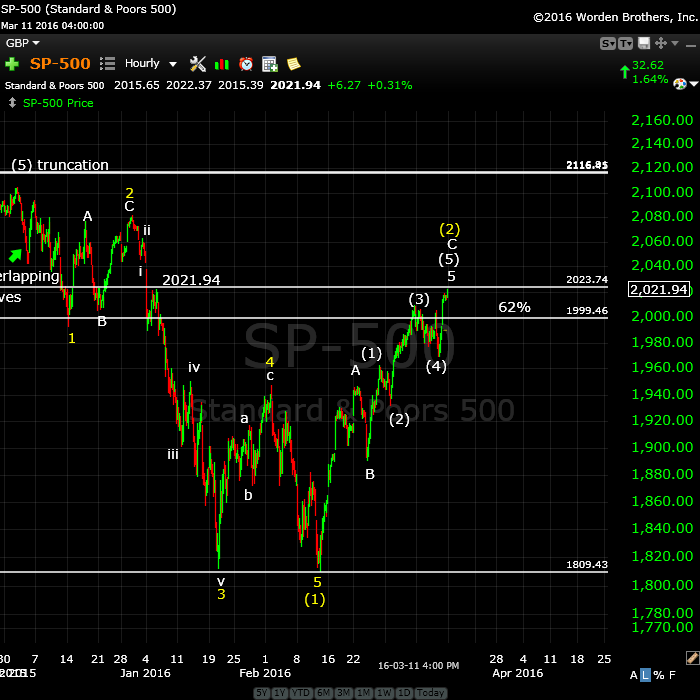
Above is the one hour chart of the SP500 showing the path from the top of the larger second wave on December 3 to the top of this smaller second wave on Friday. Five waves marks are trend change and we’re almost there. The most recent set of five waves makes up the C wave of an ABC corrective pattern that will send the markets to new lows.
We’re not quite finished. We have a small 4th and 5th wave of the 5th to complete (likely over the next few days) and then down we go.
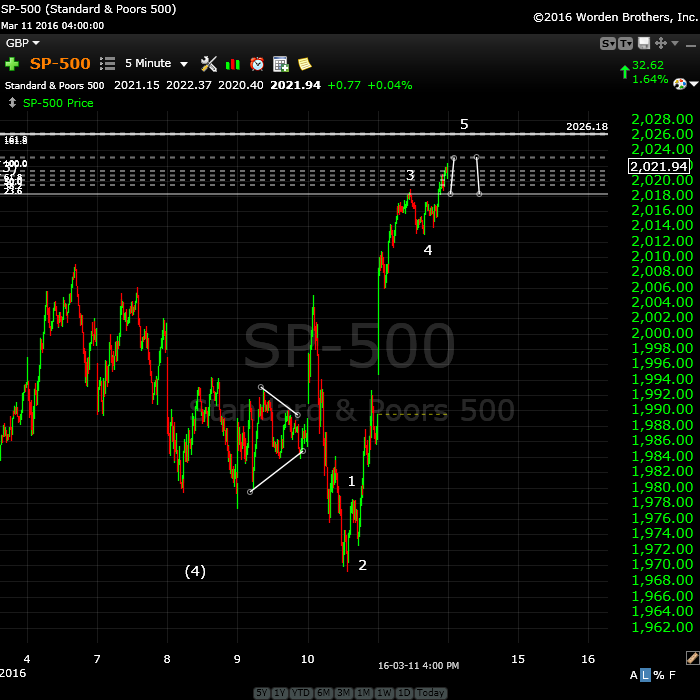
Above is a 5 minute (zoomed in) chart of the SP500 showing the structure of this final 5th wave. We’re finishing the fifth of that wave and the waves themselves are tiny. The end is very close.
The fibonacci tool shows the projected length of the last wave up. Now, this will depend on the depth of the 4th wave drop which will help determine where the final top tick end up. On the top chart, you can see there’s a previous wave top at 2021.94, which is exactly where this wave ended up on Friday. So the market might be signalling that an up and down wave will reach this same position and then turn over. We’ll have to wait and see.
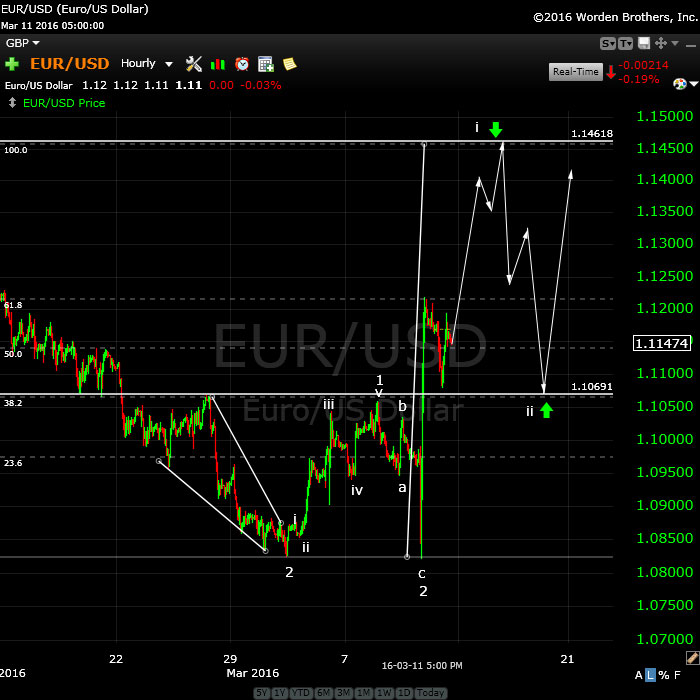
Here’s the one hour chart of EURUSD. I’ve drawn in the projected path. I would expect to see the completion of wave i (above) as the US market traces out a fourth wave and then the second wave (wave ii) in EURUSD to 1.10691 as the US market traces out its fifth wave.
This event would place them both at the beginning of third waves. Third waves are “no where to hide waves.” Either asset will would be a great opportunity.
Have a great week! It will be a volatile one.


Euro should come down to 1.1110 now in a second wave and it may be an indicator for the equities turn.
Euro/dollar will do it I think , from this point on euro will climb against the dollar and European equities will come down after Opex.
Looking good Peet! 🙂
Peter
SPY GAP IS CLOSED :-))
AZ
I’m counting 5 waves up, so I’m not sure what’s keeping it up here …
SPX high was @ 2031 , so we need few more extra points up
AZ
We would have been done long ago if it weren’t for you and your darned fork! hahaha!
:-))
Certainly nothing conclusive. We’ll have to see what futures do. There’s the possibility that they could do a first wave down tonight and then retrace a second wave tomorrow.
Again, I’m counting 5 waves up (we could actually need part of one more), so I could also see us tracing out a double top or something like that tonight.
John
My 16200 level was based on the dow peaking on march 8th .
at this point i am reworking my thoughts .
today i kept my trading short term in nature got a few points
and let the market do its thing .
As peter has said many times , you look for the 5 waves down
and then wait for the bounce .
i keep seeing my price and time calls not being matched.
hence price gets hit yet time has time left in it .
i dont plan to do any trading tomorrow or friday yet the typical
of an expiry day is what ever happens on Thursday look for the opposite
on Friday.
i think the dow wants to go up and fill the gap in 17405-17420 area.
my focus is on march 23rd into april 7-11th and im keeping an open mind .
Joe
Thanks,
I think we will see a topping pattern starting March 18/22 and a big turn down from April 15 till May 9..
Tomorrow is ex-dividend day. I expect to see a rise in SPY
William,
Having had a chance to look at some subwaves, I would have to agree. The waves down in the indices were not motive. Plus if I look at the waves up (although it’s difficult to make out the individual waves), it appears we’ve completed a first, second, and set of three waves to make a third wave. That means we need a final fifth wave up.
I also see a final wave up needed in IWM to complete a triangle, which is a bearish triangle. So that should be the final wave up.
Andy Pancholi’s turn dates of March 14,15 were for the euro, dollar, and gold only. However, since everything is moving in tandem, I thought they might also strongly affect equities.
However the strong turn date for equities is March 17/18, which is Thursday and Friday. This is likely to prove correct, based upon the wave count.
2016 Options Expiration Calendar
http://www.optionsclearing.com/components/docs/about/publications/xcal2016.pdf
Gann gave 8 historical important dates for a change on the major trend. One being 3/21-23.
He also gave potential turn dates calculated on the vernal equinox, one beig 3/20.
The convergence of these two systems is very important.
Yesterday the lunar declination was max north; that supported the market, as was the moon moving for a quarter 3/15.
So the pressure down is growing. Now some more absorption. Next week will bring fun (and headaches).
André
Mastertiming gave a strong cluster 3/15. Next one 3/20, Different technique, same date.
3/17 will be a 2,618 extention on 1/20 and a harmonic spiral calender date.
yesterday I showed how 4/10 is a major date from the 144 squared timing system. And how 3 weeks before gave 3/20,
The 10/10/2007 high came 2 weeks after the last major date on 1929. So week timing on those dates is strong.
Time is running out for the bulls. But hey; what’s new?
I have an indicator that uses planetary pairs for timing. This is new so I have to see how it works.
What I see now :
Jupiter/Saturn gave a change in trend 3/15
Uranus/pluto gave 3/18
Saturn/Uranus gives 3/20.
Next major dates from this system in april.
Hi Andre,
I should say regarding to jup-sat it is march 23; they are 90 apart, jup already Retro and saturn march 26 and the trigger then maybe the full moon. W’ll see.
Sjoerd,
I have a special indicator that that goes beyond just the angle. This give other timing.
Cheers.
This looks suspiciously like a motive wave down this morning. We’ll want to see SPX continue down at the open and futures to turn over probably about the 38% level.
The proof will be a second wave that retraces 62% after this first full wave down.
Looks “not quite right.” SPX has turned into a “3.” Maybe this is the final 4th wave and will require a slight new high. The wave hasn’t come down to a level I’d expect from a first wave, so we’ll wait to see more.
The euro didn’t do what I expected short term last night (there was no second wave retrace). Instead, it headed straight up, so altogether, it’s making the situation a little uncertain.
I guess everyone can see February/March 2016 V bounce is similar to October bounce.
If you look at SPY October rally, 10/21 was the second buyable dip just like 2/29/16.
There was a nice rally the next day for both dips. Let’s take a look at the low of both rally days 10/22 and 3/1.
October 22 low = 201.85
Now if you subtract it from 11/3 HI, you get 10.
If you add 10 to 3/1/16 low of 194.45, you get 204.26.
So either that’s the estimated target high or we climb back to SPY ATH 213. What’s another 10 pts? 🙂
Well,
if we climb to ATH it should change the count
Peter–An observation. The bulk of the C Wave rally in stocks the past couple of weeks has been supported by a falling dollar. Seems to me a falling dollar is something central bankers want in the worst way. However, in the long run they cannot control currency markets and that creates the quandary. The long term dollar chart suggests that we have been in a long consolidation pattern, but ultimately fundamentals suggest the resolution will be a significantly higher dollar. My belief is that just in the 2008 crisis, the dollar will embark on a large rally as global financial markets suffer a worse fate that 2008….pop goes the weasel!! Actually, globally there will likely be a shortage of dollars as cash/liquidity becomes king. Gary
Yes, longer term I agree with you. The count for the past 7 months or so is pointing to a lower dollar. It hasn’t corrected enough yet. Likewise the euro on the opposite direction.
The Draghi negative interest rate policy ponzi scheme is about to be exposed for what it is. When the inflection point arrives, rats off a sinking ship, the Euro gets toasted….along with European stock and bond markets. This fact must scare the FED to death. Gary
Gary,
I just posted a chart of EURUSD with what I’m seeing this morning. It didn’t do what I expected last night and backing out the chart, we may have seen the end of the rallies. It’s pointing to a possible third wave down.
Oh, yeah … they gotta be worried!
Gary,
Let me also add that looking at the euro this morning, we may be seeing the beginning of a turn. I expected 5 waves up over the past few days and we only got three. The B wave went on too long. So this may be forecasting a turn down, and this of course, would send the dollar up. I’m neutral on the euro now.
This is the last leg, 3/20 major turn. Next week down; at last.
Counting waves, we’re now in the fifth of the fifth. I expect a top shortly. I mentioned yesterday that we were likely missing one final wave and this is it.
My measurements of SPX suggest a high at 2017.50. It’s questionable as the first wave from this morning is a bit murky.
The Nasdaq looks to have done five waves down and it attempting a second wave. This kind of divergence between the indices is very bearish.
The other issue with the count is that this is an ending diagonal and the waves should be in 3 waves. If I treat ES as three waves up from this morning, the C wave tops at 2044 ES – 1.67 X the length of the first wave.
Other than being in the final wave, it can’t offer much more.
The top of the gap in SPX is about 2044.
I just posted two charts of what I’m seeing in ES.
I also just added the SP500 chart to the very top of the post so you can see the almost complete ending diagonal there.
And finally …. sigh …. I posted an Andew’s pitchfork chart from AZ – just below the ES charts.
Let’s watch as this thing turns over … won’t be much longer!
Nice charts Peter thanks,
I hope so I went short on the AEX this morning sold to early but went short again.
Either we turn today/friday or next week..
Looking good so far. This is shaping up as the structure of a first wave.
Peter after the run up in Oktober till November 6 it took almost 1 montha to break down again is it possible that this will repeat again?
It shouldn’t. This is a third wave. It should come straight down.
Well we should come down HFT trader on twitter showed that the darkpools are selling the highs just like March 10.. we came down 40 points on the same day…
I have absolutely no idea at the moment what is going on in this market’s little brain.
The first wave down doesn’t necessarily look all that motive, but nothing looks bullish. I also think we’ve topped, for all intents and purposes. It may just be that we need to put in a double top. That could happen overnight.
Not many clues.
Looks like the “FANG” stocks underperformed today and from a candlestick analysis (haven’t had a chance to dig to look at wave structure) all of them had bearish looking action. Maybe they lead down.
Ted,
FB’s wave down doesn’t look motive, but the wave up also looks corrective. So I don’t think we’ll get a new high …
I’ll wander around a bit tonight.
Thanks for the head’s up.
Looking at the SPX in the ending diagonal, from the bottom of wave 4, I count three waves main waves now. If we need a fifth, then I would expect the SPX to come down to the previous 4th (2036.50 or so) and then head up one more time. The first wave is really difficult to count, but the third is relatively easy.
I have an issue with the wave down from today’s top in that it’s not motive. I will post a chart.
IWM hasn’t quite met it’s target (the 62% retrace level is 110.00), but it’s only a buck away. So this would suggest one more wave up.
Well … I added another chart. Not the one you wanted, but it’s close. Taking some time to look around, I think we have one more small wave up. The waves are getting shorter than they should be, so the top is almost at hand.
Agreed my friend, agreed… 😉
Hi Peter
I want to thank you for this blog .
Everyone here is respectful and offers input and as a group
i think we all are focused on getting the market right .
This is the number 1 reason i come here .
My concern about this present market goes back to the June-sept 2014
high ( seen clearly in the NYA ). 3 wave moves are the most difficult
moves to trade from my point of view . whether it be the bond markets
34 year bull market mostly all 3 wave moves or even a stock like xom
trading in 3 wave moves . What i noticed years ago following steve hochberg
and elliott wave , prechter was that many times i felt they were calling a
5th wave high at what appeared to be a top of a 3rd . As i re grouped and
started integrating all my methods together i found that you don’t always
get the 5th wave . Hence a 3 wave move is corrective and there for selling
the top of the 3rd is actually a good way to trade .
Today’s market is reminding me or the early portion of the rallies in the nasdaq
back in 2003 . its that 1 2 3 a b c 1 2 3 a b c type action that drives me nuts .
its like the market never actually completes a move in either direction .
Back then my way to solve this was to accept the 3 wave moves as they are
and get more into indicators and timing .
What i do now is combine the wave counts with the timing and the indicators
and that has dramatically improved my results . However in doing this
i have also lost my edge on using Elliott wave theory .
Bottom line : when the markets are moving in traditional wave counts
it is much easier to call for a high or a low using my methods .
today’s market and actually the market from mid 2014 to date has been
much more difficult in my opinion because the waves have becomes 3’s
and not impulses . You may not agree and that is perfectly acceptable
yet we all have our own money to manage and i accept responsibility
for my trading mistakes .
To sum this up . I still feel we have been in a very large 4th wave since
mid 2014 . this rally we are in now i am counting as an A wave of an ABC
move , this A wave began jan 20 2016 ( i do see the feb lows yet i favor them
as wave B ) the count being A B C ( A ) the decline that follows should be steep
yet i would expect a wave C rally back above to where we are today to follow .
while this is not a clean wave count today the broad picture i am looking at
is the mid 2014 high was the top of a 3rd wave , wave A down was the oct 2014
lows wave B the may 2015 highs and wave C completed in jan 2016 .
Depending on which index your looking at you can count this a variety of ways .
This is the issue i deal with today .
The NYA would therefor have a label of 4 at the jan lows
the dow though could still be considered to be in a 4th wave triangle
which is fairly complex .
the indicators are peaked , the advance decline lines have turned down
and yet the market is still rising .
My Question to me:
1) Regardless of the wave count where are we in terms
of timing ?
2) If this really is a 4th wave having just completed or an A wave of
a larger ABC rally then where is the point where both wave A should peak
and where wave B should bottom ?
3) the problem with the dow was the failure to break above the july 2015
18137.12 high ( this to me changed my 4th wave triangle count )
today looking at a monthly chart i ask a new question
4)Will the dow fail to break above the 17977.85 high ( the nov 2015 high )
5) If the dow fails to take that out ( monthly chart ) we will have what appears
to be a monthly 4th wave triangle yet the details in the structure leave
issues for me do to the failed overlaps of the B waves yet my gut tells me
this is what i should expect.
6) the sq rt of .618 is .786 the sq rt of .786 is .886 .
7) the dow rally back from the august 2015 lows broke above the .786
retrace and yet failed very close to the .886 retrace .
8) Summary .
If we see a similar failure then we should expect the dow to poke above
17437 and yet fail to poke above 17689.73 ( this is my max )
9) sideways moves in triangular shapes once broken give very strong moves
this means that the jan lows are now the most important price levels going forward
the drop from may 2015 to august 2015 on a monthly chart counts as an ABC decline and the rally back counts as an ABC rally into nov 2015 .
The decline from the nov 2015 high to the jan lows can only be counted on a monthly chart as EITHER a motive impulse wave 1 or an A wave of sorts .
Final Summary .
If this is a bullish complex triangle the count would be as follows .
Wave A = the may 2015 to aug 2015 low
Wave B= the aug 2015 to nov 2015 high ( labeled as an X )
Breaking this down into sub waves .
This is a simplified count .
May 2015 high peak , June 2015 low A July 2015 B August 2015 C
Aug 2015 Low Sept 2015 high A oct 2015 B low Nov 2015 high C ( labeled as an X )
if this is all true and it is the only wave count i am left with on the dow
for a bullish outcome then the drop from the nov highs to the jan lows on a dow
monthly chart would be Labeled Wave A of a further developing Triangle formation
which implies many more subdivisions before completing .
To simplify this :
the key date was the nov 2015 price high at 17977.85 high
the jan 2016 low at 15450.56 is the key also labeled A of a further developing
triangle . that is it
This rally from the Jan lows to date have no B wave which is a major piece
of the puzzle which is a must to prove this wave count out .
This makes the case for a Low in April and not a high or at the very
least a steep B wave decline dead ahead of us .
Ill go into the weekly chart next week as it will also be important
yet ive said enough for now
Joe
Joe,
I haven’t read all this, but I think you’re talking about the possibility of a 4th wave triangle for the DOW.
I have been over and over this scenario. I cannot make it work for all the indices. You have go make it work for all, every single one.
The problem is that only the NDX and DOW could fall into that triangle scenario. With all the others, you have to go with a zigzag or flat 4th wave. That means that all the rest will need an ending wave (a motive wave in five waves) to get to the top. We currently have a wave in 3. Nothing will change that fact. So, the only way it will work is in a triangle.
You can’t develop a scenario that works for one index of 30 stocks without making it work for all the others. However, if you can do that (for NYSE, NDX, COMP, SPY, DOW, SP500 RUA et al), I’d be interested in hearing about it … in a series of charts.
But at this point, and taking into account all the other market influences (volume, sentiment, indicators, leverage, credit), I can’t see it.
Lastly
weekly chart observations on the dow .
week of aug 24 2015 =
plus 10 weeks =week of nov 2 ( high )
plus 10 weeks = week of jan 11 ( CLOSING LOW , NOT PRINT LOW )
plus 10 weeks =week of march 21 ( NEXT WEEK )
Joe
Hi Joe,
I will keep it short:
1. Thank you for your input!
2. October 2014 low AEX = 366 (A) and the high April 27 = 511± (B) and now making a C right? Same stuff goes for the DAX and Euro Stoxx. Because the AEX is not that big compared to these guys, I look at them as well. So in short, The big wave 4 you are referring to, impossible when looking at Europe…
I asked Peet to upload the picture.
Cheers,
W
Cheers,
W
There is a compelling analogue that several analysts have been discussing but I have ignored, thinking the market could not hold up this long. Look at the letter “W.” There are 5 points. Here are the corresponding points on the W for the two formations.
1) 8-18-15 12-29-15
2)8-24 1-20-16
3)9-17 2-1-16
4)9-29 2-11-16
5)11-3 ?????
That’s impressive enough, but more impressive is the time symmetries. I’ll leave them for you to figure out, but I will tell you that Point 2 (the first low in the patterns) does not match well. All the others are stunning and within 1 day. Final point: On first pattern, Point 1 to point 5 was 54 trading days. 54 trading days from Point 1 in the second pattern is Thursday, March 17!
Peter george
thank you for your thoughts , ill dig into that also .
some other oddball timing thoughts using calendar days as well
as Fibonacci relationships .
im shrinking this down and its just observations .
Lunar eclipse March 23rd .
Nov 3 2015 high to jan 20 2016 low =78 calendar days .
78 * .786 = 61.30 ( jan 20 2016 + 61 days = March 21 2016
Nov 3 to the feb 11 low was 100 calendar days .
100 * .382 ( kind of the inverse of 618 ) = 38 days
feb 11 + 38 cal days = March 20 .
Dec 1 to Feb 11 was 72 calendar days .
72 * .50 = 36 days
Feb 11 Plus 36 = Friday march 18
as noted prior .
jan 20 to feb 11 was 22 calendar days
22*1.618 =36 which again targets march 18 ( tomorrow )
17634.16-17660.74 is the range ( which is just a mathematical range
and i have no opinion if that gets hit or not )
This market is full of Fibonacci relationships right now which
is amazing to see 🙂
Joe
Peter George
What if i added a few thoughts ?
8-18 2015 to 9-29-2015 = 29 trade days
12 29 to feb 11 was 30 trade days
9 29 to nov 3 was 25 trade days
feb 11 to march 18 would be 25 trade days
Very interesting thinking , thanks for the post
Joe
One very last thought in this
the move from 9-29 to nov 3 in the dow in terms of points
and match that point move to the move from feb 11 2016
will we finally see a price and time match ???
this is getting very interesting
Joe
The 7/11 ratio was very important to Gann. It connects artithmetical law with the geometrical.
It is also in the ratio to the height of the great pyramid and the length of it’s base.
7/11 translates to the 209 degree angle. This angle gives the strongest cluster of the month 3/21-22.
The tides confirm.
3/20 is strong for other reasons. But that’s Sunday. The high will come Monday and then we will get some serious decline.
Cheers,
André
Using the average longitude of the 5 outer planets – including Pluto – and watching the Sun hit this degree, we can see the Sun is at 75 degrees on Monday/Tuesday.
90 degrees will come 4/6. This is close to the 4/10 I get from the 144 squared count.
Anyway, funny how the 209 degree angle aligns with the sun-outer planets average indicator.
The unsiverse rimes.
Typo; universe rhymes.
As it happens, Tuesday we see a Bayer rule 32 inversion on the 11/6 low. This was a minor low, and tends to give inversions. So the low becomes a high.
As the trend is down and we see divesrions every where, next week could be volatile.
André
3/22 we see the sun trine the galactic center. No coincidence.
André
And Tuesday Mercury velocity at 1,966 (Bayer rule 27).
And this happens while we are moving closer to the full moon. Nasty!
Counting months from the 2009 low, july 2015 was cardinal.
Counting weeks from july 2015 we can draw a line through the week of 12/28/15 and the center (7/20/2015). This line crosses the week of 3/21/16.
This implicates next week is a week with a major vibration. So the analysis above is confirmed with a weekly analysis.
As I said this week : as we are drawing closer to the 4/10 major Gann date, volatility will go. This will happen next week. Gold and Euro may do a little retrace but next week they will shoot up.
I think 😉
For confirmation it is very important to look at week and month timing.
Using S&P prices and calculating for every day : date + close*7,024 we get future prices.
For march 2016 I get 5 dates : 4/6/8/15/22.
This march 22 is a major confirmation of what I wrote above. The next dates are in april : 12 (2 times)/22/24 (2 times), 27, 29 (2 times). So in april we get some very strong dates. Remarkable that the double 4/12 date aligns with the 144 squared timing.
Doing the same with months I get : 1/3 (2times). 5,12,13,17,21,24,25,27,28,30(2 times).
The trick is to look for confirmation. And we can now see that the weekly timing gives 3/22 and the monthly timing 3/21, This is Gann theory.
When we turn on Monday the decline will be into april; this analysis confirms.
typo; 3/1
P.s.
Doing the same with years I get in March 4,11,15,16(2 times),17,20,23,27,29,30 (2 times) and 31.
When day,week,month and year align the turn is guaranteed. See how the dates align?
Thanks André ,
Do you have further future dates for Mercury max elongation west and east and at O versus the sun.
The one I can find on Time Price is the first at March 23 but I m curious for the comming months?
Cheers
John.
John,
4/18 max east
6/5 max west
8/16 max east
9/28 max west
Sun /mercury conjunct
1/14
3/23
5/9
7/7
9/12
10/27
12/28
Cheers,
André
Thank you very much André
I think these are good tools.
Cheers.
Peter
I always try to look at both sides of the market .
the triangle formation has many detailed issues with it .
i cannot prove that we are definitely in a triangle .
My focus is the dow as that is the index i have a massive data base on
Back in mid 2014 i was looking for a top of a 3rd wave and was expecting
a 4th wave triangle . So i have been stuck on this pattern for a very long time .
Yes i can be wrong , yes the other index’s do not confirm .
But i am way to stubborn to except that i am wrong until the market proves me
wrong .
What we do agree on right now though is we are all looking for a top and i personally want to position myself short into mid april .
i have the march 23 to april 7- 11th date as a strong directional trend .
your wave counts are calling for a high and your bearish longer term .
andre’s inputs match up with mine in terms of turn dates .
others inputs are similar .
im not fighting the short term at all at the moment.
using Elliot wave theory is about knowing when you are wrong ?
Triangles are all about the B waves with in them and so far the dow
does not have the overlaps needed to validate the pattern but that doesn’t
stop me from being aware of them if they develop .
also in a triangle the C wave of the a b c d e pattern is allowed to be the extreme.
in the year 1974 you can call that the wave C of a huge multi year triangle .
The oex you could label the jan lows as wave C , the dow also a Wave C
in the spx the only way to even consider the triangle is if the nov highs get taken
out and only if that happens can i label the Feb low as a C wave , so i agree its a long shot at this point yet considering the time left for the potential to trace out i cannot rule it out at this juncture .
To add to the bearish case ill use the NYA monthly chart using trend lines .
draw a line down from the top as well as a line from the 2009 low to the oct 2011 low . we have hit where those 2 trend line converge and we have not broken above them . timing says look for a high and i think we have topped .
the price time thoughts don’t fit with all the index’s either yet on the dow
it would be 17538.50 for a top .yesterdays high at 17529 was close .
Joe
Look for a short blurb up top. Not much to say.
The Nasdaq always leads. NDX and NQ are standing at the exits, down just below previous fourths.
SPX PRICE NOW @ 2046
FORK FOR SPX SHOWING TARGET TO BE 2049 – 2051
IWM is 30 cents shy of its target.
Peter–May be important. Gary
http://www.zerohedge.com/news/2016-03-18/why-currency-traders-are-so-confused
Well, if they knew anything about EW, they wouldn’t be confused. I’m certainly not … haha.
This website is for educational purposes relating to Elliott Wave, natural cycles, and the Quantum Revolution (Great Awakening). I welcome questions or comments about any of these subjects. Due to a heavy schedule, I may not have the time to answer questions that relate to my area of expertise.
I reserve the right to remove any comment that is deemed negative, is unhelpful, or off-topic. Such comments may be removed.
Want to comment? You need to be logged in to comment. You can register here.