

What Really Happened on Friday?
If you read reports in the main stream media or read comments by pundits, you’d think on Friday that the economy turned around on a dime and that everything is wonderful.
Ummmm, no it’s not.
We had a double whammy on Friday:
- A labor report that identified an increase of 312,000 jobs in December, with a 3.2% wage hike
- Federal Reserve Chairman Powell said in a discussion that he will be more considerate in terms of rate hikes, a much more dovish stance than previously
What’s particularly odd, of course, is that the Fed doesn’t control interest rates — the market does. But the charade goes on …
But what’s even stranger is that you’d think the market went through the roof!
Ummm, no it didn’t.
I had a target of the upside of 2531 for ES/SP500. Even though we had that double whammy, with a labor report that reportedly “went through the roof,” ES only rose an additional ten points above my target. The “Hopium Effect” seems to waning … that’s a fairly anemic response, in my humble opinion.
And, it appears the US indices are “done” with this extremely “corrective,” dwindling rise. A partial lunar eclipse is scheduled for Sunday/Monday (finally, something neither Donald, nor the Fed controls … lol) and I expect a turn … I’ll let you figure out the direction.
_____________________________
Politics and the Economy
Throughout the past hundred or so years (and I suspect throughout history), politicians have taken credit for the economy. They have virtually no effect on it, but they’ll take credit for it, like President Trump is taking credit for the stock market rally. And when it turns around on him, look out! We always vote leaders out when the economy turns down.
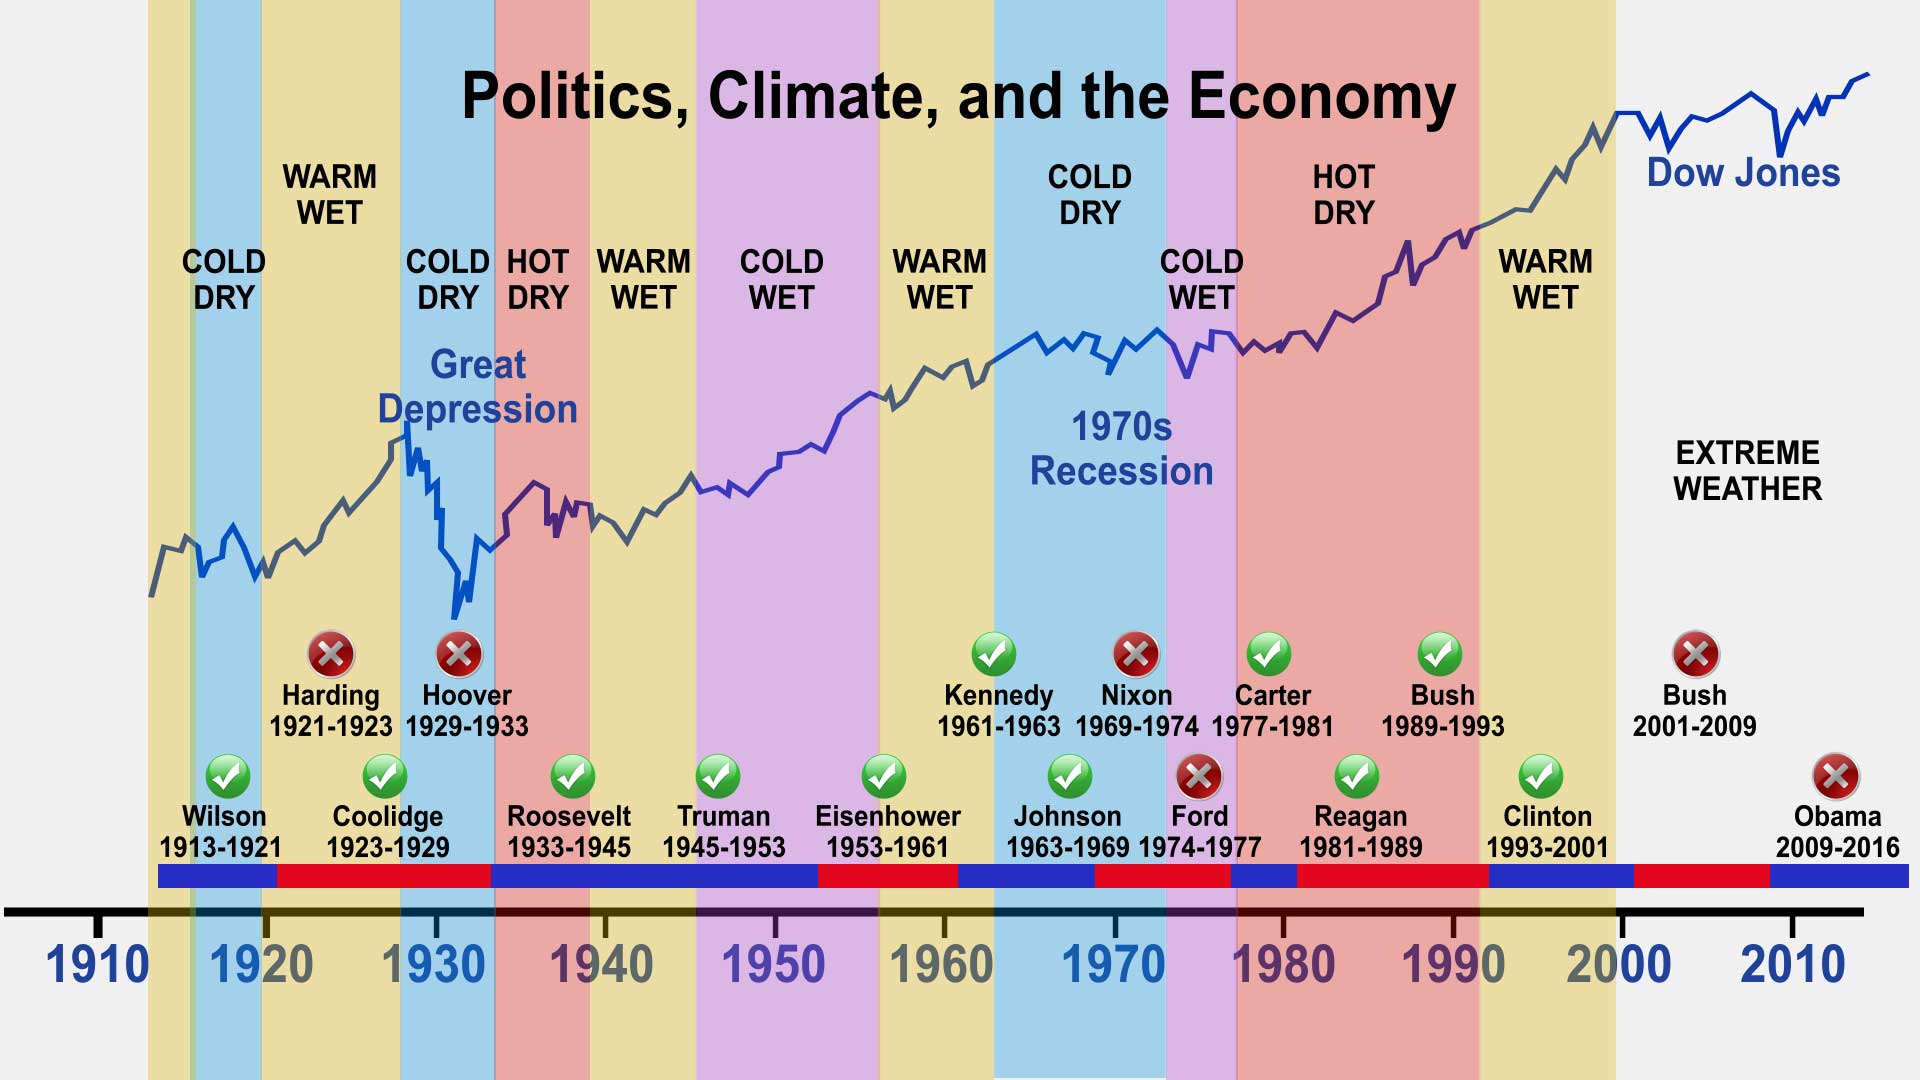
Above is a chart of the US Presidents from 1913 through 2016. You can see the politicians who were liked and are considered “good leaders” by historians (green circles and check marks). The there are those we dislike (red circles and x’s) and threw out of office because “they destroyed the economy.” Well, of course, they didn’t, but if I were a politician, I’d be very careful about when I ran for office.
The chart above shows the impact of the stock market (the DOW is the blue line). There’s an underlying parallel with the climate. You can also see this on the chart. At some point soon, I’ll put together a video on this topic. However, I do have one on how the economy parallels the ups and downs of the DOW. You can find it here.
Interest Rates Before the Great Depression
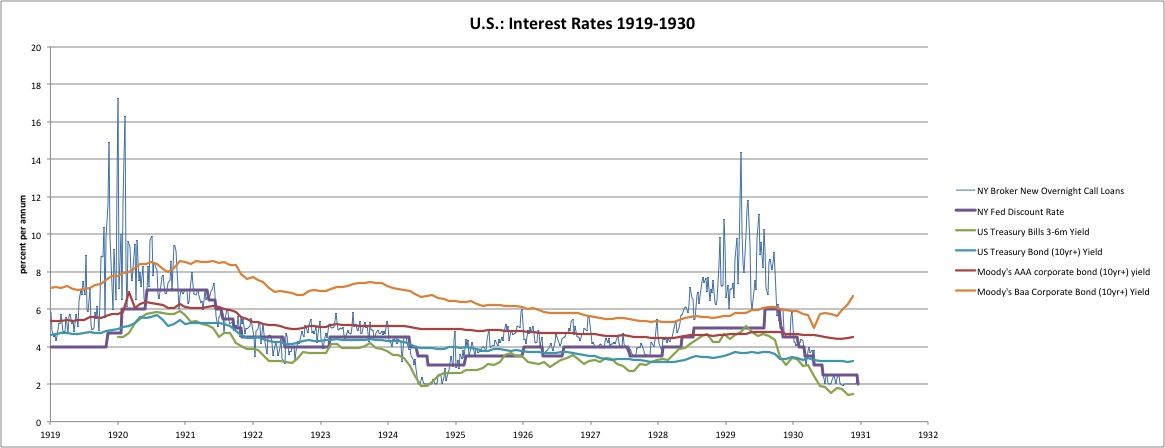
The above chart comes from New World Economics and tracks the US interest rate during the 1920s, leading up to the Great Depression.
What’s important in the chart above is the fact that the Federal Reserve does not raise rates “on their own.” In fact, when Alan Greenspan was asked on CNBC, “Did you keep the interest rates too low for too long in 2002-2003?” blurted, “We didn’t raise rates. The market did.”
You can see on the chart above that the green Treasury Bond (10yr+) yield began to rise going into 1928. The Federal Reserve was bound to follow (purple line) and, sure enough, it did.
Treasury Rates and the Economy
The U.S. Treasury sells bonds at auction. It sets a fixed face value and interest rate for each bond. If there is a lot of demand for Treasurys, they will go to the highest bidder at a price above the face value. That decreases the yield or the total return on investment. That’s because the bidder has to pay more to receive the posted interest rate.
If there isn’t a lot of demand, the bidders will pay less than the face value. That increases the yield. The bidder pays less to receive the stated interest rate. That is why yields always move in the opposite direction of Treasury prices.
Traditionally …
When there’s not much demand, then bond prices drop. Yields increase to compensate. That makes it more expensive to buy a home because mortgage interest rates rise. Buyers have to pay more for their mortgage, so they are forced to buy a less expensive home. That makes builders lower home prices. Since home construction is a component of gross domestic product, then lower home prices slow economic growth.
Rising Treasury rates then, are deflationary. As rates rise in the market we’re currently in, at some point, the market is going to head south. What will that point be? That’s the big question. I don’t know the date, but through Elliott waves, I’ll be able to tell you the market price point.
Low yields on Treasurys mean lower rates on mortgages. Homebuyers can afford a larger home. The increased demand stimulates the real estate market. That boosts the economy. Lower rates also allow homeowners to afford a second mortgage. They’ll use that money for home improvements, or to purchase more consumer products. Both stimulate the economy.
The Times They Are A-Changin’
However, the path forward is likely going to leave both investors and the Federal Reserve scratching their heads; it’s not what you’d expect.
Credit is starting to dry up (deflationary). There’s less demand for loans, and mortgage defaults are rising. The real estate market is imploding worldwide (the top of the 18.5 real estate cycle) and that will continue into a deep deflationary cycle.
If you understand how money is created in the economy, you know that imploding mortgages destroy money; it disappears altogether in our ponzi-scheme of a banking system. That’s deflationary on a grand scale (or it will be once the enormity of the situation starts to manifest itself). This will accompany a flight to safety to treasuries, which will reduce interest rates.
Right now, the Fed is on the wrong side of the market. But, 10 year rates appear to be only tracing out a fourth wave. Look for a lot of volatility going forward … and a very confused Federal Reserve, which will probably be on the wrong side of the market for the next few months, at least.
Longer term, we’re going to see spiralling deflation, but rates will head lower, due to a flight to safety and reduced credit. This is what has happened in depressions throughout history. But it’s not what the pundits are expecting, that’s for sure!
TNX (ten year treasury yields)
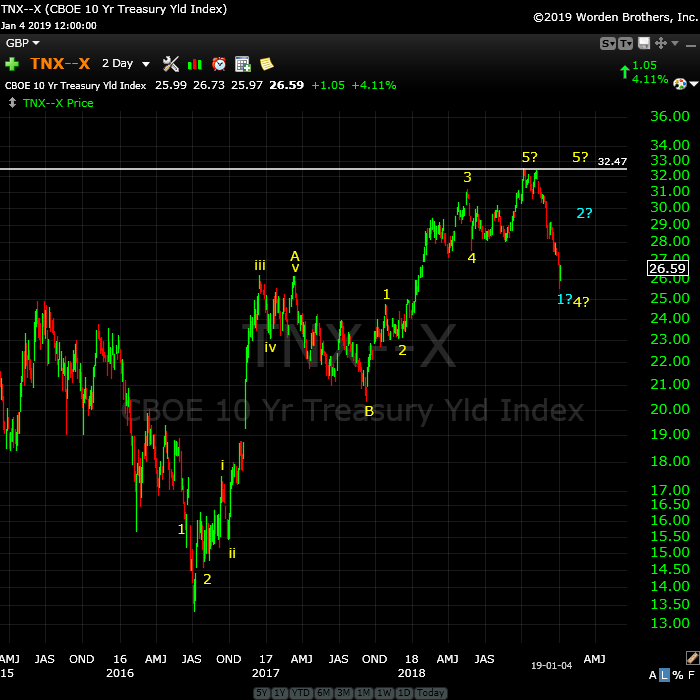
Above is the two day chart of TNX (US ten year treasury yields). I’ve been predicting a drop in interest rates for some time, but I doubt this is a continuing trend … yet.
Although we’ve turned down from a rate of 3.25% to 2.25%, the wave down looks corrective. I expect it’s a fourth wave and that we’re going to see a complete retrace, but the next high (if we indeed get there) will likely be the last for a very long time.
The top in this chart is actually not a technical double top, even though it looks like it here. That means the wave down has a “three count” and will retrace to a new high, even if that’s only for a double top. Rates are going to turn down, but it looks like we’re going to have some volatility, perhaps with a rise in treasury rates as the US indices turn around and trace out a fifth wave to a new high.
But, make no mistake about it, the waves up from summer, 2016 are corrective and must eventually fully retrace. That means we’re heading down below 1.3% … but it will take some time to get there.
Because the Federal Reserve really doesn’t understand the economy (they look at current data, which, by the time it gets out, is very old news). Economists have absolutely no predictive powers (generally, that is — there are the exceptions: Some smart economists actually “get it.”).
So, look for a lot of volatility, the Fed under attack all the way along, and the blame to be laid directly on their shoulders (and the President, because he’s decided to “own” the economy, even though he will have nothing to do with its demise).
“May you live in interesting times” — a purported Chinese curse, although the source has never been found.
____________________________
Elliott Wave Basics
There are two types of Elliott wave patterns:
- Motive (or impulsive waves) which are “trend” waves.
- Corrective waves, which are “counter trend” waves.
Motive (impulsive) waves contain five distinct waves that move the market forward in a trend. Countertrend waves are in 3 waves and simply correct the trend.
All these patterns move at what we call multiple degrees of trend (in other words, the market is fractal, meaning there are smaller series of waves that move in the same patterns within the larger patterns). The keys to analyzing Elliott waves is being able to recognize the patterns and the “degree” of trend (or countertrend) that you’re working within.
Impulsive (motive) waves move in very distinct and reliable patterns of five waves. Subwaves of motive waves measure out to specific lengths (fibonacci ratios) very accurately. Motive waves are the easiest waves to trade. You find them in a trending market.
Waves 1, 3, and 5 of a motive wave pattern each contain 5 impulsive subwaves. Waves 2 and 4 are countertrend waves and move in 3 waves.
Countertrend waves move in 3 waves and always retrace to their start eventually. Countertrend (corrective waves) are typically in patterns — for example, a triangle, flat, or zigzag. Waves within those patterns can be difficult to predict, but the patterns themselves are very predictable.
Trend waves move in 5 waves and partially retrace. The difference in these waves is not covered in “The Elliott Wave Principle” book. There are two types:
- Simple 5 wavers are found in zigzags, flats, and other nondescript corrective patterns. They have 5 waves, and sometimes the third wave has a recognizable 5 wave pattern, but most of the time, they don’t.
- Impulsive waves require each of waves 1, 3, and 5 to have recognizable 5 wave patterns in their subwaves
Fibonacci ratios run all through the market. They determine the lengths of waves and provide entry and exit points. These measurements are really accurate in trending markets, but more difficult to identify in corrective markets (we’ve been in a corrective market in all the asset classes I cover since 2009).
To use Elliott wave analysis accurately, you must be able to recognize the difference between a trend wave (motive) and a countertrend wave (corrective). There’s very much more to proper Elliott wave analysis, but this gives you the basics.
____________________________
Registration for Commenting
Want to comment? You need to be logged in to comment. You can register here.
If you register, it protects your information. It also allows you to comment without filling in your information each time. Once you’re registered, simply go to the home page and click on the login link top right in order to log yourself in. Usually, you’ll be logged in for several days before needing to be logged in again.
______________________________
Problem receiving blog comment emails? Try whitelisting the address. More info.
______________________________
Couldn’t be happier … KK 2
Couldn’t be happier …The analysis and insight you provide is simply amazing! I’ve been trading the futures and equity markets for well over thirty years and usually average around 5% monthly. Since joining your Traders Gold Service two months ago, that number has better than doubled. I couldn’t be happier.—KK |
The best of them JL 2
The best of them …Last couple of years, I subscribed to several ‘market traders’. You are by far the best of them and the personal contact is awesome. Daily and daily updates are very well written! Besides your expertise in EW, I also like your cycles analysis. Best investment I ever made! —JL |
Get an upper hand … JC 2
Get an upper hand in trading …Seeing all the different currency pairs and the wave structures and hearing you explain why this has to do that on a nightly bases gives one a upper hand when trading. Elliott Wave applies to all stock and indices and can be applied to any candlestick chart. If someone ask what you want for Christmas – Tell them a membership to Peter’s “Traders Gold!”—JC |
A true expert in Elliott Wave FL 2
A true expert in Elliott Wave …You are a true expert in EW analysis. What you provide is not available anywhere and is priceless. Subscription on your services is the best thing I have ever done. Many thanks for your effort to make me a better investor. I now have more trust in my investment decisions. I hope you will continue the excellent work! —FL |
Have not had a losing week RW 2
Have not had a losing week …I have been with Peter almost a year. The only thing that matters is have I made money with his service. I think I have finally turned the corner using Peter’s EW. I have not had a losing week in the last 5 months. Thanks Peter, for your amazing amount of hard work. —RW |
Tops in your field DZ 2
Tops in your field …You are tops in your field. Tried to follow Elliot Wave international for years. They were always behind the market. After discovering you, I perceive that you are an expert in reading the waves, which puts you way ahead of the rest of your peers. And you can read the Waves like you are reading tomorrow’s financial section. I pray you stay healthy. —DZ |
Rise above the rest … SM 2
Rise above the rest …I have only ever met a few people who, in their chosen fields (astrology, medicine, music, martial arts, technical analysis), rise above all the rest and you are one of them…you have ‘the gift’…and that’s why I’m a Trader’s Gold member. —SM |
the real deal SM 2
The real deal …‘Educational, insightful and thorough market analysis for all levels of traders. It’s Elliott Wave at its best….Peter Temple is the real deal’ —SM |
US Market Snapshot (based on end-of-week wave structure)
Here's the latest daily chart of ES (emini futures)
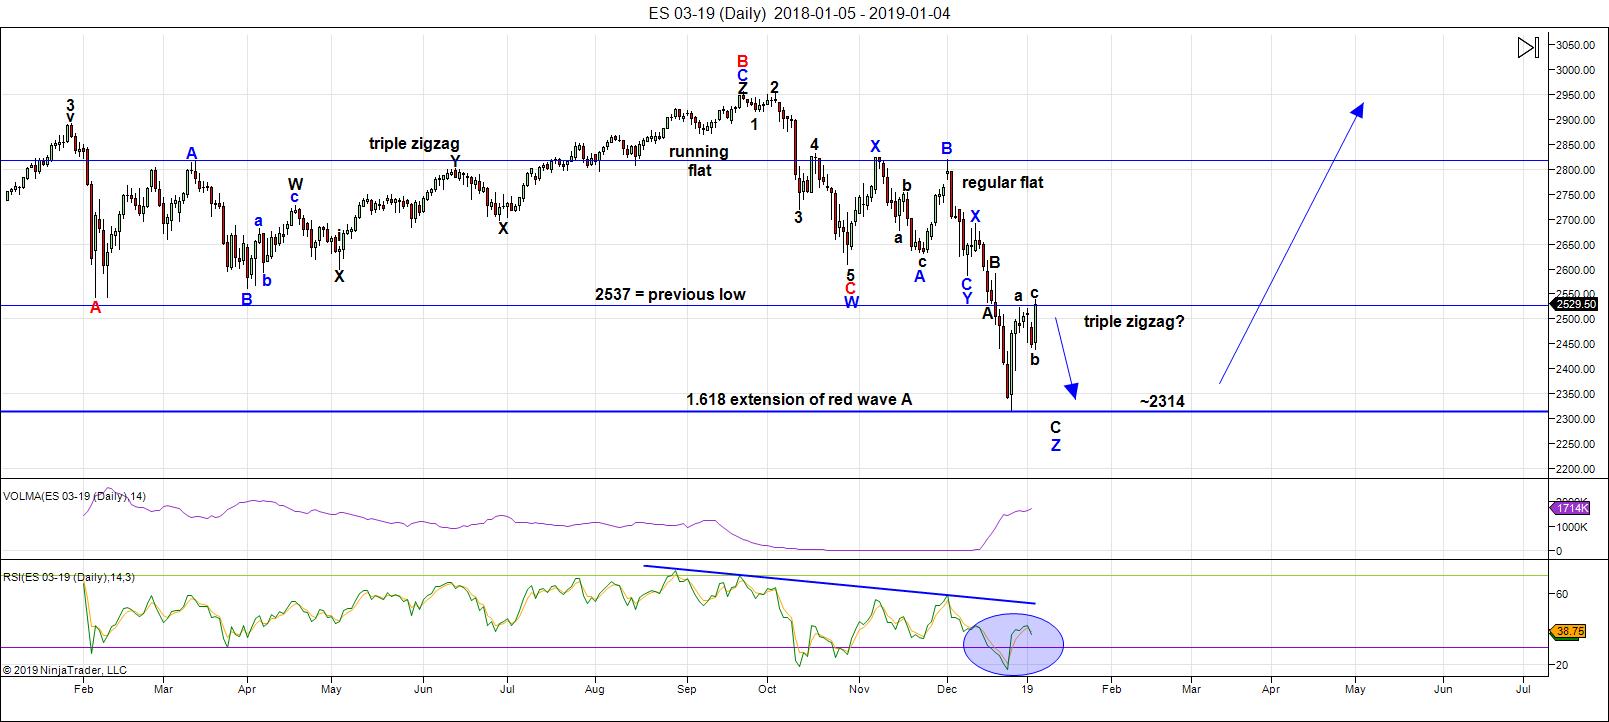
Above is the daily chart of ES (click to enlarge, as with any of my charts).
It was another short week this week, but we got our money's worth in volatility. Bottoms are always volatile, as the market gets ready for a trend change. It's often a war between bulls and bears and this past week has been no exception.
However, the bears should take charge again on Monday with the partial lunar eclipse of the moon. It's only visible in Asia and actually happens overnight Sunday into Monday.
On Friday, we expected a rally due to the three waves down from the previous two days, but the combination of the labor report and Fed Chairman Jerome Powell speaking sent the market up beyond expectations. However, the current high should mark the end of this Hopium-produced somewhat euphoric rise. The greater trend is down until we see one more zigzag and a new low.
What was interesting to me is that my target of 2531 for the rally was exceeded by only ten points or so. It was a big deal in the press, but not really much of a rally in real terms.
So down we should go finally and end this really ugly fourth wave that has now persisted for an entire year!
A confirmed bottom will lead to a turn to the upside in a 5th and final wave to a new all-time-high.
Summary: Look for a dramatic drop in a zigzag (5-3-5) pattern to complete a triple zigzag with a wave at least to the previous low starting as early as Monday. The culmination of this drop should mark the bottom of large fourth wave in progress since January 29, 2018 - almost a full year of Hell.
___________________________
Trader's Gold Subscribers get a comprehensive view of the market, including hourly (and even smaller timeframes, when appropriate) on a daily basis. They also receive updates through the comments area. I provide only the daily timeframe for the free blog, as a "snapshot" of where the market currently trades and the next move on a weekly basis.
______________________________________
Sign up for: The Chart Show
Next Date: Wednesday, January 9 at 5:00 pm EST (US market time)

The Chart Show is a one hour webinar in which Peter Temple provides the Elliott Wave analysis in real time for the US market, gold, silver, oil, major USD currency pairs, and more. You won't find a more accurate or comprehensive market prediction anywhere for this price.
Get caught up on the market from an Elliott Wave perspective. You’ll also get Andy Pancholi cycle turn dates for the SP500 for the balance of the current month. There’ll be a Q&A session during and at the end of the webinar and the possibility (depending on time) of taking requests.
For more information and to sign up, click here.
| "I think you are the only Elliot Wave technician on the planet who knows what he's doing.” |
| m.d. (professional trader) |
All registrants will receive the video playback of the webinar, so even if you miss it, you’ll be sent the full video replay within about an hour of its conclusion.


Peter is that the correct chart that you posted?
I think it is showing ES levels only through 11-30-18 at the 2748 area…
Verne,
Oops! Thanks. I know I updated at some point, but ended up switching some things around and I must have reverted to an old version … not that I haven’t done THAT before … !
Haha!
And here I was thinking you were just trying to see who of us were really paying attention! 🙂
I’ll use that excuse in future .. lol.
Peter, your comments about have let a monstrous cat out of the global economic bag, and I suspect few of your readers are going to grasp the magnitude of what you stated, namely falling interest rates in an deflationary environment. This defies everything that they teach and believe in their economic ivory towers and a lot of folk who think they are very clever are convinced that shorting Treasuries is going to be the big money trade of the coming great emergency. Of course corporate bonds are going to implode as many of the companies that issued them go bankrupt, but the flight to safety and concern for return OF, rather than return ON capital is going to be quite a game changer. You are SO right in pointing out that very few are expecting what is going to happen. You sure you wanted to spill the beans on this one? 🙂
At this point, I have something to lose? LOL
That happens to be the way it’s going to play out. History and technicals point to the same outcome.
Thanks Peter, excellent update
It is also what I m expecting, I still have a turn date down on Januari 8 till Januari 20-22.
Goodluck to all.
This is what I wrote in December.
John
December 23, 2018, 7:06 am
Thanks Peter, my dates for december based on astrology are december 4,12,18,25,27 and 29.
So I expect a rally from december 29 till januari 8.
Good luck to all
John,
I’d be interested in two things, if not proprietary info:
1. what do the other dates you list signify (you don’t explain)
2. what was the basis for your prediction regarding January 8
Well done on the prediction … just interested in your thinking.
Peter,
The dates that I mentioned are all based on cycles (planetary).
December 4 was a top ( almost correct)
12 should be a bottom but it turned into a lower top
18 should be a top, but we continued the down trend
25,27,29 was a cluster, but we already saw a rally on December 26
Januari 8 has to be an important top, we should see a big drop from here into direction off the full moon.
We have an important moonwobble period at the moment wit a peak energy arround the full moon.
Most off the times when we have a moonwobble the stockmarket gets a hit.
An exception on the rule was July 2018 this was also a moonwobble period but the market did not have a negative reaction.
That’s all I can say about it.
Its is not a perfect system but from time to time it can be very accurate.
The cycle dates show the best results when the stockmarket is very volatile.
All the best..
Thanks, John
Much appreciated.
Thank you Peter T! I started communicating mid-2017 that we could see the worst of both world (market down, bonds down-rates up). That happened through most of 2018, but now is the tricky part. I wanted to load up on bond proxies at 3.2% 10yr treas, but I didn’t. Would like to do it this time, but this in-sync/ out-of-sync between markets and rates will be treacherous! Completing your “ugly fourth” should keep rates low with demand, so would rates rebound as we complete the fourth wave into the final fifth? I appreciate all your work with these different factors.
Hi mojo,
I don’t really know the timing, but it looks to me like we have one more wave up to a new high in TNX and then down, as predicted. I review bonds each week as part of the Chart Show.
Hi Peter.
I am with John. I have a high close to 2639 on either Wednesday or Thursday.
Interesting. Thats a 100 point ES rally to get to. Also I saw an interesting post on Twitter above overlaying the days of new moons and full moons on the ES chart. Seems like new moons accurately mark tops and full moons bottoms. New moon was Jan 6 and next full moon is Jan 21. Ties in well with Johns post above
My analysis has prices down at 2242 on 28 January.
a stand-in for Andre van Staveren?
Peter T
Thanks for the update .
I wish I had the link to the article I just read in regards to Social Security
or I would add to the discussion on interest rates .
The Next 10 Trade days should be interesting .
I have learned something new in regards to the puetz cycle yet
I need to back test this before making any claims .
———————————————————————-
New Moon ( Solar Eclipse )
The moon is currently in Aquarius
The moon is 1 day old
Dec 24 spx closing low
Jan 3 spx closing low
6 Trade days low to low
Adding 6 trade days to the Jan 3 closing low calls for a high
can be pint high or closing high This Friday .
Wave A up on daily chart lasted 3 trade days
Wave B down on daily chat lasted 3 trade days
This current leg up from the jan 3 low is now in its second day
which would consider tomorrow 2 equal moves up in terms up time .
Cash spx at 2551.30 is where the daily chart wave C equals .618 of wave A.
The next level of importance on the cash spx for me is 2569.78
Cash Dow the key next level is 23679.62 and wave C on the daily chart will equal
.618 of wave A at 23670.07
If those levels are indeed broken then higher projections will be given yet
it is way to soon to call for that .
The lesser weighted dow stocks ( 16 of them ) poked below the may lows yet failed to break below the april lows and are right now sitting at the late feb 2018 highs . The heavier weighted dow stocks ( 15 of them ) broke down below the Feb 2018 lows and at this moment are showing more weakness in this bounce yet none the less moving higher .
By Closing above 24230 the cash dow technically has its next major resistance
at 26048 on a closing basis yet the 24970 area is going to be key .( if it even gets up that high I have no idea so not a forecast at all )
Bigger picture and being general : Above 25000 is screaming bullish and considered a break out
A high in mid Feb = an inverted puetz cycle ( not saying it is inverted at this point because so far it has not failed )
A high in mid Feb ( Monthly Chart ) would then call for a sideways move with in a big trading range With a swing low in May Followed by a break out to new all time highs in June .
The entire Move on the monthly chart may indeed a 3 wave move
which would imply a very steep crash phase from early Sept into Nov
24085.06- 24391.88 is the important closing range fo the month of January .
The Crazy and unimaginable :
Cash dow breaking above 26986 targets 30858 and above that targets Just Below 34730 .
26986 is a very important long term pivot .
12 years 3 months to 12 yeas 8 months from the July and oct 2007 highs
calls for an important low between Oct 2019 – June 2020 .
The Dow Peaked in Jan 2000, Adding 233 months marks June 2019
Using the march 2000 high marks Sept 2019.
Sept 2007 was the monthly closing high in the cash dow
adding 144 months to that closing high marks Sept 2019
There was a fairly important low in Aug 1998 and another fairly important
low 127 Months later in March 2009 ( sq rt of 1.618 = 1.27 )
this is speculative yet add 127 months to march 2009 and you get Oct 2019 .
If you choose to take the print low in Sept 1998 and then use the march 2009 print low 126 months later and add 126 months to march 2009
you get Sept 2019 .
I am no WDGann expert yet add 90 years to Sept 1929 and you get Sept 2019.
Take 90 years times 365 and you get 32850 calendar days .
Add 386.10 , 1929 dow high and you get 1 point per day for 32850 days
watch the 33236.10 to 38610 Range .
Most of this post is very speculative
10 spx points to go and about 80 dow points to and….
The lunar eclipse is Jan 20th …..
I have no idea what this market is going to do .
Joe – Outstanding post. I enjoy reading everything you write. Really great food for thought.
Question- Assuming the Puetz cycle does not invert, what does it call for next? It is my understanding that the market should top between 6 days before to three days after the full moon (Jan 21) and then decline into the following new moon (Feb 4). Is it possible that the decline continues past the new moon and still be following the Puetz cycle? Feb 8-Feb 14? Your insight is greatly appreciated.
Interesting stuff, Joe, but be careful with your 90 year calculation for calendar days. Because of leap years, we have to use 365.25 as the average year which would mean 90 years would be 32,872.5 calendar days…
Aaron
http://thespiritoftruth.blogspot.com/2010/01/puetz-eclipse-crash-window-is-in-effect.html
Several years back, a cycle watcher named Steve Puetz attempted to see if eclipses and market crashes were somehow related. He studied eight of the greatest crashes in financial history, from the Holland Tulip Mania of 1637 to the Nikkei of 1990. He found that market crashes tend to occur near full moons, and that the greatest number of crashes start after the first full moon after a solar eclipse, when that full moon is also a lunar eclipse. Puetz found that all eight crashes occurred six days before to three days after a full moon that occurred within six weeks of a solar eclipse. The odds of that being a coincidence, Puetz calculated, are less than 1 in 127,000.
Puetz was not saying that so-called “Puetz windows” always lead to crashes, but that if a crash is going to occur, a Puetz window would be the likely time frame in which it would happen. Puetz windows tend to occur every year or two, while crashes are rare events. (SOURCE)
He….concludes that a full moon in general and a lunar (eclipse) full moon close to solar eclipses, in particular, seem to be the triggering device that allows for the rapid transformation of investor psychology from manic greed to paranoia (SOURCE).
Peter G
Thank you : )
Yes. I am familiar with Steve Peutz and his work as I have been a subscriber. Just wanted your take on the coming decline occurring into the new moon or past it into mid February.
Thanks
Thought this was a good summery of astro events. Looks like a second puetz window this summer. https://www.forbes.com/sites/jamiecartereurope/2019/01/07/yesterdays-solar-eclipse-was-first-of-six-eclipses-in-2019-with-super-wolf-blood-moon-up-next/#44c901e1c3c6
The eclipse cycle is an idealised cycle where the usual pattern is a primary top around the new moon prior to the SE, a pullback into the SE and then a secondary top around the time of the LE. Most of the big crashes conform to the idealised cycle to some degree or variate by one lunar cycle. As I continue to educate myself on the eclipse cycle as well as other aspects of Puetz’s work, I believe the danger lies in taking the idealised pattern too literally – that is, they are not necessarily distinct turning points. And the lesser crashes/corrections do not confirm as elegantly to the idealised eclipse cycle. In my current opinion, the pertinent times are one to two new moons prior to the SE and the LE +/- 29.5 days, and the power of each is magnified when in a seasonally weak period.
re Solar-Lunar Eclipses :: https://twitter.com/BuddieBuddiee/status/1072541360119562242
(read from bottom to top)
ALSO::
BUY the FULL moon + 4 trading days
SELL the NEW moon + 4 trading days
back to Puetz Theory / SOLAR-LUNAR eclipses
Solar-Lunar :: https://www.timeanddate.com/eclipse/list.html?starty=2010
FULL Moon = Dec 22, 2018
52wk low in indices = Dec 24, 2018
SOLAR Eclipse / NEW moon = Jan 5-6, 2019
..markets started rallying Fri Jan 4, 2019
so 2 weeks from Jan 4 = Jan 18, 2019 — could see 2673 area/better — 2710?
LUNAR eclipse = Jan 20-21 (FULL moon)
NEW moon = Feb 4
FULL moon = FEB 19 — bottom ??
got different scenarios — here’s one:
Scenario III for YEAR 2019
4 JAN day high = 2538.07 squared===>> 50.3792
minus 2.9941 [ 20 may 2015 high – 24 aug 2015 low ]
= 47.3851 *2
= 2245.34(7702) —>> 38.2% Retracement from the 2940.91 Sep 21, 2018 HIGH [ 2242.0694 ]
couldn’t resist giving my 2cents w/o the GST 🙂
sorry — was multi-tasking and NOT proof-reading what I wrote.
52wk low in indices = DEC 26, 2018 [ Boxing Day ] …and NOT Dec 24, 2018 — was looking at the volatility indicators:
http://www.cboe.com/products/vix-index-volatility/volatility-indexes
VXAPL => AAPL
VXAZN => AMZN
VXGOG => GOOGL
VXGS => GS
VXN => NDX [ nasdaq ]
RVX => RUT [ Russell 2000 ]
…all these made NEW 52wk HIGHs on Dec 24, 2018
watch the British Pound volatility indicator ==>> BPVIX
..was looking thru my archives — June 23, 2016 & June 24, 2016 — we had a slight melt-up on Thursday – day Brexit took place to leave the EU & then a BIG flush on Friday June 24th:
IWM
112.38USD Decrease 4.44 (-3.80%)
NDX
4,285.7010 USD Decrease181.78 (-4.07%)
COMP
4,707.9790 USD Decrease 202.06 (-4.12%)
SPX
2,037.30 USD Decrease 76.02 (-3.60%)
DJIA
17,399.86 USD Decrease 611.21 (-3.39%)
NOT much of a flush, eh! considering the type of flushes we’ve had recently. lol
this is my last cameo appearance on all the social media platforms. have weaned myself off Twitter, StockTwits, etc .. and this is my last watering hole to wean myself off which starts today 🙂
to make it short (actually it’s long winded) & sweet – to those here who are following me on Twitter — don’t !! just take snap-shots of the links/tweets you deem important. never know if perchance Twitter locks/disengages that Twitter account. they’ve done w/my locked accounts. and any so-called locked accounts Twitter has their own spies spying on your locked accounts. this I found out personally. after they locked me out of my 2 locked accounts — decided to go to my 1st twitter account BUDDIEE18 which I placed on hiatus since year 2013 & tried to make THAT account into a LOCKED account whereby ONLY me, myself & I followed & no one else allowed. well… to make it short — I blocked everyone who followed me and guess what ? I had 12/22 followers showing — following me. lolol .. emailed twitter — they couldn’t care less. they even warned me for wishing their DemocRAT leader Hillary Clinton dead..so gave up — lost that account which I had over 250K .. something like that — tweets. this was from Nov 2010 to Dec 2013. anyhow — 4got where I placed my password for my latest email account in order to see IF ‘BuddieBuddiee’ Twitter account has any messages. lol .. am getting bored explaining.. which makes no sense to anyone reading this… but b4 I go — realized when looking at some of my tweets in the “Likes” section — that I didn’t add the links to what some MIGHT find of some interest: .. the 2 formulas I created which are kinda simple … but to me …effective. I know most of you have all the bells & whistles on your own trading platform. I’m more of the simple kind.
the 2 are:
https://docs.google.com/spreadsheets/d/1l-qAld1QvJK2HwBa1Kn5dhihBCuSKdSuF_cwFPHNv50/edit#gid=1567913005
THIS one you have to ENTER :: the amount of
Day HIGH minus day low
= 41.60 — this was Monday’s & CLOSE was 2549.69
TODAY’s 32.26
2579.82
– 2547.56
= 32.26 & TODAY’s CLOSE (Tuesday) is 2574.41
DON’T 4get to enter TODAY’s (previous day close) = 2574.41 & drag the mouse to the bottom for BOTH columns
…one follower of mine was kind enough to do google sheets for me.
here’s Celeste explaining how to do it:
https://twitter.com/BuddieBuddiee/status/1074761558071205888
I used to do the primitive way — calculate manually & write them down & then tweet them like a village idiot. lol ..
the OTHER one is the “OPEN” price one:
https://docs.google.com/spreadsheets/d/1uTMlNLJAv_WhnKk1U4FL9Qy64JklutwaMMEx1s_Mv0A/edit#gid=345701751
this one — you have to ONLY type in the OPEN price & then drag your mouse down that “Open Price” column .. rest is all mechanically calculated.
both can be used for ANY other stock/indice — please note today’s SPX day high of 2579 = .707 fib = 2520 — I always look at the opposite #
same goes for the “OPEN” chart — 2547.56 day low in SPX = 2588.74 — was expecting today at least 2584.24 as a day high/high based on the open interest. fool around w/diff methods. its not rocket science. its all in the #s in front of you.
I always say — if you stuck on an island w/o your GPS / fancy software and just had the #s on your screen — you better know how to use a calculator / your fingers… and ignore the noise — FED, TRUMP, CNBC, all the fake news cause its ALL about FIBONACCI levels + CYCLES. that’s it. it’s not what Trump tweets. yea.. hate him if you a democrat — but let’s NOT give ANYONE FREE ROOM & BOARD in YOUR heads. lol.. that’s ANOTHER reason I’ve left Twitter and other social media — traders are so damn religious when it comes to their beliefs about which party is right…and majority on Twitter are DemocRATS. I have a personal beef w/them ever since I got hacked in 2003 by John Kerry’s people. so yea.. know about hypocrisy from that side.
if they ONLY KNEW that the word “beLIEf” has a LIE in it — lol .. its a freemason joke. ok! long story.
ok.. out of here .. have overstayed my welcome…Peter T — you can do whatever you deem right re this post of mine. light a torch 😉
— GOOD LUCK ALL !!!
Nice impulse down off ES highs….
Dow Monthly
50 % retrace of the dec bar = 23846.37
35 % retrace of the oct high to dec low = 23713.93
The peak of this rally so far peaked at 23864.65
this initial rally has satisfied the bare minimum yet
we are now into the 3rd week of a rally phase which
has FAILED to beak above the weekly dec 17th break down bar .
This market is now at an inflection point.
a minor wave is now due to the downside followed by an up move
into jan 20th is the puetz cycle is still in effect .
a move further to the upside is needed before calling a bottom in place.
im open what what eve the mkt proves itself to be .
This is where the typical bear mkt mind set changes and im not saying
we bottomed or that we have a huge decline coming yet right now and for the next week I think its time to sit back and let the short term swings come without any comment .
Jan 20th is where the next turn begins yet any price movement above todays highs tilt the scale to a more bullish outcome .
My initial upside objective on the cash dow was a need for a close above 23075.17
That level is now considered Key support to any sell off .
23081.36 – 23075.17 will need to hold or it tips the scales back to a bearish market .
My oscillators are showing more of an oversold condition despite the rally yet
the 5 day and 10 day advance decline line is into their respective upper ranges.
The 5 day trin gave a warning today despite todays up move in the Dow.
The Hourly $tick is beginning to show some bearish divergences .
As noted earlier today, I think it is best to sit back and let the market swing around and prove itself .
I will not be surprised if we see a decline Next week .
If we see a low going into Jan 20th then it will imply an inversion in the puetz cycle ( in my opinion ) followed by a rally into mid FEB .
At this point the puetz cycle is not failing and with that in mind jan 20th is should be a high .
I am not going to be able to add anything meaningful to the short term swings and it is at this stage where I have seen far to many times markets grind higher defying logic . the picture is a perfect set up for a decline beginning right now
yet time wise other than a very basic time count and the short term over bought conditions I cannot make a solid bearish or bullish argument.
No short term speculation trades being made by me
Joe
Impulsive declines all being aggressively bought. Now looking to me like consolidation of recent gains which implies the move up continues near term….
Liz H
I have been thinking about what you wrote about the year 2015
and finally took the time to look back at it .
ill begin with what you wrote .
Joe,
Back in 2015, the swing high from the 9/13/15 partial solar eclipse was Sept 17, 4 trading days later.
Same scenario here, partial solar eclipse on a Sunday.
Joe,
the swing low was 8/24/15, 5 calendar days before 8/29 full moon.
If you notice spx low was about 12/24/18 or 12/26/18 depending on when you bought your calls 12/24 at end of day or 12/26 11 am.
That said, today may have played out like 11/7/2018 so let’s see how it goes Monday.—————————–
For the record I did not buy call options I bought individual stocks and put money back into the market that I had sold over the past few years. I had lightened up
going into 2018.
Aug. 14, 2015 New Moon
Sep 13, 2015 – Partial Solar Eclipse
A total lunar eclipse took place between September 27 and 28, 2015. It was seen on Sunday evening, September 27.
Sept 13 2015 plus 6 weeks = oct 25th
full moon was oct 27 2015
im just keeping this simple with out explanations
I see what you are saying and if this does become a similar scenario
then I would expect the sell of to begin next week
to be specific Jan 11th is a swing high subcycle with the mars Uranus cycle .
https://imgur.com/icIo3Xi
The present text book pattern im following which is not perfect yet has not failed
https://imgur.com/DvzncUK
this is notes I took while reading your text .
ill note one thing
both the new moon aug 14 2015 and the full moon aug 29 2015 were swing highs
https://imgur.com/eOqFshH
Dec 22 2018 was a Saturday , dec 24 was a Monday following the full moon
a slight change ( it should have been a high of sorts in my opinion )
Anyways thanks for the input
I do get what you saying
Joe
Liz H
Thanks again , its kind of beginning to make sense to me .
That said im not calling this market
posted this a few days ago and now I can make a bearish argument
even if it ends up shot term
Joe Longwill
January 7, 2019, 9:54 am
Dec 24 spx closing low
Jan 3 spx closing low
6 Trade days low to low
Adding 6 trade days to the Jan 3 closing low calls for a high
can be pint high or closing high This Friday .
Enjoy the weekend everyone
Lets see how the mkt reacts next week
its only Wednesday I know
Peter T
Thanks you !
Joe – another period I was looking at is Feb 2008. Feb 7 Solar eclipse. Feb 20 Full moon lunar eclipse. The market decline ahead of the solar eclipse is very similar to what we have had till now. In that case, the high was a few days after the lunar eclipse (though not by too much in terms of price – you could have comfortably sold the lunar eclipse high). That high was followed by a quick retest of the lows about 3 weeks from the lunar eclipse. A similar time line would suggest a high around Jan 20th and a mid February low. I am not an astro guy and have started looking at it very recently. Just surprised to see so many correlations. From my own work, I see 2625-2650 as a very strong resistance area and I do not think we can breach that in a straight line from here.
Thanks Joe.
Would be stunning if charts print a shooting star today or cough, cough bearish engulfing candle.
Reversal signs very dicey. Of late they all seem to be followed by higher prices….
Uptrend channel remains intact. Until and unless we get an impulsive take out of the lower boundary with successful back-test, we probably grind higher….
Verne,
I’m already out Verne so wishing you luck. I know I said 4 TDs from solar eclipse but I’m uncomfortable how tight QQQ is currently in that rising wedge from the lows.
To add, VXX is nearing 50 sma and 60 sma. Seems to be good support area for both Nov and Dec lows.
I agree the move up is terminal, just not sure “when”….i did not expect a move past 2580…
Check Phil Anderson out. He is a real-estate cycle man. Very interesting and he has been on the money for a long time.
https://www.youtube.com/watch?v=odj96JmJSPo
His book, The Secret Life of Real Estate is, of course, in my recommended books list, and I’ve cited some of this work in many of the articles on this site. https://worldcyclesinstitute.com/books/
Nice.
He does make a lot of sense and in logical form. Not sure if he lines up with you re the start of a major bear run to end all bear runs in stocks. Can’t see how property will boom from 2021 on wards against your plan when it plays out hopefully by the end of this year. With the stock market at a 500 yr cycle top then how will real estate boom from 21 on wards to 26 as he mentioned.
One way could be this stock market bounces around below the high till 2026 then tops. Hard to see that happening.
No, we don’t agree on the cycle synchronization. I go by Dewey’s work and my own, which pegs the bottom of the most recent cycle in the year 2000 and so I expected a top somewhere in the year 2018 or into 2019. https://worldcyclesinstitute.com/the-eighteen-year-real-estate-cycle/
But his work on the history, particularly in the 1800s is superb!
Sydney and Melbourne have and are coming off highs. Down about 10% so far. Regional areas haven’t moved much yet.
Top end of town is worst but those figures don’t show up. If you had to get out of a 2 M dollar plus house now the buyers aren’t there. Worst still the banks have harden right up over the last 6 months on loans especially upper middle class and above. Very hard to get a loan and you have to put your grandmother up as security plus both family jewels. Times are changing here and people really aren’t aware of it. One thing that is still very strong is ag. Land values are still peeking.
Real estate all over the world has been imploding since about September. All assets, including land, will eventually head down to somewhere around 20% of today’s value. Money (cash) will increase in value. It’s the money value that changes, of course, not the real estate. You want to be in cash.
Puetz also has has the 2026 cycle beat, but it doesn’t necessarily mean it will be higher than it is now. The cycles continue, but they can head down just as easily as they can head up. They get trumped by larger cycles.
I’m sitting on a lot of cash earning 2% which is hopeless. Patience is a virtue but it is also one of the hardest things to do.
BOTH JEWELS???!!!
That would be nothing short of financial EMASCULATION!!
Ain’t NO WAY dude!!! 😁😁😁
Joe,
It’s looking like your Jan. 11 high may be correct.
I am on the sidelines as well.
The market is stumping quite a few very good analysts.
I have never seen a move out of a triangle go on for this long. It is not looking like we are completing some kind of ED with the final fifth wave up unfolding.
I saw a few counts that called the ED complete but that is NOT possible.
There is no mistaking the way they conclude and what we are seeing is definitely not it!
two EDs in a wedge. insane.
I bot some NFLX and GOOGL lotto calls just in case bulls push this to 200sma or for google, 12/4 high lol.
LIZ H
Looking at Cash SPX Daily Chart.
2613.13-2617.65 should be about it from a try to get top tick perspective .
those levels are measured from the closing low dec 24 to the pint high dec 28
and projected up fom the jan 3 low . I also included the pint low dec 26 to print high
dec 28 . the time count being close low dec 24 close low jan 3 and expecting a closing high tomorrow jan 11. End of week and assuming many wont want to be
left short over the weekend .
If tomorrow is going to be just a swing high then that 2613-2617 range
would be where wave C equals A .
Todays market action Shows he 10 day readings in the advance decline line into extremes and the 5 day turned down despite an up day . It is another short term bearish signal.
ill add that the 10 trin yesterday closed at 1.00 a mild overbought reading and today it turned and gave a sell signal .
I may take a day trade short position tomorrow up into that range yet it will
really come down to next weeks market action to prove we ae at any short term high .
The weekly chart has no B wave in it at this point so a low Jan 20-21 would fit .
the Bradley model calls for a low I think jan 22.
the jan 20-22 time period as a low would imply a mid Feb high .
As I noted a few days ago , I felt we wee at an inflection point and as I have seen far to many times , the market has ground higher despite the indicators .
Any short positions taken by me will be vey short term trades t this point .
I spilled coffee on key board a few days ago
the missing R or other typos are a key board issue .
Peter T
if you are interested in any data for usa real-estate
I use this . you can dig through the site and find the actual data
and put it in excel . I up date my stuff every few months yet it is a pretty
useful site
https://us.spindices.com/index-family/real-estate/sp-corelogic-case-shiller
Are we still expecting another low before wave 5 starts?
I wish I knew my friend!
The rising wedge does seem interminable! :-))
No short trades for me today
we have the close low to close low to close high in place yet
price has failed . fo Monday ill be looking at the 2613-2617
spx price to take a shot term bearish trade .
We have yet to see a weekly wave B since this rally began back in dec.
Yes indeed. And this wedge is very likely the “c” wave of a larger B but it sure is taking its sweet time. It is all but impossible to call the duration of these corrective waves with the banksters actively bidding the market higher even after what looks like initial impulsive declines. Interesting how waves all seem to be moving in threes lately…
.
That new chart by Bart show looks to me like a no-brainer.
Here is the problem I am having: It is SO OBVIOUS!
These perverse banksters know every trader worth is salt is probably charting that pattern. What do you think the cabal is going to do??!! 🙂
A new weekend blog post is live at: https://worldcyclesinstitute.com/colonel-custers-last-stand/
This website is for educational purposes relating to Elliott Wave, natural cycles, and the Quantum Revolution (Great Awakening). I welcome questions or comments about any of these subjects. Due to a heavy schedule, I may not have the time to answer questions that relate to my area of expertise.
I reserve the right to remove any comment that is deemed negative, is unhelpful, or off-topic. Such comments may be removed.
Want to comment? You need to be logged in to comment. You can register here.