
 Yogi Berra

Lawrence Peter “Yogi” Berra (May 12, 1925 – September 22, 2015) was an American baseball player, manager and member of Major League Baseball’s Hall of Fame, noted for his bad-ball hitting, his ability to perform in the clutch, and his peculiar, humorous-sounding statements. Most people have heard at least some of these statements, often without knowing the source.
My choice for the title of this blog post on Friday night was the fact that with all the talk about markets coming down, there are some on this blog, many pundits (who know absolutely nothing about the market), and many in the media are predicting the top is in. Even Bob Prechter (EWI International) called a top a month or so ago, and true to his historical accuracy, is wrong yet again.
The market has not topped. We’re close, but not there yet.
In any event, Yogi came up with the phrase, “It Ain’t Over ‘Til It’s Over” during the 1973 National League pennant race, and it’s been in our lexicon ever since.
Here are some other “yogiisms“:
- Always go to other people’s funerals; otherwise they won’t go to yours
- When You Come to a Fork in the Road, Take It!
- I knew the record would stand until it was broken.
- He’s learning me all of his experience.
- I looked like this when I was young, and I still do.
- If the world were perfect, it wouldn’t be.
- If you can’t imitate him, don’t copy him.
- If you don’t know where you’re going, you might not get there.
Thank you for making this day necessary (that’s another one).
__________________________________
The Reality of This Free Blog
I’ve been told that I should have my head examined for mounting and contributing to this free blog. Every once in a while, those words come back to haunt me. This weekend is a case in point.
In this free blog, I provide less than five percent of the work I do for my Trader’s Gold clients. This weekend’s Trader’s Gold blog post took me about twelve hours to create, including the analysis. I provide charts for SP500, ES, NQ, NDX (when necessary), US Dollar index, EURUSD, GBPUSD, AUDUSD, USDCAD, USDJPY, WTI Oil, gold, and silver, along with a fairly comprehensive video that often goes right down to five minute charts for predictions. I update the analysis each night (Monday through Thursday) in a video that is anywhere from 10 – 23 or so minutes in length.
I don’t post how many times I’m right or wrong, because my wrongs are so ridiculously low, nobody would believe them, quite frankly. I’ll go up against any Elliott Wave analyst you can throw and me and trounce that analyst in accuracy.
A very recent unsolicited testimonial (in its entirety):
Well, nice call once again in the stock indices! I’m staying clear of them until the trend has clearly turned down. But the good news is that from your last comments, I bought some gold, some silver, and sold a lot of crude oil contracts yesterday as oil was up at the highs. I know . . . . lucky trade . . . . . but it seems to be happening with increased frequency since I signed up for your service.
Enjoy your day and I can’t tell you how much your service and analysis of these crazy markets is appreciated! You’ve made an enormous difference in my already impressive trading results
I’m mortified when I make a bad call. I take my work that seriously.
But keep in mind that this weekly post is a snapshot in time (it can change the next day, for example, the Monday after I post). When I began it, I undertook to predict the direction of the market and not pull any punches. Extremely rarely do I declare that the market will “either do this or that (up or down).” I make a call and I stick with it, right or wrong. I’m OK with that.
Elliott Wave is a science. Let me repeat that: Elliott Wave is a science. It is not treated as a science by anyone I know of. EWI has destroyed its credibility. They’re inherently biased and have broken every rule in the book on a relatively consistent basis.
I chose when I started this blog to share my knowledge as a way to help people understand that this is the way the market moves. It does it consistently to a set of rules (not necessarily accurate in the book, “The Elliott Wave Principle”). There are other rules and guidelines that I’ve developed along the way, and I’ve disproven several of the original ones.
In the beginning, I was attacked on a regular basis. That treatment has died down. But most people are skeptical of this science. People absolutely don’t want to learn; they show up with inherent bias, and will attack what they don’t understand.
As a result, I choose my words here (and elsewhere) very carefully. When I am certain that the market has one more wave to go to the top, I will use the word “certain” (or a derivative).
What’s that based on? History.
In Elliott Wave, final waves are always in 5 waves (or a diagonal of some type, which is also in five waves). That has never NOT happened. You can go back in any market at any degree of trend.
In climate, after roughly five hundred years, it turns colder and dryer and we head into a depression and Dark Ages, just like we’re heading into now. It has never NOT happened. The Sun revolves around the Earth every 24 hours, the moon every 25 hours. It has never NOT happened.
Of these things and the fact that the US market is going to trace out five waves (we’re in the fourth), I am certain. It has never NOT happened.
But, very few people pay any attention to history. However, history repeats, and it does it with periodicity, meaning the turns are predictable. The past is the future; you’re future. If you get in sync with Mother Nature, your time on Earth will be very much more fruitful. If you don’t, good luck.
And that, dear friends is what this web site is all about.
“Those who do not remember the past are condemned to repeat it” – George Santayana
Here are a few other things I’m certain of:
- The DOW will be in the area of 3,000 points in about five years.
- We have not seen the high in the US indices, oil, and most of the international indices
- We’re going into a period of major deflation (I suggest you learn how it affects your money)
- Many banks are going to fail over the next five years in just about every country on Earth
- Famine and pandemics are going to be the big challenges for decades to come
- You can find more here.
This site’s byline is, “The Science of Prediction,” in case you hadn’t noticed. It’s time to learn all you can about the past, because it’s certainly coming back around again … as it always has.
Ignorance will not be bliss in future that lies before us.
__________________________
Elliott Wave Basics
There are two types of Elliott wave patterns:
- Motive (or impulsive waves) which are “trend” waves.
- Corrective waves, which are “counter trend” waves.
Motive waves contain five distinct waves that move the market forward in a trend. Counter trend waves are in 3 waves and simply correct the trend.
All these patterns move at what we call multiple degrees of trend (in other words, the market is fractal, meaning there are smaller series of waves that move in the same patterns within the larger patterns). The keys to analyzing Elliott waves is being able to recognize the patterns and the “degree” of trend (or countertrend) that you’re working within.
Impulsive (motive) waves move in very distinct and reliable patterns of five waves. Subwaves of motive waves measure out to specific lengths (fibonacci ratios) very accurately. Motive waves are the easiest waves to trade. You find them in a trending market.
Waves 1, 3, and 5 of a motive wave pattern each contain 5 impulsive subwaves. Waves 2 and 4 are countertrend waves and move in 3 waves.
Countertrend waves move in 3 waves and always retrace to their start eventually. Counrtertrend (corrective waves) are typically in patterns — for example, a triangle, flat, or zigzag. Waves within those patterns can be difficult to predict, but the patterns themselves are very predictable.
Fibonacci ratios run all through the market. They determine the lengths of waves and provide entry and exit points. These measurements are really accurate in trending markets, but more difficult to identify in corrective markets (we’ve been in a corrective market in all the asset classes I cover since 2009).
To use Elliott wave analysis accurately, you must be able to recognize the difference between a trend wave (motive) and a countertrend wave (corrective). There’s very much more to proper Elliott wave analysis, but this gives you the basics.
____________________________
Registration for Commenting
Want to comment? You need to be logged in to comment. You can register here.
If you register, it protects your information. It also allows you to comment without filling in your information each time. Once you’re registered, simply go to the home page and click on the login link top right in order to log yourself in. Usually, you’ll be logged in for several days before needing to be logged in again.
______________________________
Problem receiving blog comment emails? Try whitelisting the address. More info.
______________________________
Get an upper hand … JC 2
Get an upper hand in trading …Seeing all the different currency pairs and the wave structures and hearing you explain why this has to do that on a nightly bases gives one a upper hand when trading. Elliott Wave applies to all stock and indices and can be applied to any candlestick chart. If someone ask what you want for Christmas – Tell them a membership to Peter’s “Traders Gold!”—JC |
the real deal SM 2
The real deal …‘Educational, insightful and thorough market analysis for all levels of traders. It’s Elliott Wave at its best….Peter Temple is the real deal’ —SM |
Have not had a losing week RW 2
Have not had a losing week …I have been with Peter almost a year. The only thing that matters is have I made money with his service. I think I have finally turned the corner using Peter’s EW. I have not had a losing week in the last 5 months. Thanks Peter, for your amazing amount of hard work. —RW |
Tops in your field DZ 2
Tops in your field …You are tops in your field. Tried to follow Elliot Wave international for years. They were always behind the market. After discovering you, I perceive that you are an expert in reading the waves, which puts you way ahead of the rest of your peers. And you can read the Waves like you are reading tomorrow’s financial section. I pray you stay healthy. —DZ |
A true expert in Elliott Wave FL 2
A true expert in Elliott Wave …You are a true expert in EW analysis. What you provide is not available anywhere and is priceless. Subscription on your services is the best thing I have ever done. Many thanks for your effort to make me a better investor. I now have more trust in my investment decisions. I hope you will continue the excellent work! —FL |
The best of them JL 2
The best of them …Last couple of years, I subscribed to several ‘market traders’. You are by far the best of them and the personal contact is awesome. Daily and daily updates are very well written! Besides your expertise in EW, I also like your cycles analysis. Best investment I ever made! —JL |
Couldn’t be happier … KK 2
Couldn’t be happier …The analysis and insight you provide is simply amazing! I’ve been trading the futures and equity markets for well over thirty years and usually average around 5% monthly. Since joining your Traders Gold Service two months ago, that number has better than doubled. I couldn’t be happier.—KK |
Rise above the rest … SM 2
Rise above the rest …I have only ever met a few people who, in their chosen fields (astrology, medicine, music, martial arts, technical analysis), rise above all the rest and you are one of them…you have ‘the gift’…and that’s why I’m a Trader’s Gold member. —SM |
The Market This Week
Here's the latest daily chart of ES (emini futures)
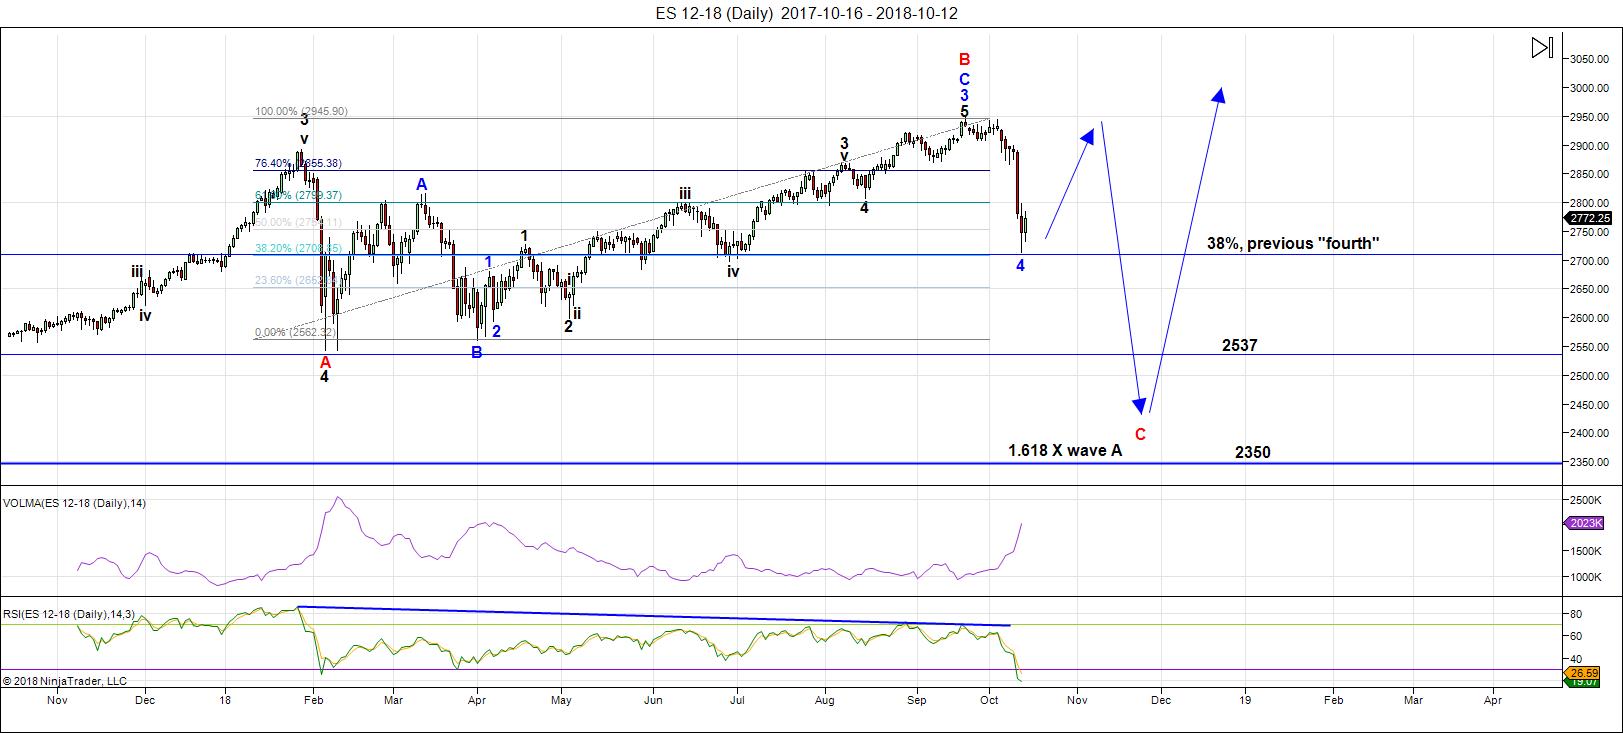
Above is the daily chart of ES (click to enlarge, as with any of my charts).
Last weekend, I was expecting a retrace to a new high because we had what appeared to be a corrective wave to the downside. I still can't count five waves to the downside in ES. Therefore, I have to count it as corrective (a double zigzag and then another 5 waves down). That doesn't mean corrective combination wave can't be the first wave of a C wave; it could be, but it's not what one would expect.
If we experienced a small flat (which, superficially at least, the structure mimics), the C wave down should be in 5 waves; however, the wave down doesn't look "correct" in that regard; I can't count five waves). On the other hand, in NQ, I can count five waves down. So, we have a possible non-confirmation here.
EURUSD has also now topped, the first of the currency pairs to do so. It's in the middle of a first wave to the downside. The wave down is not complete. This lends credence to the idea that we have the first wave of the C wave in place.
So, the big question this weekend for ES is, do we reach a new high before we drop into the expected C wave, or do we have a first wave down of the C wave in place? I'm about 60/40 in favour of this being the first leg of a larger C wave, based more on what's happening with other asset classes than on the count in ES/SPX itself (which is ambiguous, imho). The "tell" will be whether we turn back down after a rally to the 62% level (Note that in a corrective wave, a second, or B wave, may fall short of actually reaching the 62% retrace level before another leg down).
A review of the bigger picture: In terms of the bigger picture, my preference for the resolution of this very large B wave that we've been locked in since the low in February is for a C wave down after we reach that new high. This is the pattern of a expanded flat. However, technically, it could also be a running flat.
That means that the ES/SPX has multiple possibilities as to a target on the downside. Accuracy (in determining the most probable target) is going to depend upon both counting and measuring the waves to the downside. It's impossible to pick a downside target at this point in the process.
Volume: has picked up considerably on waves to the downside
Summary: Lots of conflicting signals this weekend. We've turned back up, but the question is whether we make it to a new high, or not. Is this a smaller 4th wave, or the start of the C wave down? We should see a resolution this week.
My preference is the larger structure (from January 29) represents an expanded flat. Once the c wave (down) is complete, expect a final fifth wave to a new high. That fifth wave up to a new high will be the end of the 500 year bull market.
___________________________
Trader's Gold Subscribers get a comprehensive view of the market, including hourly (and even smaller timeframes, when appropriate) on a daily basis. They also receive updates through the comments area. I provide only the daily timeframe for the free blog, as a "snapshot" of where the market currently trades and the next move on a weekly basis.
______________________________________
Sign up for: The Chart Show
Next Date: Wednesday, October 24 at 5:00 pm EST (US market time)

The Chart Show is a one hour webinar in which Peter Temple provides the Elliott Wave analysis in real time for the US market, gold, silver, oil, major USD currency pairs, and more. You won't find a more accurate or comprehensive market prediction anywhere for this price.
Get caught up on the market from an Elliott Wave perspective. You’ll also get Andy Pancholi cycle turn dates for the SP500 for the balance of the current month. There’ll be a Q&A session during and at the end of the webinar and the possibility (depending on time) of taking requests.
All registrants will receive the video playback of the webinar, so even if you miss it, you’ll be sent the full video replay within about an hour of its conclusion.


Thanks Peter!
In the intetest of learning more about EW methodology I have a few thoughts.
I am certainly no EW expert, and I am at a complete loss to understand why the EW count last week appeared corrective to you Peter, and so did not suggest the waterfall decline that ensued. For me personally as a trader, there were quite a few bearish portents and I can cite a few that caught my attention. First there were the reversal candles in DJIA. We had the shooting star, followed by a confirming bearish engulfing candle. We had negative divergence in the A/D line, RSI, price momentum, and very bearish VIX divergence on multiple time frames. There were additional hints from On Balance Volume as well as the bearish rising wedge patterns displayed by so many indices. I actually was able to count what appeared to me to be five waves down after the top, and one thing I learned in the chart show was if you get five waves, price is going lower. The very deep retrace after the first wave down did raise some uncertainty about a possible new high, but with all the other bearish evidence, I frankly did not think that would happen an may have even mentioned it out loud. After the market failed to make a new high last Tuesday, I assumed we were possibly looking at a likely first and second wave and traded it as such. We all know what happened next. My purpose in this post is certainly not to question the EW methodlogy, but to argue that as trader, not getting some clarity ftom my analytical approach ahead of a 2000 point DJIA plunge is hugely problematic. I have no idea why that initial wave down looked corrective as I did see a few other counts that also had an initial impulse down after the top. The key for me was the broken wedge in RUT. I assumed all the other indices sporting wedges would follow suit and therefore favored the 1,2 count with a third wave down to follow. The measured distance for a downside move was quite big. That is
apparently what we got and certainly the way I traded it.
I comtinue to learn quite a bit about EW methodlogy from the insightful material provided on this site. I am simply in spirit of honest inquiry, curious about what it was about last week’s wave structure that precluded a possible 1,2 count at the close on Tuesday. Thanks for all the lessons!
Verne,
In ES, the wave down (the A wave) started as a corrective wave when it came down in three waves from Sept 21. So, it’s a corrective wave from the start, and will never change. Of course, corrective waves can do just about anything they want to do with some limits. They will typically hit a fibonacci ratio, measured from the length of the A wave down. I’ve been warning my Trader’s Gold folks that surprises will be to the downside and that it wasn’t wise to trade what would have been the next wave up, still isn’t.
But in this particular case, with a count that’s questionable going up (the C wave of the large B wave up to Sept 21 has a questionable count – there’s an odd possible 1-2, 1-2 structure at the start of that wave up and the fib measurements don’t work), so it’s difficult to know what this wave down actually is (it’s a fourth, but of what degree?).
It could have been a flat, which would require 5 waves down from Oct 3. However, the C wave down from the 26th also came down as a corrective wave (the fourth overlaps the first), so we have a dilemma as to what the heck this wave is. NQ did a double top on Oct 3 and came down in 5 waves. So, on top of everything else (a wave that points both ways in ES), we have NQ that’s telling us it should not retrace to the top. These two indices at this point more or less travel in tandem.
There are times when the market gives conflicting signals and this is certainly one of them, and why we’re looking at the 62% retrace level for the answer. ES, based on the corrective wave down should retrace to the top, but NQ should not. So who’s right?
I count ES as a possible double zigzag, which could certainly be a first wave of a larger C wave, so my inclination is that the wave up will only partially retrace.
The short answer is that we just have an odd situation with this wave down, where there are few clues and an apparent non-confirmation. Rare, but the market sometimes does that.
In EW, first waves are a dilemma. You never know what they are until they finish. So, the methodology requires that you set them aside and don’t trade them. You wait for a second wave (or a C wave), because once you have a confirmed first wave (or A wave), you know you’re going to have a second wave that will have fib ratio relative to the length of the first wave. With a motive, first wave, you’ll always know the length of the third wave and subsequent wave.
Even when you have a confirmed A wave, there are options as to the length of the C wave. That makes a further drop problematic. Does it stay at the first fib ratio, or drop to a further one? If we’re sure of the previous count (we’re not in this case—I have to possible counts), then we’ll have a much better idea as to where the C wave will land.
So EW doesn’t tell you everything all the time, ahead of time, but once you see it all unfold, it always follows the rules and almost always hits fibonacci levels. The analysis comes from correctly reading the wave count, and deducing what the next wave will do, as a result. Most of the time, it gives excellent results. Occasionally, I’ll be wrong, but when I’m unsure, I will say so.
If this ends up being the larger C wave, I now know exactly where it will land because we have a confirmed A wave in place. If it’s not and we head up to a new high, I won’t exactly know where the next wave down will land, but I’ll know it’s the larger C wave (because it will confirm a previous count), so I can play the first wave down, and subsequent waves. But most of the time, you leave the first wave alone.
This is a long explanation for a situation that just happens to be ambiguous, so I don’t know if it helps, but that’s my thought process as I work through one of these “impossible situations.”
Let me add that going forward, I also have a very good idea when the next turn is going to be, but that has nothing to do with EW.
Keep in mind that we’re at the top of a 500 year rally, and as I’ve warned, you tend to get non-confirmations and other weird things happening, so we have a bit of an anomaly here to start with. You’re going to get “surprises to the downside” because of all the inherent weakness, but the EW wave structure won’t “break.” It just means you need to take a lot more caution.
Sorry, I made a mistake on the dates (from memory) The C wave came down from Oct 3, not Sept 26, so I made that change.
Thanks Peter! Your detail in the Chart Show at different time frames is very helpful. It helps me understand the alternate counts (and need to reduce position size) until we can confirm new high, or not. All the best for your detailed analysis. M
Thanks, mojo!
Hi Peter,
Thanks for all the information. That Elliott Wave is a science! I have heart that before. 🙂
In 2005 I did a research on the predictions of 35 Dutch analysts. Results:
the best was a clairvoyant / astrologist
second is an Elliot wave specialist. (the same one that predicts a high for the Dutch markets on 17th October) He claims also that it is a science and is stil learning. Also the recent decline he predict it very well. He is specialist in the AEX.
So I can confirm youre story and I appreciate your work and commitment. I could not do that. I have got a lot to learn, so I keep on following you.
Maybe I should not say this, but it is my experience: The people who have to deal with shares buy and sell. But most of those who have issued opinions about it did not receive the appropriate training there either. And act from an interest of the company they work for. And finally: The only way is up and when there is a crash? Sorry we did not see it comming. It is good to have specialists like you who train themselves and are not influenced by the big money from……………………banks and……………
Well, people like me are not well liked, because we’re a threat to the entire pundit industry. An extremely high percentage of people who comment on the market have absolutely no idea what they’re talking about, imho.
Monday starts with a (little?)decline, then up into Wednesday the 17th. Wednesday starts the decline. In to 24/25 october. Can be huge
http://www.prognoseus500.nl/
Thank you for the post Peter.
I tend to agree with your chart labels as drawn out
In today’s post .
I realize we never know for sure yet …..
When I think about Peter g posts on the 10 day trin which
I have also used for 2 decades the market is still considered overbought
Based on that yet oversold based on the advance decline methods I use .
Anyways, I have followed your updates for 3 years now and while there have
Been times I have not agreed with you, it was more from a timing perspective
Than a wave count .
Keep up the great work , I appreciate your time and efforts
Joe
Thanks so much Peter for for your kind indulgence. I know other readers will benefit greatly from your expert insight.
See you at the next Chart Show for the latest updates!
Hi Peter T,
Appreciate your hard work, Just wondering if you can post some of your last trade idea you shared with gold members, Do you give entry , stop and exit. Can’t monitor market and will help if i can see how you send signals. Can it be played along with options on SPX.
On a different note, you say home prices will come down by 50 to 80 percent but how do you justify this with current salary range. Home values in most place are still 3 to 4 times the annual salary.
Once again, nothing I say is to criticize but to gain more information and see how it can help me.
You can join the trader’s trial for two weeks. It’s free.
House prices have absolutely nothing to do with salary. They are a result of inflation/deflation. In other words, a house doesn’t change in value, money does. Houses go up and down in price based on the value of our money. A dollar today is only worth 4 cents relative to its value a 100 years ago. So, to purchase a house is going to be priced exponentially higher. To understand money and prices, you have to understand the effects of inflation and deflation on our money.
Bill.
I don’t need to defend Peter but asking him to give away trades that he provides to his PAYING subscribers is really not cool, and certainly not fair. It is stunning that anyone would make such a request considering all the free stuff already provided on the site! You want trade ideas? Go to the Chart Show! At 20 bucks it’s practically FREE, lol!
Thanks Peter T for answering.
So by that logic we should buy hard asset as we would need houses to live. If i understand what you are saying in simple terms, Say a person getting 100k can buy 400k home now….this house will be 1 million and his salary will only go up say t0 120 or 140 k. Did I get that in simple lay man language.
I don’t understand the question or your example. How can a 400k home be 1 million at the same time?
How else will u have a house effectively at 20 percent of current price. If house price falls , salary should fall. If dollar loses value than house price will go high and salary not so high. U r 20 percent cut has to have some meaning and some relations. May be I cant even visualize what you are saying.
I have bought and sold real estate over the past several decades .
The risk is that real estate is bought on leverage by the average person.
Because people borrow money to make purchases , interest rates matter to a point .
Credit scores matter, having the cash to make the down payment also matter.
real estate is not considered liquid . You can’t just hit the Sell button as you
Can with stocks .
Buying a 400 k home thinking it will be 1 million later assumes there will be financining
Available along with someone who can afford to make those payments .
Real estate ( your home ) is a consumption item and should not be considered
An investment . You buy it with the intent of wearing it out just as you do
Your car .
Right now I would not touch ANY real estate with a 20 ft pole and the reason is quite simple.
In the next 24 months you could probably get anything on the market for 60 cents on the dollar asked today, perhaps less. The only exception is real estate bought with cash for a business you own, or certain types of rental property.
Local and state governments are hatching a plot to solve their pension funding crisis by raiding the equity of the few Americans left with any. Holding any kind of real estate in this country is about to become a very expensive proposition, even for the home you live in, owing to these coming tax schemes. The twisted politicians know that in that cohort they have a truly captive audience. What do you suppose is going to happen when folk who don’t see this coming all at the same time are trying to escape the coming vicious tax bite by unloading their real estate, including the houses they live in?
Or you can play the 18.5 year real estate cycle, like I did and made 750,000 profit over about six year. Sold it in 2007.
https://worldcyclesinstitute.com/the-eighteen-year-real-estate-cycle/
I am off to read that post!
Hi Peter; In your update notes to the article there is a small typo saying you expected a top in 2081!
I know you meant 2018…. 😎
Thanks for catching that and letting me know. Yeah, the low of the cycle was in 2000, so I was expecting a top mid year this year latest … and it’s right on schedule. I’ll go change.
No problem! 😊
Sorry; did not quite get it. If the low was in 2000; shouldn’t the next low be 18.5 years later in 2018? Why would it be a high?
Wow! What an excellent read. The downturn could be even more severe than I anticipated. Here in the college town of Champagn-Urbana the builders are on steroids. I know they anticipate a U of I 10K boost in students but what is going is overkill. I expect many of these new buildings are going to have a very high vacancy rate.
Builders are on steroids here in Calgary, too! Our economy crashed about three years ago and we still have a 25% commercial vacancy rate, but I haven’t seen so much construction since the oil boom in the late 70s. But that’s always the case at cycle tops. You can look at the history of the Empire State Building, which finished in 1930 or so. https://en.wikipedia.org/wiki/Empire_State_Building
This article also mentions the World Trade Center, which completed around 1970, the top of the third wave of the US indices and then we went into a recession until 1975. Always at these cycle tops, we get a massive building extravaganza!
They are doing the same in Ames, Iowa, one of the 10 best places to live in the U.S… home of Iowa State University.
Yikes! It seems that human nature never changes! lol!
I’ll add something I’ve noticed on the west coast of the USA .
Basically those in California have moved up the coast every 11 years
And have driven home prices up then after a year or two they then have moved
Back to California for reasons I don’t know or care to know .
Back in 2001 I noticed those from San Francisco starting to move north and I bought
A house in southern Oregon thinking here they go again . I sold in mid 2005
I bought again in April 2009 with the mindset of I’d hold until this year 2018
Yet….. I do not see the movement of Californians moving up the coast .
This pattern of the past 30 years looks like it has changed . There is data showing
A movement out of California but I’m not seeing anything to prove a movement of people
Going north .
The Seattle area has cooled off to some degree but people still continue to chase homes by paying
More then the asking price . Homes selling with in 60 days vs a few days is now taking place for average
Homes.
Where I live I have seen home prices rise since 2009 but the actual bottom was in 2011 and not 2009 .
The past few years now I’ve seen home prices decline or flatline in my area in southern Oregon .
Verne
You are correct about taxes by government and it is directed towards property taxes .
I have fought with the tax office on this subject and shook my head in disgust dealing with them .
They do not care about an honest assessment at all. The old saying you can’t fight city hall shows true
They pick a number based on a model that has nothing to do with the true value of the house
To add a last point . If they feel your house is worth more your assessment goes up imeadiatly
Yet if you make your argument and they are to lower your valuation it takes a minimum of 1 year
And in my case it took 2 years to lower the valuation .
I paid 92,500 for my house and they assess it at 175,000 based on nothing !
I proved my case and eventually I got the assessment dropped to 132000
The past 2 years though they have added 40% which does not reflect the actual market .
My fear is that come November I’m going to get hot hard .
I’m expecting but Not hoping for at least a 30% increase on my property taxes even though
That is technically not legal . A 50% increase is even possible even though I think it’s a fraud .
It comes down to how they account for wear and tare of an older home vs a new home .
A new home is the base ( 100 % )
An older home is 100% minus the wear and tare . In my case I convinced them
To tax me at 37% of the base because of the houses age .
Now 9 years later I can argue with them all I want but if they change my calculation
To say 74% then my property taxes double .
The house is 103 years old but they don’t care because its got new room and new paint .
( lots of changes over the years ) I call them repairs but I’m sure they will call them improvements
And it’s impossible to win .
I would not buy in today’s envirenment .
I’m holding for maybe 2 more years before deciding to sell or not based on what may
Or may not take place and that decision is a local reason .
The talk of the past decade has been to invest 7 billion into this very small area to put in
An export natural gas facility . The trump admin has signalled that they will approve it .
If that fails to happen I’m ok but if it gets approved my house triples and I’m selling out
And moving .
Joe I think it is going to get much worse. I will tell you frankly that the way the government leeches are thinking, that in the not too distant future home ownership could actually end up driving ordinary folk into foreclosure due to an inability to pay delinquent ruinous taxes. For folk with a mortgage, the lender picks up the cost of the over-due taxes and simply adjusts the lender’s monthly payments with or without his permission. Just think about how the criminals in local and state governments could use this ploy to saddle homeowners with confiscatory assessments, knowing that at least the first big hit is likely to get paid whether or not the home-owner can afford to foot the bill. Never mind that fact that this approach will ultimately destroy the tax base as more and more folk loose their homes, but when was corrupt government ever known to think in terms of the long-term consequences of their myopic and self-serving decisions?
It is going to get ugly.
Here in SoCal, very few were selling at the 2009-2011 bottoms. Real estate may have been worth less, but getting your hands on it was another story. Now (and for the past several years) we’ve had a bigger issue due to a disruptive technology most folks have probably overlooked — AirBnB.
Rents were fairly stable prior to AirBnb, only rising with CPI at ~ 2%/year. Then landlords decided it would be a good idea to kick out long-term renters and go the short-term route. Why not? Instead of an average of $2500 monthly (for a small shithouse on the Westside) you can get 5K.
Only problem is (or was) all of LA county and other parts of SoCal have laws which specifically limit short-term rentals to 30 days or longer. This is one regulation I actually agree with (I’m a laissez faire guy) but unfortunately never got endorsed. Once the taxes started to be collected by AirBnb and paid to the city/state, officials turned a blind eye and let this absurdity continue.
Double the income potential = higher real estate values. It also forced renters to move inland, to crappier areas, causing low supply, high demand, and higher prices everywhere. Heck, go on zillow and see. Everyone’s heard of Compton. Want a crap shack with bars on the windows? 400K.
Property tax & insurance is another issue. Regardless of what you pay, if you plan on holding the thing for decades (or passing it on to your kids) you are GUARANTEED to pay the full purchase price of your home AGAIN.
Unless you bought here several decades ago at low prices & are grandfathered in to limited increases in property tax, you would have to be a Grade-A Moron to be owning anything here right now.
But the AirBnb issue still remains. When the rest of this country sees prices tumbling down due to rising rates, limited fed deductions, etc… one has to wonder… There will always be folks with disposable income who will travel here. IMHO, this somehow needs to unravel for prices here to drop.
Very interesting post Mike. The Air B&B aspect is a very interesting angle. I suspect in the coming recession even that lucrative business model will take a severe hit, and landlords will be happy once again, to find someone to provide a steady, if lower stream of income. In my state of Illinois the problem is going to be catastrophic. The fiscal and pension fund debacle here is among the worse in the nation. A few months ago the head of the Chicago FED actually floated the idea of a 1% across the board additional “temporary” surcharge on ALL Illinois real estate to “fix” the pension problem…
yes, you are thinking the same thing I am!
As beneficial in so many ways as home ownership is, I have been seriously reflecting on the lost “oppertunity cost” of sending 8K to the corrupt Illinois government every single year. Even at zero ROI, that is 80K over ten years! I am having a hard time justifying that from an economic sense point of view and think that money would be better served going to my children or even to charity. I lnow some people opt for a sttategy like a reverse mortgage but that approach still does not address the R.E
tax issue, which in any case still has to be paid from the proceeds of the reverse mortgage.
The bottom line is that if you own a home, the government will ultimately consume ALL of your equity by way of taxation. It is truly stunning once you stop and think about it
In the coming crisis equity consumption will simply happen faster than it normally does. The sad thing is that even this will not save them and state and municipal governments everywhere are still going to end up in bankruptcy. Peole are leaving Illinois in droves. At 0.65%, Indiana assessment is less than a third that of Illinois!
The great un-repoted and little understood crisis of California is the insolvency of the nation’s largest pension fund, CALPERS.
I am curious to find out what those folk are going to do when they find out most of their hard-earned money has been either mal-invested, or outright stolen, and just like Bernie Madoff, the statements they receive are nothing but a tissue of lies!
“Temporary” my a$$. Like the “Temporary” increase we had to the top income tax bracket here in CA, taking it to 13.2%… And the 46% gas tax hike we had here to fix the roads, which are still a mess. Meanwhile, illegal immigrants are enjoying the benefits of these hikes.
/rant
“Bingo!”
I think we will see an interim market low tomorrow with a ramp higher the rest of the week. It will be a make or break time for the market. I expect an at least 62 % retrace of the move down but no way I am trading it long. My plan will be to deploy a good sized bull put credit spread that I will definitely be closing the short leg of before the close. I expect brutal downside surprises from Mr.Market going forward. Today’s lull will I expect be the exception. Have a great evening everyone, and remember the Chart Show this week should be really spectacular as Mr. T once again lays out the road-map. Bye!
Mr T is running the chart show this week? I pity the fool who doesnt show up 😱
I highly rec everyone join the show..Gonna be a humdinger!
On a side note..imma closing my shorts over next day or so. Thanks SIR PETER on showing us the C wave plot.
You”re welcome and thanks for the kind words.
Ha!Ha! Me too!
Looks and feels like a wave 4. I would expect a drop to around 2675 – 2700 area before breaching 2810 (old pivot around 2792 – 2804). I do understand the fear of not trying to play from the long side. I am planning on going long when the drop comes using call 1×2 rather than through outright longs. You get the benefit of getting short vol as the market bounces and still have limited downside in case the market takes on a more bearish bend. I am looking for a bounce to 2840 after wave 5 of this leg is done. I will decide on the next move from there.
Well, Peter, I’ve got to hand it to you. I’ve been paying $50 / month to follow another EW practitioner who has more than 20,000 followers, but you’ve been more right than he has on calling the likely direction of the equity market, at least in recent months. Through his service, I get more details on ETF’s that you don’t typically discuss in your chart show, so I’ve been using him and supplementing that with your free blog (I’ve followed you for years as you know). I might cancel my subscription to him and go back to your trading service.
haha. thanks. I’m just an EW-following moron, trying to keep the bias out of my little brain.
Note on timing :
I have posted for most of this year that Oct 12 should be an important low
Recently I posted Oct 15 . The basis has to do with the start on the Venus
Bull market cycle
The next cycle high is Nov 7 which is based on the mars Uranus cycle
And that cycle targets a Jan 20 2019 low .
I’m not forecasting anything and it’s to early to call a bottom in place .
I’m only seeing 3 waves down at this point so it will be important to see
Just how far this market rises in this current bounce .
If I see a wave 4 then 5 down or if I see a deep retrace from the recent low .
The end result though is new highs should come next year .
Overall though the stock indexs have held up very well in this bearish cycle
This year.
Medical Cannabis: In Canada, recreational cannabis becomes legal tomorrow and I’m not aware of pricing at the moment.
But with that legalization, the Alberta government (the province I live in) has announced it is going to slap a 26.8% excise tax on medical marijuana.
So, if you have a chronic affliction (like I have, or let’s say epilepsy), the government is going to benefit greatly from your suffering.
At the same time, Canada has (apparently) the largest household debt in the world and crashing real estate prices in both Vancouver and Toronto. We also have a carbon tax here in Alberta. Everybody I know is suffering financially.
But what’s really weird is that Alberta is the only province that has changed regulations to require anyone using medical cannabis to meet with a doctor every three months, or the cannabis “subscription” gets cancelled.
Politicians tend to be some of the most ignorant people on the planet. Why on Earth would you support the medical cannabis system, when you can buy it legally down the street without all the hassle? You can always expect this kind of thinking by government at the top of a major cycle.
But … they’re allowing people to grow up to four plants in their home.
I’d guess they’re going to be surprised at what happens to the regulated industry next year ….
This bounce has given the whole decline a 3 wave look. Any further strength would shift probabilities to new highs in the coming weeks. I am a little upset at having not bought the dip. As Peter T said, it ain’t over till it’s over.
I bought calls at open and rode them to over 200% in profit today on SIR PETERS call for a 61.8%..retrace! As he says..trade what you see..Hopefully SPX bottomed and now we are in the 5th. Imma staying long for now!
Sir Peter is amazing is he not? So glad I had the humility to ask for his input when I was a bit fuddled about what was unfolding. The man know about what he speaks! When you stop learning, you stop improving….!
Three waves down it is. There is no denying that it was corrective, as deep as it was!
Of course that could change, but I am going with Sir Peter’s call on this one!
I did exit half my longs as the possible fourth not yet fully invalidated.
Any consideration of the pattern in USD/Huf?
Pay attention to whether it is correct in your own analyzes.
Today before noon we should make (or have made) the HIGH and the decline into 24/25 starts. (has to be fine tuned)
So pay attention it can be huge
watch http://www.prognoseus500.nl/
Thanks Willem. We now have 3 waves down and 3 waves up. If a decline starts today, then it will likely take us back below 2710 – however, given the 3 wave nature of moves, we have not yet seen the final high of this move. To me, that means buy the decline into next full moon !
the 240 minute cash dow close only line chart has
a wave 1 2 and waves I ii iii iv in place . the wave iv being this mornings low .
this marks 24924 as resistance . this would also be an important spot
because it would be the top of a 3rd wave or a C wave .
since I am looking for a high on or near nov 7th I must allow for an impulse wave
to complete which would imply waves 4 and 5 as a must .
Once I see 5 completed waves I will look for a 3 wave pullback to begin buying the individual stocks .
for further review I am posting these dates in history .
see post below
I call this research here are one piece of the venus bull cycle dates.
you can do your own research and check for the % accuracy .
nothing ever works perfectly yet I do think its worth understanding
as much as you can about any methods you use .
60 plus years of dates and these are just one half of them in regards
to venus . to post both venus and mercury would take up to much space .
Inferior Conjunction Is Exact 31 Jan 1950 1:40:19 am EST Aquarius
Inferior Conjunction Is Exact 3 Sep 1951 11:08:10 am EDT Virgo
Inferior Conjunction Is Exact 13 Apr 1953 3:14:53 am EST Aries
Inferior Conjunction Is Exact 15 Nov 1954 2:25:49 am EST
Inferior Conjunction Is Exact 22 Jun 1956 2:08:34 am EDT
Inferior Conjunction Is Exact 28 Jan 1958 2:46:40 pm EST
Inferior Conjunction Is Exact 1 Sep 1959 2:22:39 am EDT Virgo
Inferior Conjunction Is Exact 10 Apr 1961 6:50:32 pm EST in Aries
Inferior Conjunction Is Exact 12 Nov 1962 3:06:29 pm EST in Scorpio
Inferior Conjunction Is Exact 19 Jun 1964 6:40:06 pm EDT in Gemini
Inferior Conjunction Is Exact 26 Jan 1966 3:37:23 am EST in Aquarius
Inferior Conjunction Is Exact 29 Aug 1967 5:40:23 pm EDT in Virgo
Inferior Conjunction Is Exact 8 Apr 1969 10:10:19 am EST in Aries
Inferior Conjunction Is Exact 10 Nov 1970 3:48:51 am EST in Scorpio
Inferior Conjunction Is Exact 17 Jun 1972 11:08:32 am EDT in Gemini
Inferior Conjunction Is Exact 23 Jan 1974 5:19:31 pm EDT in Aquarius
Inferior Conjunction Is Exact 27 Aug 1975 9:10:39 am EDT in Virgo
Inferior Conjunction Is Exact 6 Apr 1977 1:29:10 am EST in Aries
Inferior Conjunction Is Exact 7 Nov 1978 4:34:06 pm EST in Scorpio
Inferior Conjunction Is Exact 15 Jun 1980 3:26:55 am EDT in Gemini
Inferior Conjunction Is Exact 21 Jan 1982 5:06:03 am EST in Aquarius
Inferior Conjunction Is Exact 25 Aug 1983 0:34:58 am EDT in Virgo
Inferior Conjunction Is Exact 3 Apr 1985 5:00:15 pm EST in Aries
Inferior Conjunction Is Exact 5 Nov 1986 5:16:21 am EST in Scorpio
Inferior Conjunction Is Exact 12 Jun 1988 7:59:56 pm EDT in Gemini
Inferior Conjunction Is Exact 18 Jan 1990 5:41:34 pm EST in Capricorn
Inferior Conjunction Is Exact 22 Aug 1991 4:20:52 pm EDT in Leo
Inferior Conjunction Is Exact 1 Apr 1993 8:11:27 am EST in Aries
Inferior Conjunction Is Exact 2 Nov 1994 6:11:46 pm EST in Scorpio
Inferior Conjunction Is Exact 10 Jun 1996 12:18:36 pm EDT in Gemini
Inferior Conjunction Is Exact 16 Jan 1998 6:18:07 am EST in Capricorn
Inferior Conjunction Is Exact 20 Aug 1999 7:57:42 am EDT in Leo
Inferior Conjunction Is Exact 29 Mar 2001 11:16:32 pm EST in Aries
Inferior Conjunction Is Exact 31 Oct 2002 7:05:49 am EST in Scorpio
Inferior Conjunction Is Exact 8 Jun 2004 4:43:06 am EDT in Gemini
Inferior Conjunction Is Exact 13 Jan 2006 6:58:41 pm EST in Capricorn
Inferior Conjunction Is Exact 17 Aug 2007 11:40:43 pm EDT in Leo ——————–
Inferior Conjunction Is Exact 27 Mar 2009 3:23:43 pm EDT in Aries ————-
Inferior Conjunction Is Exact 28 Oct 2010 9:10:14 pm EDT in Scorpio
Inferior Conjunction Is Exact 5 Jun 2012 9:08:58 pm EDT in Gemini
Inferior Conjunction Is Exact 11 Jan 2014 7:24:25 am EST in Capricorn —–
Inferior Conjunction Is Exact 15 Aug 2015 3:21:39 pm EDT in Leo ———-
Inferior Conjunction Is Exact 25 Mar 2017 6:17:03 am EDT in Aries ——–
Inferior Conjunction Is Exact 26 Oct 2018 10:16:02 am EDT in Scorpio ——
Inferior Conjunction Is Exact 3 Jun 2020 1:43:29 pm EDT in Gemini
if I posted the other half it would be the bearish “sell side ” dates.
no doubt there are a few who will note the failures and say hey this method
is no good . there are rules and observations that must be used yet these
dates do not change .
its roughly a 580 day cycle or you can call it a 19 month cycle
I think of it as roughly a 20 month cycle low to low .
all for me today
I know someone asked about USD..i have that it has either finished or still finishing II down and possibly in the beg of 1 Of III up..Peters count i think is different
Hi Joe.
Do those conjuction dates you posted have some correlation with market price or direction?
Sorry about my ignorance of this field so any additional insight on how to interpret the info would be appreciated. Thanks!
Yall think this retrace move up is done? I hadda target at 2850..but market sure looks weak.
Bought puts today and did quite well.
I’m on Willem’s side here. Sorry Joe. Not looking good for the next few days.
I tend to place a lot of weight on price action around contested pivots. I did not expect it but the reclaim of SPX 2800 yesterday was quite short-lived and its surrender today strikes me as important. Other indices are falling away from the 200 day after back testing and have also back-tested several broken and long-held trend-lines, but failed to close above them. Looks to me like an upward corrective three is done.
Peter T,
Thanks for your post, If I read correctly, 60 percent we go to new high and 40 percent we turn back from 2830… U still think its going on 60 percent route… or that decision is still not made.
If you plot spx chart using 50sma, 200sma and look at 8/19/15 , a potential fractal might be in play right now.
8/12/15 might be == 10/11/18.
I love fractals! Very interesting!
I have seen some amazing graphics generated using C++ programming. 🙂
Good eye… Did you use any software to catch this?
If it copies earlier move, will climb higher first, then go to second similar low creating a double bottom, then go back up to where the current decline started (not ATH)
Liz H,
I have gone back and looked at your reference to 8/12/15…What exactly are you saying or inferring? Btw where you been lately? Perhaps, I have missed your posts.
Ed. Do you know what a fractal is? If not look it up and it will help you understand what Liz meant.
The gangster mentality of corrupt Chicago politicians has now apparently infected the Chicago FED. We were recently talking about the scheme these criminals have to inflict a 1% across the board levy on Illinois real estate for 30 years to “fix” the pension problem. Zero Hedge is now carrying the story and gives additional insight into the thinking of these financial thugs, as they have now formally proposed this insane idea. They are so brazen in their perversion as to boast that people will not be able to avoid the tax by selling their houses as the house prices too quickly reflect the new taxes, and in the same breadth the new tax would not deter people from moving to Illinois as they will be attracted by the lower house prices.
Can anyone explain to me how such complete MORONS ended up in these positions? What do these imbiciles think is going to happen to municipalities who depend on the revenue from real estate taxes when house values are cut in half by such idiotic schemes? Can anyone say DEFLATION??!!
For Illinois residents, it is time to exit real estate.
Time also to ABOLISH the corrupt FED!!#
https://www.zerohedge.com/news/2018-05-12/audible-gasp-was-heard-when-chicago-fed-unveiled-its-solution-pension-problem?utm_source=engageim
I am curious. Does anyone else see why this hair-brained scheme will simply not work, or is it just me??!!🤔
A new blog post is live at: https://worldcyclesinstitute.com/us-indices-running-on-fumes/
This website is for educational purposes relating to Elliott Wave, natural cycles, and the Quantum Revolution (Great Awakening). I welcome questions or comments about any of these subjects. Due to a heavy schedule, I may not have the time to answer questions that relate to my area of expertise.
I reserve the right to remove any comment that is deemed negative, is unhelpful, or off-topic. Such comments may be removed.
Want to comment? You need to be logged in to comment. You can register here.