
The Unified Cycle Theory

In 2014, I conducted an interview with Steve Puetz, the author of the Unified Cycle Theory (2009) which was a ground-breaking book, following in the footsteps of several years of work I’d completed on cycles. I had just finished researching the work of Dr. Raymond H. Wheeler and was searching for more material that might back up his work in the 1930-50s.
Mr. Puetz has stumbled onto cycles as a market analyst and got more interested after reading the works of Edward R. Dewey, also from the 1930s.
In Steve’s book, he painstakingly reviews all the major cycles and discovers the harmonic properties, as well as confirms the work and cycles of Wheeler, who concentrated on climate cycles.
Steve graciously spent about a half hour on Skype with me, giving me some background and an overview of his work. I’m providing a video of the bulk of that interview here.
Stephen J. Puetz interview
Interview: Stephen Puetz  |
 |
Make sure you zoom the video to full size with frame expander (arrows) in the bottom right hand corner and also set the quality to as high as your web connection allows. This is a high definition (HD) quality video so the best viewing is at that level. |
_______________________________
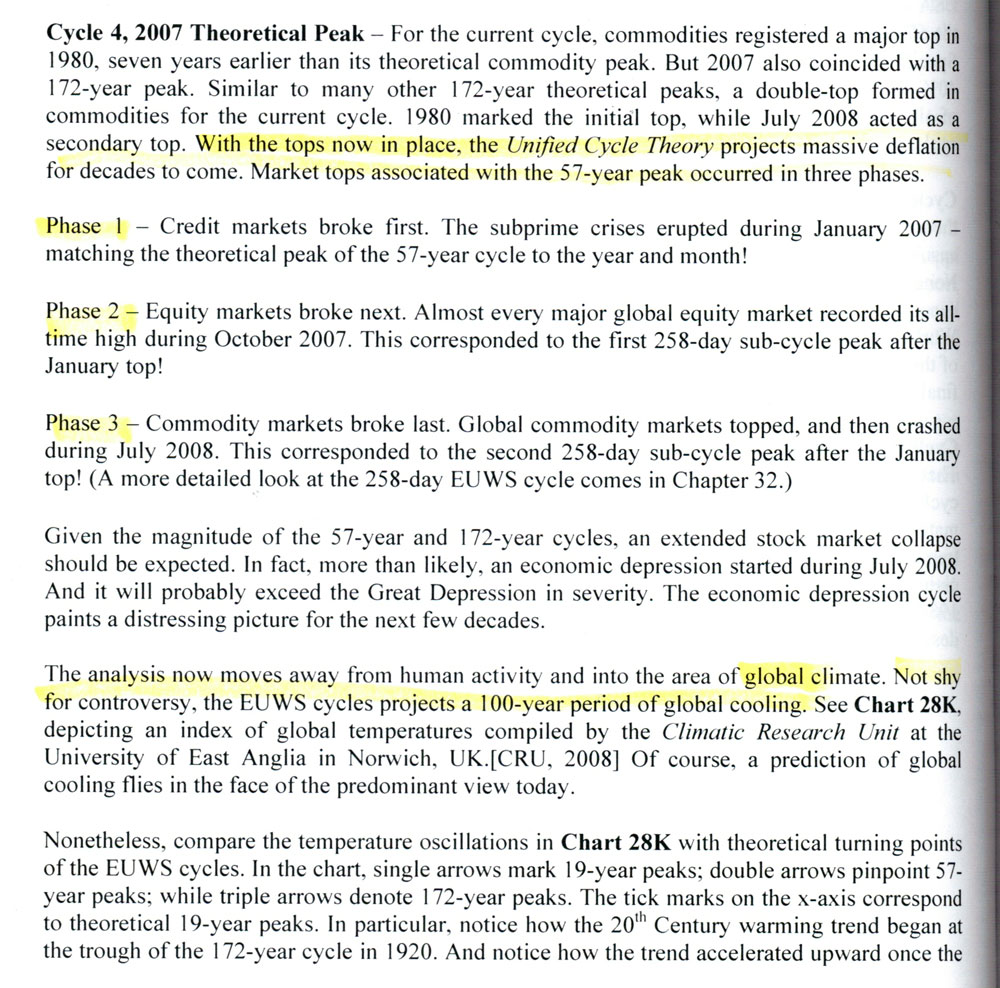
Following is an excerpt from page 324 of his book, which describes the 2007 theoretical top and the cycle attributes leading up to it.
If you’re interested in purchasing Steve’s book, here’s a link to Amazon:
___________________________
Ending Diagonals
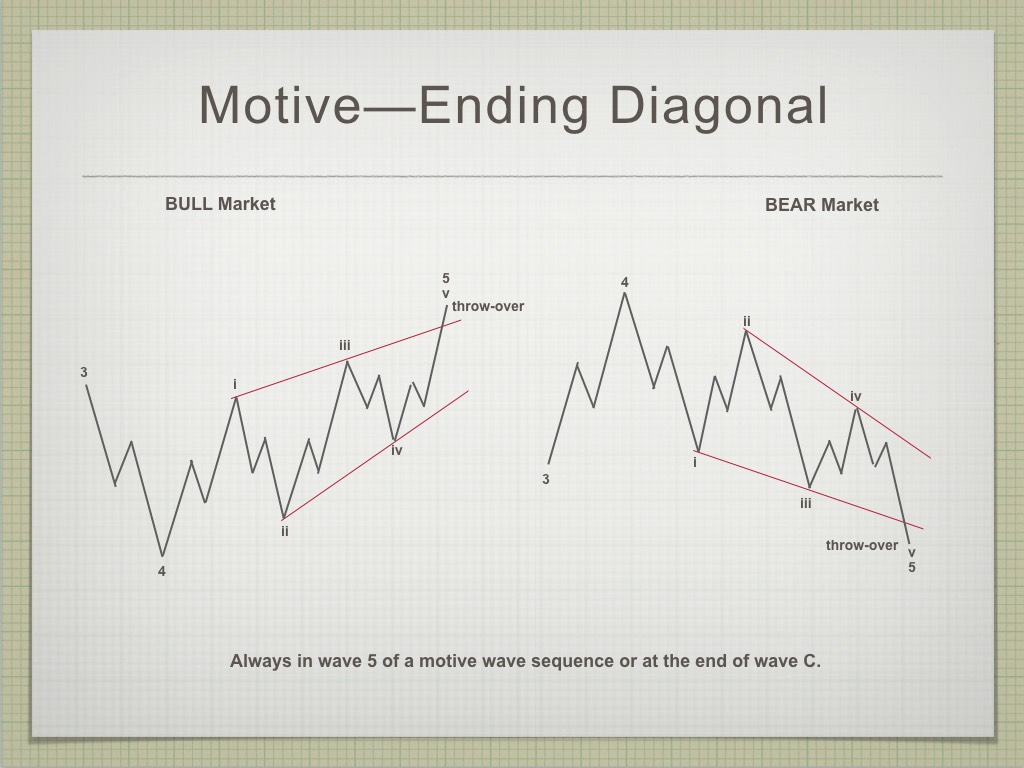 Ending diagonals are notoriously difficult to trade. There are a number of reasons for this. The biggest is that all the waves are in threes and the upper and lower boundaries don’t get defined until the 3th wave (upper in a bull market) and 4th waves (lower). So, you don’t actually know you’re in one until the fourth wave of the ending diagonal is in place.
The sub-waves will be in three waves (zigzags), which makes analysis difficult, volume gets lower as the ending diagonal traces out, and the final wave will likely complete a throw-over (exceeds the upper trendline in a bull market).
Rules (these are “hard” rules; they cannot be broken):
- A diagonal triangle always subdivides into five waves.
- An ending diagonal always appears as wave 5 of an impulse or wave C of a zigzag or flat.
- Waves 1, 2,3, 4 and 5 of an ending diagonal always subdivide into zigzags.
- Wave 2 never goes beyond the start of wave 1.
- Wave 3 always goes beyond the end of wave 1.
- Wave 4 never moves beyond the start of wave 3.
- Wave 4 always ends within the price territory of wave 1.
- Going forward in time, a line connecting the ends of waves 2 and 4 converges with a line connecting the ends of waves 1 and 3.
- In the contracting variety, wave 3 is always shorter than wave 1, wave 4 is always shorter than wave 2, and wave 5 is always shorter than wave 3.
_________________________
Elliott Wave Basics
There are two types of Elliott wave patterns:
- Motive (or impulsive waves) which are “trend” waves.
- Corrective waves, which are “counter trend” waves.
Motive waves contain five distinct waves that move the market forward in a trend. Counter trend waves are in 3 waves and simply correct the trend.
All these patterns move at what we call multiple degrees of trend (in other words, the market is fractal, meaning there are smaller series of waves that move in the same patterns within the larger patterns). The keys to analyzing Elliott waves is being able to recognize the patterns and the “degree” of trend (or countertrend) that you’re working within.
Impulsive (motive) waves move in very distinct and reliable patterns of five waves. Subwaves of motive waves measure out to specific lengths (fibonacci ratios) very accurately. Motive waves are the easiest waves to trade. You find them in a trending market.
Waves 1, 3, and 5 of a motive wave pattern each contain 5 impulsive subwaves. Waves 2 and 4 are countertrend waves and move in 3 waves.
Countertrend waves move in 3 waves and always retrace to their start eventually. Counrtertrend (corrective waves) are typically in patterns — for example, a triangle, flat, or zigzag. Waves within those patterns can be difficult to predict, but the patterns themselves are very predictable.
Fibonacci ratios run all through the market. They determine the lengths of waves and provide entry and exit points. These measurements are really accurate in trending markets, but more difficult to identify in corrective markets (we’ve been in a corrective market in all the asset classes I cover since 2009).
To use Elliott wave analysis accurately, you must be able to recognize the difference between a trend wave (motive) and a countertrend wave (corrective). There’s very much more to proper Elliott wave analysis, but this gives you the basics.
____________________________
Registration for Commenting
Want to comment? You need to be logged in to comment. You can register here.
If you register, it protects your information. It also allows you to comment without filling in your information each time. Once you’re registered, simply go to the home page and click on the login link top right in order to log yourself in. Usually, you’ll be logged in for several days before needing to be logged in again.
______________________________
Problem receiving blog comment emails? Try whitelisting the address. More info.
______________________________
A true expert in Elliott Wave FL 2
A true expert in Elliott Wave …You are a true expert in EW analysis. What you provide is not available anywhere and is priceless. Subscription on your services is the best thing I have ever done. Many thanks for your effort to make me a better investor. I now have more trust in my investment decisions. I hope you will continue the excellent work! —FL |
Rise above the rest … SM 2
Rise above the rest …I have only ever met a few people who, in their chosen fields (astrology, medicine, music, martial arts, technical analysis), rise above all the rest and you are one of them…you have ‘the gift’…and that’s why I’m a Trader’s Gold member. —SM |
The best of them JL 2
The best of them …Last couple of years, I subscribed to several ‘market traders’. You are by far the best of them and the personal contact is awesome. Daily and daily updates are very well written! Besides your expertise in EW, I also like your cycles analysis. Best investment I ever made! —JL |
Have not had a losing week RW 2
Have not had a losing week …I have been with Peter almost a year. The only thing that matters is have I made money with his service. I think I have finally turned the corner using Peter’s EW. I have not had a losing week in the last 5 months. Thanks Peter, for your amazing amount of hard work. —RW |
Get an upper hand … JC 2
Get an upper hand in trading …Seeing all the different currency pairs and the wave structures and hearing you explain why this has to do that on a nightly bases gives one a upper hand when trading. Elliott Wave applies to all stock and indices and can be applied to any candlestick chart. If someone ask what you want for Christmas – Tell them a membership to Peter’s “Traders Gold!”—JC |
the real deal SM 2
The real deal …‘Educational, insightful and thorough market analysis for all levels of traders. It’s Elliott Wave at its best….Peter Temple is the real deal’ —SM |
Couldn’t be happier … KK 2
Couldn’t be happier …The analysis and insight you provide is simply amazing! I’ve been trading the futures and equity markets for well over thirty years and usually average around 5% monthly. Since joining your Traders Gold Service two months ago, that number has better than doubled. I couldn’t be happier.—KK |
Tops in your field DZ 2
Tops in your field …You are tops in your field. Tried to follow Elliot Wave international for years. They were always behind the market. After discovering you, I perceive that you are an expert in reading the waves, which puts you way ahead of the rest of your peers. And you can read the Waves like you are reading tomorrow’s financial section. I pray you stay healthy. —DZ |
The Market This Week
Here's the latest daily chart of ES (emini futures)
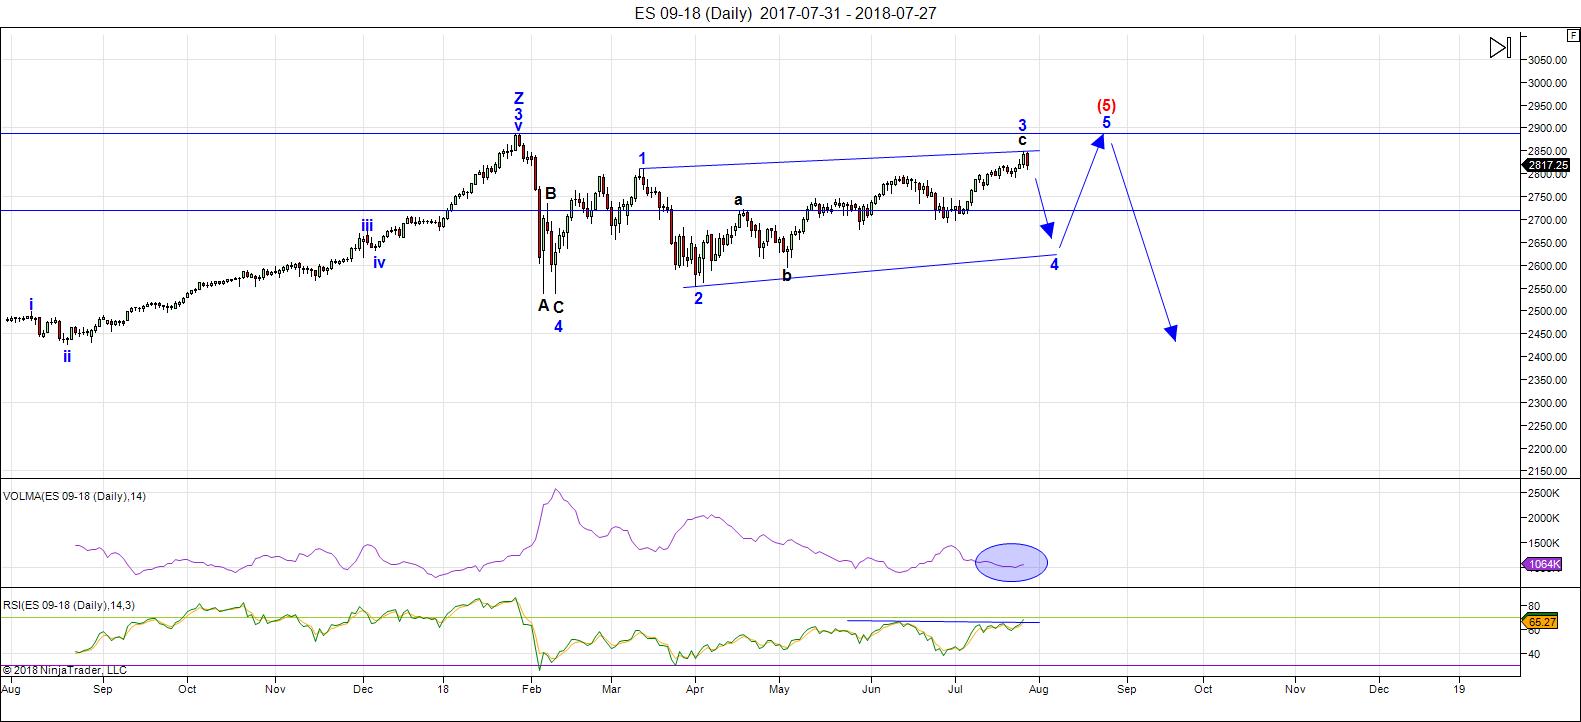
Above is the daily chart of ES (click to enlarge, as with any of my charts).
Nothing has changed in my projection from last weekend, or from the predicted path I presented in the Chart Show on Wednesday of this past week.
We're still waiting for this complex third wave of the ending diagonal to top. Last weekend, I predicted one more wave up to a final high and that still seems to be the case.
It's amazing how often the NYSE comes into play when we have a major turn taking shape. It seems to me that we're waiting for it to spike to a new high so that it either morphs into a barrier triangle, or more likely, an ending diagonal, like almost every other US equities index.
The third wave of the larger ending diagonal, which we've been in now since the beginning of April (18 weeks as of this weekend) is always the most complex and longest wave. Once it's complete, we're about 75% of the way through the ending diagonal. We have one more wave down (a fast one — wave 4) and one more wave up to a final high (these waves can be fast or slow, but they go up in three waves and cannot be longer than the height of the third wave).
The coming wave down (the fourth wave of the ending diagonal) will have a target somewhere near 2600-25 (depending on where the third wave finally tops). Then we'll turn up into the fifth and final high ... but a high that will have a definite maximum target (to be determined once the fourth wave is fully in place).
Summary: We're waiting for the final fifth wave of the larger third wave of an ending diagonal to top. Once it ends and turns down, we'll drop into the fourth wave of the ending diagonal in ES. Once the 4th wave (down) is complete, expect a final fifth wave to a new high. That fifth wave up to a new high will be the end of the 500 year bull market.
___________________________
Trader's Gold Subscribers get a comprehensive view of the market, including hourly (and even smaller timeframes, when appropriate) on a daily basis. They also receive updates through the comments area. I provide only the daily timeframe for the free blog, as a "snapshot" of where the market currently trades and the next move on a weekly basis.
______________________________________
Sign up for: The Chart Show
Next Date: Wednesday, August 15 at 5:00 pm EST (US market time)

The Chart Show is a one hour webinar in which Peter Temple provides the Elliott Wave analysis in real time for the US market, gold, silver, oil, major USD currency pairs, and more. You won't find a more accurate or comprehensive market prediction anywhere for this price.
Get caught up on the market from an Elliott Wave perspective. You’ll also get Andy Pancholi cycle turn dates for the SP500 for the balance of the current month. There’ll be a Q&A session during and at the end of the webinar and the possibility (depending on time) of taking requests.
All registrants will receive the video playback of the webinar, so even if you miss it, you’ll be sent the full video replay within about an hour of its conclusion.


Peter
Thank you .
I have yet to buy puetz book yet from the brief read I think I’ll have to.
I didn’t realise he was aware of the 58 year cycle ( I know the post states 57 years )
Nor was I aware of anyone noticing the 258 day sub cycle ( I have used 252 trade days for years which is close )
1987-1929= 58 years
I have blended the work of Chris carolan with Stephen puetz over the years and have studdied
Both of their crash theories in depth yet I obviously have more studies to do !
Thank you for your time and efforts I appreciate it more than words can say
Joe
I thought you probably had a copy. It is a must-own for anyone interested in cycles.
Hi Joe,
I thoroughly recommend his book.
He outlines a number of different geomagnetic cycles in there, including the eclipse cycle.
Dan
Looking more and more like we get a new SPX all time high in this 3rd wave. Though we technically have a new high in the 5th so this could turn sometime soon.
My new self imposed rule is to trade only the long side for US indices until the S&P drops below 2500ish. I’ll miss the first part of the crash but the remaining parts will provide great opportunity.
That’s smart. Only 15% bears right now and zero follow through on down days.
Yep. ED imvalidated.
So far so good trading this impulse up with bull put credit spreads.
I have been able to buy back short puts and roll strikes up, take a small profit and remain long puts for the upcoming reversal. Re-deploying SPY put credit spread two strikes higher at 281/283, and will buy back short puts at break-even, remaining long 281 strike puts with August 17 expiration. Hope everyone is taking advantage of this move up which was clearly signaled last week. Trade what you see!
The Steve Puetz interview is now live in the blog post.
Great video.
Thanks Peter! Great interview. I am adding both volumes to my library.
ES now on the verge of a new ATH. It seems to me a foregone conclusion as this move up is not done. I am now very seriously of the opinion that we could be in a final wave up.
We must top today otherwise Peters triangle will probably break so I’m looking for a drop to start any moment.
And you cold well be right about your foregone conclusion, Verne, but take a look at this chart and respect it until or unless you see a convincing breakout above both a short term channel and a simple trendline from the March high through the July 25 high last week. https://imgur.com/a/MhA0BCl
We hit it virtually exactly today. Add to that the fact that the S&P is now in the gap that occurred right after the January top and I’m not so sure it is a foregone conclusion for new highs. Also remember the Eliades cycle that pointed to the July 25 high almost exactly. Yes, it was surpassed on the S&P today, but not on the Dow. One more tidbit! Usually if you chart the closing VIX price in relation to its Bollinger bands, a close above the upper band followed by a close inside the bands is oftentimes a good buy signal, at least short term, while a close below the lower band followed by a close back inside the bands is often a good sell signal. VIX closed today below the lower Bollinger Band. A close above the lower band i.e. inside the bands would be at least a short term sell signal. It is a relatively rare occurrence as it has happened only twice in the past 2 years. I actually prefer using the “old VIX,” symbol VXO.X. The last signal was given April 18 and was a good short term signal sell signal.
I think Peter already discatded the triangle
Oh didnt realise that. I really am itching to go long. Hard to watch the bulls run riot without joining them lol.
Great points Peter G. It would indeed be seismic if SPX got this close and fauled to notch a new ATH.
We will most certainly have our answer today, If the gap is to indeed prove to be resistance, the rejection should be quite decisive. Right on on volatility. I have been steadily accumulating as I ecpect even a potential to confirm negative divergences.
Peter G,
I looked back at the commentary you shared from Eliades a week or two ago and neither the S&P or the NYSE have exceeded those highs in the projections boxes on this rally. Do you think that Eliades’ interpretation would be that…That is significant!
My guess in association with the chart I linked above, Ed, is yes, and it could, of course, be significant.
It is profoundly amusing that with all the manic trashing of VIX today they have yet to push price to new ATH. It was absolutely hilarious how they stepped in just as it was about to clear 11.25 in an impulse up and stomped it. What a bunch of clowns! 🙂
New all time high for SPX coming up. We are witnessing history folks. My target is 2876-80 for top of wave 3
If one still thinks news doesn’t drive price, I give you tsla action today.
News doesn’t change the projection or overall market direction. We’ve been waiting for a new final high in Tesla because there are three waves to the downside. This is the project wave to a new high.Nothing unexpected.
Thanks Peter but I find it confusing considering you said early January TSLA has topped.
Well, you’re going to have to find that January quote, because in December of last year, it was clear it had come down in three waves and again in March, I said TSLA has to get to a new high for the same reason. I don’t care how it does it, but the new high has been a foregone conclusion for a long time.
Peter, here two posts saying tsla has topped.
https://worldcyclesinstitute.com/a-pending-top/
https://worldcyclesinstitute.com/more-sideways-to-come/
I stand corrected- I stated that from memory, as I don’t follow it on a regular basis. It was April I corrected that 3 waver down into an ABC wave and said it was headed back up. I did that when it was at 240 when it became really obvious we were not going to complete a fourth wave. But looking back, it was November, when it came down in three waves. I’ve been saying for months that it needed a new high. For all intents and purposes, the previous high was the top of five waves, so it has all but topped.
The point is that news does not affect price to the point that it changes the prognosis. We’ve been expecting a new high in TSLA for months now (I have since April). This is the final 5th of the 5th.
Elliott wave is all about probabilities. At the time, the probability is that it had topped. You can’t confirm a top until a first wave down of five waves, a second wave up in three waves to 62% and a wave down to a new low.
So, if this isn’t the final wave to a new and final slight high, you can certainly slam me then … lol.
That is clearly an untrue claim that has always amused me.
I think people who say that mean to say that news does not change the larger EW trend, a more plausible claim.
It is a very interesting consideration. For example, there are some EW analysts who deny that we have been in a bull market the last ten years because they consider the wave up to be corrective. Clearly these are silly arguments unless you clearly define what degree of trend you are talking about it. Anybody trying to trade a corrective wave the last several years had their you-know-what handed to them. 🙂
Speaking of TSLA, I wonder how many additional billions Musk has been borrowing to buy back his own stock! 🙂
Here is an intetesting treatment of the math implications of taking TSLA private at 420 per share. Funding secured? What B.S.!!
https://www.zerohedge.com/news/2018-08-07/tesla-jumps-saudis-reveal-2-billion-stake
I’m typing fast because I’ll lose reception shortly.
News events vs musk .
He only Said he was ” thinking” of taking tesla private.
Why is this not ” manipulation ” he buys his own stock to
Support price as well . So what if he was selling shares today ?
I don’t know or care what he is doing I’m just pointing out my thoughts.
It would be very interesting to read the insider buys and sells on tesla .
As for the cash Dow, it still has not poked above 25,800 yet today it’s closer.
With a few days left for the week I’d prefer the cash Dow gets up there this
Week to finish off this 3 wave rally ! 25800-25916 range would be perfect for a high
And if we get the big dump after that then the larger triangle has prefrence .
Wave A down into Feb or April May and this leg up being a B wave .
The fun begins next week .
Verne
What’s your take on vix trading ? I have not traded it so considering your input .
I am not an option seller ( long story why )
Looking for long calls on vix as a directional trade
Basis Sept and Oct and January .
Any thoughts on key support or resistance to target ?
Any key level vix needs to break ( on upside ) ?
Anyways the door is open for a trade to the downside
Right or wrong the opportunity time wise is this week for a top
Yet price on cash Dow needs to poke above 25,800 for me to pull the trigger .
No phone for me for a day and a half .
Thanks for the puetz interview Peter t. I heard only part of it yet will try to listen to
All of it once my reception is better .
Cooling weather off California coast
Joe
Musk tweeting “Funding is secured,” but provided no details , I have no idea why this isn’t considered fraud. https://app.hedgeye.com/insights/69452-is-tesla-going-private-our-response-to-tesla-ceo-elon-musk?type=bearish
I have been a buyer of VIX calls under 12 fairly consistently and typically go out at least 30 days to expiration. A move below the lower B band makes an even more compelling case with a full moon on the 26.
MDY confirms new ATHs on the way. I am expecting we will see new moon highs this lunar cycle.
Looks like yet another fourth wave triangle today so probably one more wave up to new ATHs in indices this week.
Verne, you may be right about 8/11 or 8/13.
AI computerized trading systems do not know truth from fiction .
Musk has also capped the stock at $420 per share .
I’ll consider shorting it .
Look at just about any legit buy out , most all turn down
Following the spike to near or at the targeted buy out price .
It will take time to even get the vote through let alone the financing
In place .
He opened a
Looks like it! 🙂
…can of worms with that tweet…hope he can put his money where his mouth went…
Sure starting to look that way…! MDY at ATH today. 🙂
I like the fact that virtually everyone believes new new all-time highs are a foregone conclusion. Today’s S&P cash high was just over 0.3% away from the January ATH so it would seem obvious that’s about to be taken out. But I am a strong believer in parallel channels. I showed you a link to some a few days back that was broken above. That’s fine! That in itself gives you information. Then you search for another channel or two. That’s just what I did and here’s what I found. Sometimes the ES futures without Globex present different channels than the charts including Globex (overnight trading for you newbies), and I have found no good rule that says one rules over the other. The following link shows ES futures including Globex and today’s high went right to the top of two channels, one a short term one depicted by the dark lines, the other a longer term channel depicted by the green lines. Notice the almost perfect matching up of the dark short term upper channel with the longer term green upper channel line. August has been a great important turn month historically and although the “long term” Bradley indicator does not top until August 28, I would not be surprised to see a top right here at the upper channels on this linked chart. If the upper channels here are surpassed, then we might well have to wait for the end-of-month Bradley for the next topping opportunity. By the way, I mentioned a VIX Index Bollinger Band sell signal if the VIX closed back inside its lower Bollinger Band. It just missed doing that today, but the old VIX, symbol VXO did indeed give a sell signal today by closing back inside the Bollinger bands, albeit by only a narrow margin. These are very, very exciting times because virtually no one is looking for a major top here. I mean right here and right now. If it does not occur, look to around August 28 and the so-called long term Bradley turn! Here is the link to the channel chart. Click on the chart to expand it… https://imgur.com/a/FWgbYNK
https://twitter.com/corpfinsvcs/status/899584813841223681
3/6/2009 + 3452 CDs = 8/18/2018
Peter G,
Thanks for sharing that chart and insight!
I have 2 astro dates that might give a high to low in the SP500, August 9 and August 29.
Goodluck everybody.
As I understand the Puetz Crash Time Window is 6 weeks +3 days on either side of a Solar Eclipse, and by definition, a solar eclipse is always New Moon.
Now during 6 weeks and 3 days on either side of a Solar Eclipse, there will be 4 Full Moons, and there are at least 2 and sometimes 3 Solar Eclipses each year.
That gives a time window of at least 8 Full Moons per year. There can be no more than 13 Full Moons per year.
Does that mean Puetz’ Crash Time Window encompasses over 60% of the Full Moons each year?
Mia, I have copied and will paste a post I made back in February of this year:
This is not a prediction. It is a reminder of the research by Steve Puetz (pronounced Pitts) on market crashes. 1)Lunar eclipses or full moons one cycle away from a lunar eclipse were always coincident to the beginning of the famous market crashes. 2) The full moon coincident to the beginning of the crash has always been within 6 weeks of a solar eclipse. 3) The “panic phases” of all 12 crashes studied were entirely encompassed within one of the following periods: a) February 4- April 5, b) September 3- October 29.
I hope that is helpful…
I am really intrigued by Puetz’ thesis that the forces behind all these cycles are natural, that is physical, and by physical I would include magnetic and gravitational forces. If this thesis is true, it makes me wonder how this affects other market forces like CB intervention and algo trading. The typical response to a query like this is that since human beings wrote the programs and the larger forces affect humans then by extension that influence is built into the programs written by humans. I think that is a bit simplistic. Obviously in the case of CB intervention we can posit that their actions can be directly influenced by the larger forces in play.
That is not so evident to me when it comes to computers. I do however have another thesis. It is possible that the affect of these larger controlling forces of market destiny can also play a role in the ability of programs to PHYSICALLY perform in times of a cycle downturn, thus limiting their ability to over-ride what humans are doing? I think this is a very relevant question as we are dealing with markets that have virtually no volume. A remarkable number of hedge funds have taken their marbles and gone home and there are very few real live players in the field. I read somewhere recently that 65% of market volume was due to trading programs. That is really astonishing, and in my view requires any theory of market behavior to account for that reality. Thoughts welcome!
Here are two more remarkable channels on the S&P cash. The perfect setup is when price moves virtually exactly to the confluence of two separate channel lines (that’s what happened on SPX yesterday). Sometimes it’s just a market “tease” and it goes galloping through the channel. Other times, however, that confluence can mark an important market turn. Look at the confluence of these two SPX upper channel lines and notice how Mr. SPX price moved up to meet them almost exactly yesterday. The lines are both rising, of course, so you could pull back and move up to them at a higher level, but it was an ideal setup yesterday as price met the intersection of the lines at the intersection point. Just another fakeout? We should know pretty soon!! Take a look! https://imgur.com/a/E7bcHki
Very interesting Peter G.
I remarked a few weeks back how options delta did not appear at all to reflect lunar influence. If we are on track to see a full moon low, what is happening with VIX right now is even more remarkable as delta is being discounted! Of course one could argue that this is anticipating a new moon/eclipse high and that VIX will swiftly correct after. We will see!
I keep adding to my SPX calls on EVERY dip. Working like a snake charmer so far. New highs here they come!
If you were in last week’s Chart Show, you know we’re right on track. Tonight I’m going to show you where the turn will occur and I’m going to review the counts on the FANG stocks.
My keen interest now lies in how price behaves in the upcoming August 11 to August 26 time frame. I think the best trades are made when one becomes aware of critical inflection points in the market as opposed to mind numbing and stupefying myopia that comes from pre-occupation with every single market tick.
We know the great weakness of EW analysis is that it tells you very little about WHEN price will do what is predicted. Most people who claim to have some method of market prognostication will probably waste your valuable time with hit or miss approaches that do no better than the flip of a coin. I have found very few willing to actually demonstrate the reliability of their method by actually making trades in real time, very few indeed! So far as I am concerned, if you can trade it, it is worse than useless. If things play out the way I expect with confirmation of a reliable lunar cycle, even with a leeway of three or four days, I suspect there will be some drastic changes to the way I look for set-ups and execute trades. One could argue, with a consistent lunar influence of market price, that a couple oftrades per month (lot adjusted of course) is all you need! 🙂
Going back to August earnings last year, so far, all TSLA gap ups have been filled a few days later.
Short interest remains massive. They are calling the “Musk Bluff”.
I exited short puts of my bull put credit spread today and will be holding long puts for more downside. VIX price action now highlighting extreme bullish sentiment. In after hours trading the diamonds have taken out the cash session lows. I am now holding the biggest long vol position in quite some time. USO puts came alive today and bear call spread looking good. Here is hoping for some very bearish lunacy. I will report back in a week or two. 🙂
I’ve just been buying calls on EVERY dip in this 3rd wave. Waiting on new ATHs before I stop. Bought some spy calls on today’s dip and up 31% so far.
Out at 38% gain as my daily target was 286 for SPY and got within 3 cents. Close enough for a cigar for me!
I have to say Charles, I do admire a trader, win or loose, who puts his money where his opinions are…nimbly and nicely done! 🙂
Verne
There are a few good traders who publish their trades real time. It’s rare yet they do
But they also charge .The key though is calling the market ahead of time .
Peter g
It’s a rare moment yet we are both in agreement of the now or end of August date .
The cash Dow continues to fail , to me that is a red flag that is being ignored by many .
You are quite right Joe and I know a few of those guys who are very good indeed. In fact I learned a lot from some of them. I was really talking more about what one sees on public forums. I guess you get what you pay for! 🙂
Nice scalp! You are a braver man than I. With VIX at these levels I think long trades are dicey at best! I am out as well! 🙂
Here’s an update from Lord Rothschild himself (I’m not a fan, as you might know).
https://www.zerohedge.com/news/2018-08-09/lord-rothschild-new-world-order-risk
The mars Uranus sub cycle peaked Aug 6 along with the mid point
Of mercury retrograde . Not going to add in the flawed puetz window
Mars Uranus is now pointing slightly down until Aug 31 at which point
It accelerates down into Oct 12 th. That Aug 31 date does correlate with
The Aug 26 new moon and yes it does correlate with the puetz window
As well as the 10 lag of mercury retrograde ( mercury goes direct Aug 19
Plus 10 days in the 29 th ) yet the mars Uranus cycle continues down
Into Oct 12 th . In October ( I have the date but can’t recall at the moment )
Venus and mercury and the sun will all conjunct ( come very close together at the same time )
That October conjunction will begin the starting point for what is called a Venus bull market.
Bottom line : we have entered several bearish cycles and must allow for a bearish trend .
The Oct 12 low ( sub cycle ) based on mars Uranus as well as the Venus mercury sun conjunct should
Produce a bounce yet the mars Uranus cycle does not call for a low until Jan 20 2019.
The cash Dow has failed to poke above 25,800 and if it continues to fail by Sept 9 then
It cannot be considered a larger triangle from understanding ( observations ) of triangles .
This therfor argues we have been in a larger B wave of a flat that will take the cash Dow
Below it’s Feb and April May lows . The only way I can consider the Dow in a triangle formation
Would be if it was to poke above 25,800.
Timing wise the door is open for a mini crash ( mercury retrograde mid point high Aug 6-7 fit that mold )
Mars Uranus sub cycle high Aug 6 allows for a long term drop as well as a larger point move down.
Expect suprises to the downside .
The spx having gone further to the upside relative to the cash Dow may add further pressure
By having the effect of pumping the cash Dow lower same effect with the nasdaq .
Maybe just maybe we are witnessing the out going old and the incoming with the new .
The agriculture cycle then the industrial revolution etc…
From bank tellers to atm machines to kiosks at McDonald’s to a cashless society .
We all know what is coming so now is the time to focus more on the forest than
The trees. The weather is cooling, crop failures possible maybe a Florida freeze come December.
Mid term elections and headlines are ” claiming” the democrats have it locked up.
The proverbial crap is about to hit the fan yet from my point of view this will be nothing more than
Wave 4, the last dip before the final run to the top .
This drop can go below the Feb lows and turn the masses bearish not to mention become extremely oversold
Before turning back up with a vengeance !
Staying bearish into January .
Lastly: start following the xau and hui index’s along with the CRB
And various commodities . I’m no gold bug mind you I’m just seeing
Opurtunity setting itself up.
All for now
Joe
I am wondering if there are others on the forum who have already formulated plans for the coming cooling period, such as a possible move closer to equatorial regions. Some of the projections I have seen call for loss of quite a bit of arable land in the US, and considering how much of the world’s food it produces, this has grave implications for global food supply. China has been securing farmland hand over fist in both Africa and South America. I wonder if they are aware of the cycle changes underway. I would be interested in hearing if anyone has re-location plans and what destinations you are considering. My choice is quite simple as I am from the Caribbean and plan to head back to that warm clime!
Typo Aug 26 full moon
I agree Joe! Right on!
Also…I think the dollar is done…! 🙂
We are getting a reaction lower from the Aug 9 date. Ideally this should be a more significant top that few of the previous ones. I had picked up 2800-2840 as the sell zone. Went higher than my expectation, but we should get follow through over the next few days. Treasuries reacting the right way in terms of calendar – gives me confidence to go to my full short size. Thinking of this as a top of wave 3 of an ED OR top of wave B. Either way, the next 5-7% is lower in both counts.
Great “Big Picture” thinking Vivek. It usually leads to smart trade decisions!
I’m in short and fullly loaded long vol!
What a beautiful day. I just LOVE volatility…a veritable EXPLOSION of green everywhere! Let’s go lunatics!! 🙂 🙂 🙂
The banksters obviously went to work towards the close. I think they are going to get steam-rolled…lol!
Kudos to Peter G. That confluence of trendlines he pointed out was significant.
My own line in the sand for confirmation of a serious trend change underway remains SPX 2800.
Whether or not the move down extends to month’s end will have a great impact on my view of the relevance of the lunar cycle. Have a great weekend all!
A new blog post is live at: https://worldcyclesinstitute.com/the-turn-of-the-century/
This website is for educational purposes relating to Elliott Wave, natural cycles, and the Quantum Revolution (Great Awakening). I welcome questions or comments about any of these subjects. Due to a heavy schedule, I may not have the time to answer questions that relate to my area of expertise.
I reserve the right to remove any comment that is deemed negative, is unhelpful, or off-topic. Such comments may be removed.
Want to comment? You need to be logged in to comment. You can register here.