Update Tuesday Morning, Sept 1, 2015: The futures came down overnight and have bounced in a wave 4, so expect to head lower for much of the remainder of the day.
Update Monday night, Aug 31, 2015—The market continues to frustrate. We’ve been at the top of this countertrend wave for days now. Tonight, I’m taking a look at the NYSE, which is usually a bit cleaner is terms of the wave structure.
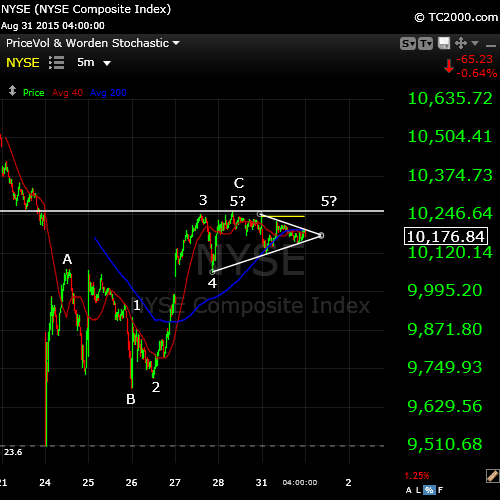
What we have is the flat that I’ve been talking about, a 3-3-5 countertrend wave. The letters denote the 3 wave countertrend move and the numbers mark the 5 waves of the C wave. The C wave could be complete, but it hasn’t started down and we haven’t gone to a double top, which is what I was expecting. Eventually the move will be to the downside into wave 5, but in the meantime, we’re stuck with it finding its way in a very small area. I would prefer to see it test the previous high, which is the ideal place “to get in.” We’ll see what tomorrow brings.
_______________________________
Original post from Sunday, Aug 30: We’re at a tipping point of sorts, as we’re about to drop off a ledge. But the bigger picture “tipping point” is that at the bottom of the next wave, the herd will start to get really nervous. There’s a problem—a really big one—but it’s too late to do anything about it. However, the next wave up (after wave 5) should get everyone back on Hopium again. Wave 5 about to start will be an important wave down.
It should travel down quickly. We’re looking for a target date for the end at anywhere from Sept. 4-9. It will be a rude awakening for Wall Streeters just getting back from vacation. In Canada, we’re in the middle of a national election, so there’ll be some fireworks, for sure!
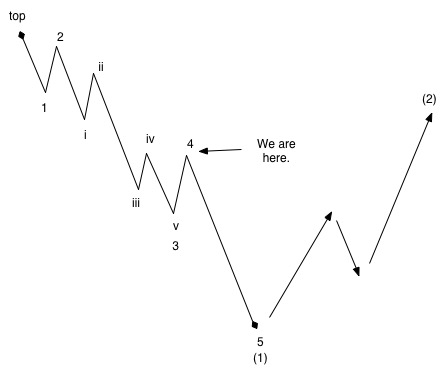
Let’s look at where we are in the big scheme of things. This post will be about positioning for this drop (which, although not shown in the diagram at left, will be in 5 waves).
We’re at the top of the fourth wave (by Monday, we should make that official), with a final fifth wave down to go. The eventual larger degree 2nd wave (2), which I’ve now shown on the chart, should retrace the entire length to about 62% from the top before turning over once more. That’s down the road … October, perhaps.
In the charts below, I’m going to give suggested targets for Wave 5. This wave may end in a capitulation move at the end, so it’s difficult to say for certain how far we’ll go, but the surprise is likely to the downside.
In Elliott Waves, fibonacci ratios are extremely important. The fifth wave generally will be as long as the first set of waves (1,2,3) to this point. I generally draw a fibonacci tool from top to bottom and extrapolate to 1.618 of the distance travelled so far. That’s typically the end of wave 5. On top of that, there are some interesting relationships that have developed to support that level. I’ll explain below.
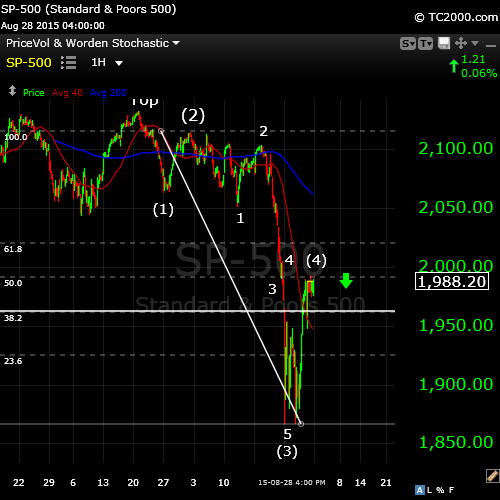
We’ll start with the SP500 (above). We are well above the 38% minimum retracement (horizontal line) which should complete wave 4. We are heading down into wave 5.
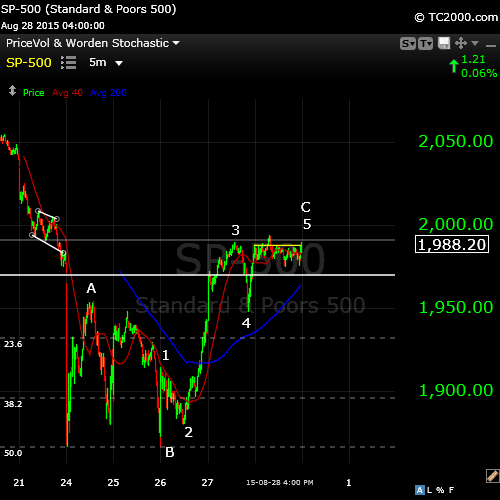
When you drill down to the 5 minute SP500 chart, you can see the frustration of Friday. We have a clear ABC pattern (B was about 8 point shy of a new low) and we have a five wave C wave up, which completes a flat pattern (3-3-5). We’ve completed wave 5 up but we should see a double top. We could go a little higher, but we would need to do a second wave within that small fifth wave in order to move into a 3,4,5 combination up. In other words, I expect us to turn Monday morning.
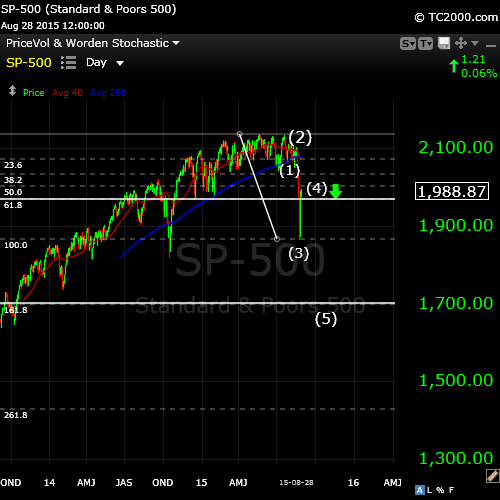
The medium term picture of the SP500 gives us a possible target at about 1700. This is the extrapolation of the 100% move so far to a final length of 1.618 (bottom horizontal line). This would be a typical ending point for the larger degree wave 1 down (of five waves). If wave 5 was to be the same length as wave 3, the stopping point would be about 1738.
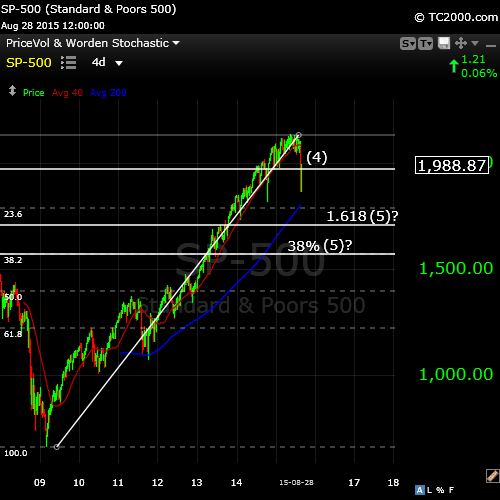
When you look at the bigger picture of the SP500, there’s another suggested stopping point. The 38% retracement of the C wave up is much lower at 1575. So, the SP has a wide range of possible ends, from 1575 to 1700.
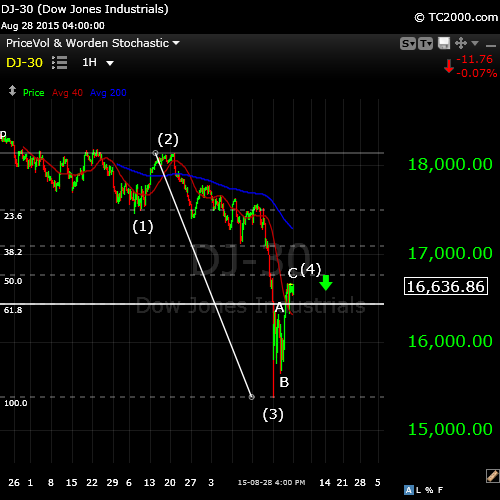
Next, the senior index, the DOW (above). It’s also well above the 38% retracement (horizontal line) and shows a complete set of waves up at this point. I’m showing the ABC 3 wave configuration here, which is a corrective pattern.
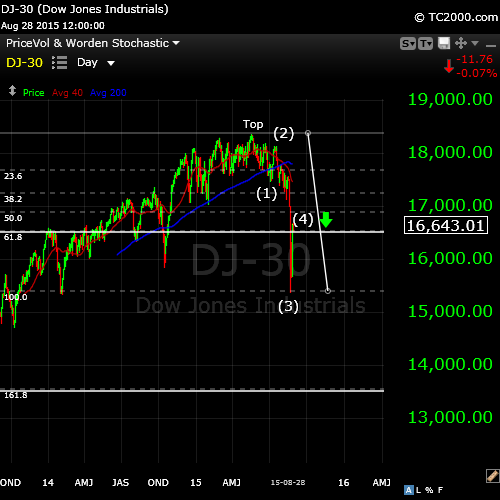
The medium picture of the DOW, when you draw a 1.618 extension, gives us a target of approximately 13,500.
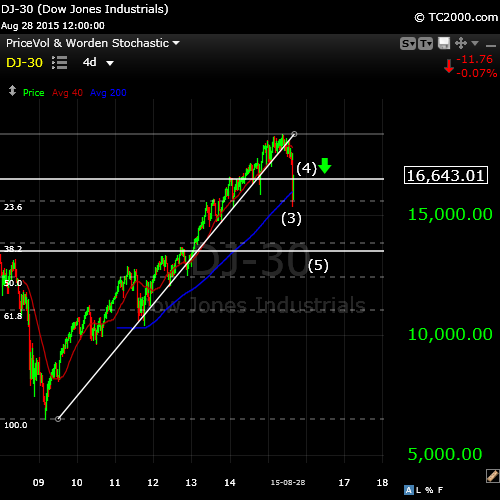
When you look at the bigger picture of the DOW, and target the 38% retracement of the C wave up, the stopping point suggests 13,850, very close to the 1.6 level. But what’s more interesting, is that this would be the same level if waves 3 and 5 were to trace out to exactly the same length. So, the DOW is suggesting a stopping level of 13,500 – 13,850.
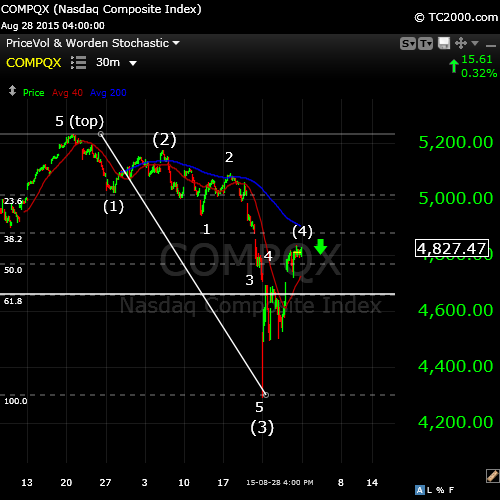
Next, the Nasdaq (above). It sports the same corrective pattern, which is all but complete.
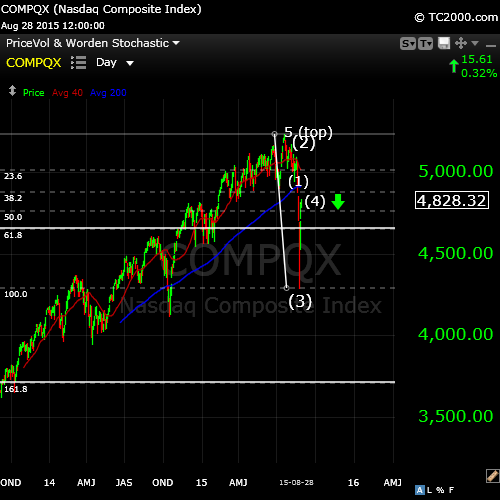
The medium picture of the Nasdaq, when you draw a 1.618 extension, gives us a target of 3715.
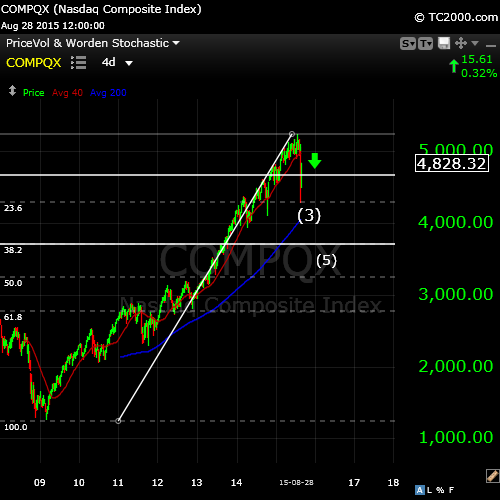
When you look at the bigger picture of the Nasdaq, and look to the 389% retracement level of the Nasdaq, you get exactly the same number as the 1.618 extension: 3715. So, I think the Nasdaq is clear. That’s not to say all of these indices couldn’t extend lower.
I’ll try to give an indication of where we are as the waves trace out. All the subwaves typically have related ratios and this should give a good clue to where we’re going to end.
Below are a couple of REALLY interesting charts from Time-Price Research.
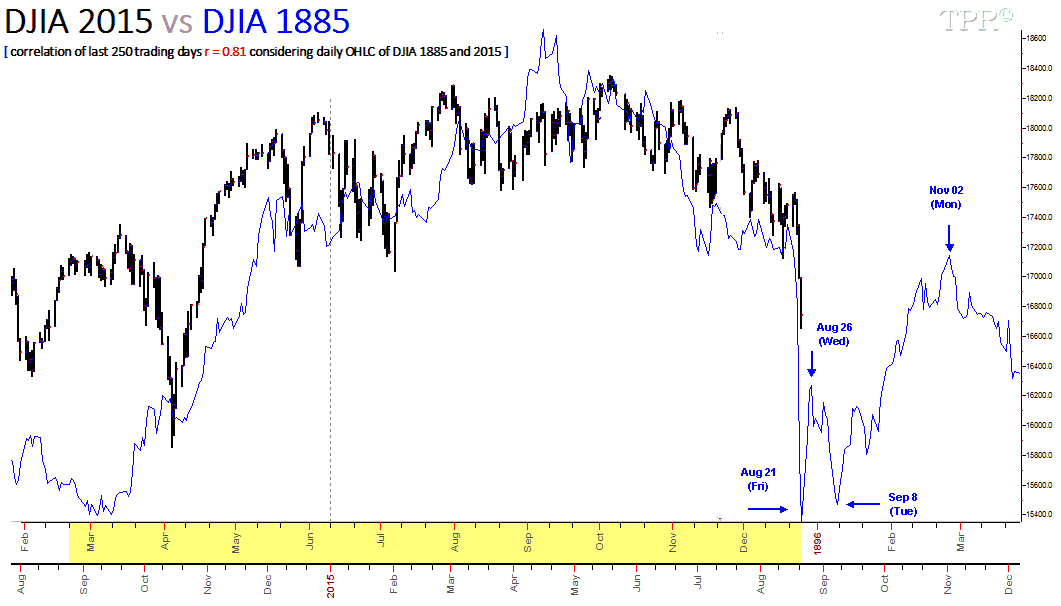
If we go way back to 1885, to another depression (The Depression of 1884), when the weather also turned cold and dry, you can see the first wave drop. The patterns are always very similar. It followed at solar maximum in December, 1883.
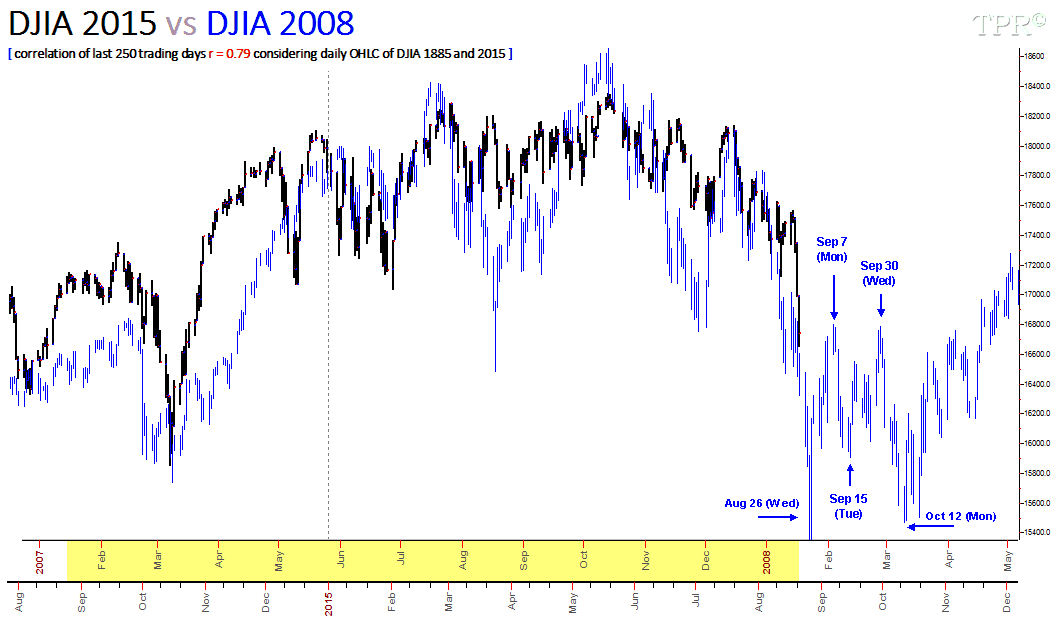
Here’s 2008. Again, a similar pattern.



Hi Peter,
nice picture. I don’t pretend to be a corrector but there are two mistakes:
in the paragraphe starting: “In Elliott Waves, fibonacci ratios are extremely important” should be 1.618 instead of 1.1618;
“The medium picture of the Nasdaq” should be 3715 instead of 1715
Sorry for that.
This is my only contribution to your blog
Sincerely
You’re hired! haha … Thanks!
I just added a couple of historical charts at the bottom.
Clear analysis. Thanks!
Another piece of great work! Thanks Peter. Your counts are so easy to follow, and the current position and historical data give us both the current market view and the longer term view.
Futures are already red, commencing wave 5. I believe cash will follow tomorrow. Hope you are making serious bucks shorting the Dow. 🙂
Thanks, Erick,
Futures are down in 3 waves, so they’ll tag the top in the morning, no doubt.
I missed the third wave as my hard drive crashed while I was out of town. Great timing! However, I’ll get this wave …
Wave 3 came down so fast. I am sure a lot of bears have missed that wave 3 too. You are right, wave 5, if confirmed, shall be destructive, I am fully short, and might not close my short positions until SPX 1700ish as you have predicted. Thanks again.
Very Nice Peter,
If SP500 closes below 1700 before Sept 9 I will send you some Tulip bulbs as a reminder of our crash…
But it has to happen this week,I m sure Mercury Sept 4 will be a big turn..
Cheers
John,
The market may bore us all to death before then.
I am watching the eur/usd, which runs inversely to the US market. It has to come down to a double bottom at about 1.1160 and that should drive the US market up to top this wave off. Eur/usd did 3 waves up so must retrace.
Window dressing today.
No volumes. Only fund menagers trying to save the month
I was thinking the same thing earlier today. Last day of the month.
I too like the way you present Elliott waves. I know ew pretty well, but by the time I am half way through most analysises iam drownding in A A 1i 2 III, m ETC. GREAT WORKMTHANKS.
Thanks, Kent,
Well, I’ve been an educator (really) for a long time (writing/directing/producing video) and a speaker/trainer. My skill is breaking complicated concepts down so they can be explained simply. So, I don’t much pay attention to labelling the minutiae—just the stuff I really care about. Always thinking about making it simple to understand. So, it’s nice to have a comment like this. I know exactly what you mean … haha.
Great post, Peter! Charts are really good. Look forward to seeing how the ES plays out in this possible down wave. Charts appear to be perfect bearish set up given the many years of upward movement, planets imo are short term supportive (Mercury moving to front side of sun, Venus post inferior conjunct); seasonals usually ramp up into middle of September. Lunar negative this week, positive next week. Guess will play cash or short side this week and no shorting next week.
Thanks Valley,
We’re all waiting for this thing to keel over. We had a long second wave and usually the second and fourth need to be close to the same time scale. The windows seems to be tightening, but I expect this wave to come down fast. We’ll see.
A lot of China’s PMI tonight
I saw the interview on zerohedge with Tom de Mark comparing this market action very similar with may 2010.
If that is the case we have topped and we will go down again to the lows end of this week or beginning next week..
The upmove from the lows at that time was 5 days very similar like now and the ( first) down move 6 days…
http://finance.yahoo.com/q/hp?s=%5EGSPC&a=04&b=1&c=2010&d=06&e=31&f=2010&g=d
http://ciovaccocapital.com/wordpress/index.php/stock-market-us/2010-challenges-met-sp-500-1256-now-cleared/
Hi all!
I got back from Barcelona last Friday, had a great time!
@Peter/André, I drank two Estrella Damm beers for Peter because André did not like a beer he told us. 😉
@John, mailadressen uitwisselen om wat te kunnen klankborden met elkaar? Ik zou graag wat meer over jouw manier van het toepassen van Astro (Bradley en die fast cycle of iets???) op de beurs. Uiteraard zal ik je ook laten zien wat ik doe. 😉
I am invested short and waiting for the AEX to make a drop below 400 points (I think 381 will be the target ). So Peter, if you could just tell EW to hurry up with the 5 down, that would be cool!
And Peter, André and John, thanks for all the amazing posts in the meantime. I was happy to read them when I was in my hotelroom in Barcelona to rest some. 🙂
Good luck trading to you all!
Cheers,
W
Wouter,
Good timing! Well, it’s early but I think we might just be on our way …
I updated a message but it did not get through
Tom de Mark had an interview on zerohedge comparing this market with May 2010
Something wich was on my mind to last week.
So I looked it up
From the down move it took 5/6 days recovery just like now?
After that it made a lower low 8 td later so that would be Sept 9 right in the time frame Sept 4-9.
http://ciovaccocapital.com/wordpress/index.php/stock-market-us/2010-challenges-met-sp-500-1256-now-cleared/
http://finance.yahoo.com/q/hp?s=%5EGSPC&a=04&b=1&c=2010&d=06&e=31&f=2010&g=d
Hello Wouter,
Welcome back
You can mail me on markentom@gmail.com
Hi John,
I will send you an e-mail right away! And yeah, let’s hope the low will be 9 September. 😉
Cheers,
W
I just looked at the one week 30 min bar chart of the Dow – looks like a rather clear 1-2 1-2 with 3 underway.
Be careful this morning! I put a short note at the top of this post. The futures came down overnight.
From a discipline trading point of view. A bird in a hand is worth two in the bush. Sold 1/3 at the spx level of 1927 Yes, a little early. Bears and Bulls make money, Pigs lose. Best of luck every one.
Good points! I today also booked profits on 50% of my SPX short positions as well. Waiting for a bounce….
The bounce is over and ended up being a fourth wave. We should head down into the end of the day. I’m not sure of the stopping point of this wave yet, but it should be the first of the fifth. It should at least get to 1900 I think in the SP.
Dollar/yen breaking support shit hits the fan?
Peter is it possible to ad an attachment link to your site that can be very usefull to show things?
I want to stay short till thursday or friday and hope to see a selling climax again..
Good luck…
Apparently there is. I’ll work on it.
Thanks,
I think The sun -jup cycle is very usefull it nailed the bottoms august/okt 2014 perfectly
If you look closer you see the bottom a little bit later so sept 7-9 is also possible.
We’re going to get a bounce here at about 1910 SP, but I’ll bet it syncs with the end of the day. It may bounce overnight.
I am looking for a low on Friday also.
John, I am also looking for this Friday for some kind of a low. From a discipline point of view, I will be selling some shorts along the way. I am hoping for some kind of bounce late today or tomorrow to buy back some shorts. If it does not happen, I will be happy with the shorts I have going into Friday. All the best every one.
Time is more important than price a big lesson for me beeing scared for the bounce on August 24 and sold my puts much to early
So I stick to my shorts let everybody wait for the bounce so we can plunge… al good things come in 3… so thursday or friday…I will stay with the canary in the colemine haha..
This bounce in the SP500 is only going to the previous 4th, at about 1943.
USD is looking like it is ready to rollover. The weekly chart looks tragic. Not sure how this would effect gold. Gold technically should soar. However, I think gold might get sold off hard as well with the rest of the market during the final subwave of a larger wave 5 imv.
I agree with you Erick. I believe we will see gold below $ 1000.00 over the next several weeks.
The Bear rules…
http://www.cnbc.com/2015/09/01/heres-why-it-can-get-much-worse-technician.html
John, any thing from cnbc I use as a contrairn play. I bought some longs towards the end of the day SPX 1907 to hedge my shorts. Will sell them out after a VERY BRIEF bounce into tomorrow.
Roger that Dave.
John Canally came out saying the selloff is just a normal correction, not a bear market. The odds of a recession over the next 12 to 18 months in the US are very low…etc. imho it is time to be contrarian.
They’re all taking Hopium. It will work for a while, but leaves a really bad hangover.
Peter, put in a Wednesday morning update , please even if it is 2 sentences.
Where is Andre? Missed his post…Nick
Nick,
Well, since it’s you … OK. We’re going down to finish the second part of this first wave. In fact, we may start tonight. I’ll put up a chart tonight.
André added some info in the previous post comments. You’ll find them there. Not much has changed.
Here you go, buddy … 🙂
https://worldcyclesinstitute.com/a-little-drop-of-rain/