 The Uphill Battle Continues in SPX
For three weeks, we’ve watched the D wave of the contracting triangle in ES and SPX try to top. We’re very close to turn and Monday might just be the day. Good riddance to this wave!
With almost every up and down move in the past three weeks in ES, alternate measurements keep targeting the 2750 area. This has been the ultimate target right from the start. This action tells me we have an extremely weak market that is struggling to get to the target.
As a result, once we see the turn down into the E wave of the triangle in ES/SPX, the drop is likely to be sharp. However, the E wave has to be in three waves, so we’ll trace out an ABC wave to below 2600.
US Index Review

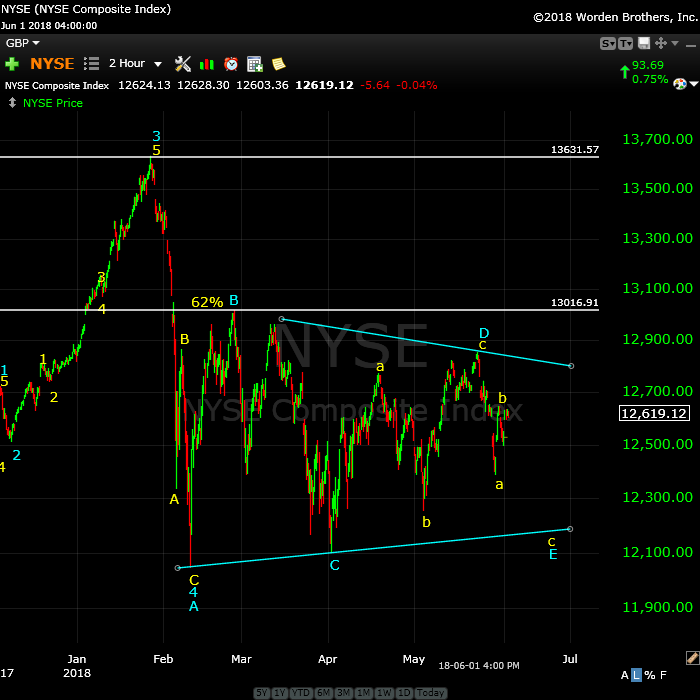
Above is the two hour chart of the NYSE. This is the mother of all indices, and if you have any doubts about where we are, just take a look here. It doesn’t have the typical “animal spirits” attached to it (as it’s not traded directly) and comprises all the other traded indices (SP500, DOW, RUT, RUA, etc.).
We’re in a fourth wave contracting triangle, currently in the E wave, with one more leg down to go (a ‘c’ wave). The SP500 is at the top of the D wave, attempting to reach it’s target, but the weakness has kept it from achieving its goal. When it does, expect it to drop sharply into its E wave down.

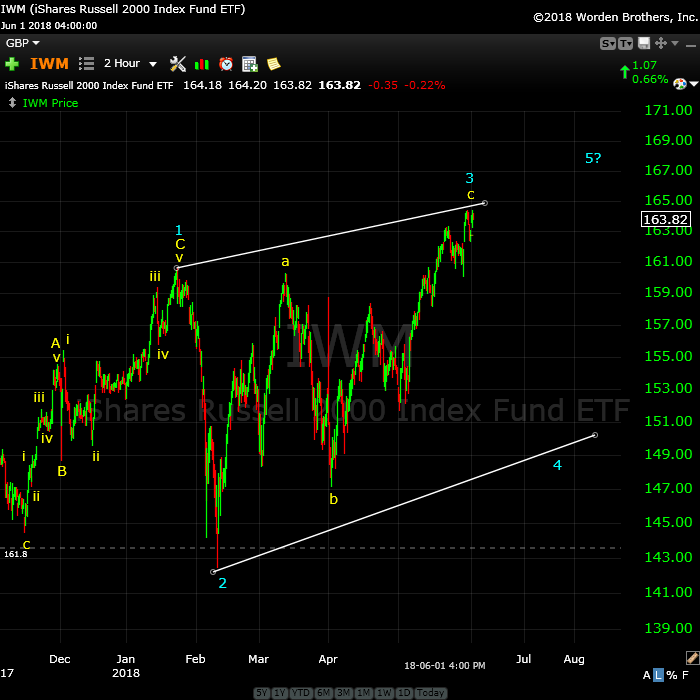
Above is the two hour chart of the Russell 2000 (RUT), showing the ending diagonal in play. In the Elliott Wave Principle (Frost & Prechter), the lump ending diagonals into the motive wave section of the book, but it’s really a corrective pattern.
The pattern has overlapping waves; it’s too weak to rally in a clean third wave. The waves are really collapsing on each other, due to the inherent weakness. You’ll find that pattern at the ends of trends, either corrective, or motive.
The ending diagonal will have a large fourth wave down to the lower trendline and then and final fifth wave up to a new high and I would expect a throw-over (a 5th wave that extends slightly beyong the upper trendline. When it does so, it will mark the end of the five hundred year trend that I’ve written about extensively here.
_______________________
The Ultimate Crescendo
Almost two years ago now, I posted a video illustrating the fact the all the major asset classes were beginning to move closer and closer together in a sort of parade to the top. It’s exactly what’s happened, but we’re not quite complete yet, of course.
While the US indices head down from the top of the D wave, I don’t expect a lot of movement in the USD currency pairs. They’re finishing up a corrective move down and are more or less waiting to bottom with the E leg of the contracting triangle in the US indices. The should enter the 5th and final wave up together.
What I see is everything moving (or sitting, waiting) to get into position for the final wave up — the 5th wave in the US indices that will rally from the bottom of the E leg of the triangle up to a new high. It has quite a distance to go.
While that final 5th wave in the US indices rallies, we should see rallies in EUR, GBP, AUD, and CAD (CAD will move in the opposite direction). Oil will likely also rally in what looks like an ending diagonal pattern playing out. Gold and silver should drop to their targets while the 5th wave plays out.
As I’ve been saying for the past couple of years, everything will top at the same time, but to do so, they all have to finish their final waves within Elliott wave rules.
After they all top, they will all move down together in what’s going to be the show of a lifetime. The drop in the eventual third wave (likely this fall) will be labelled “the crash” and it’s likely to be breathtaking in it severity.
But, they all have to reach their long term targets together.
Elliott Wave Basics
There are two types of Elliott wave patterns:
- Motive (or impulsive waves) which are “trend” waves.
- Corrective waves, which are “counter trend” waves.
Motive waves contain five distinct waves that move the market forward in a trend. Counter trend waves are in 3 waves and simply correct the trend. These patterns move at what we call multiple degrees of trend (they are fractal, meaning there are smaller series of waves that move in the same patterns within the larger patterns). The keys to analyzing Elliott waves is being able to recognize the patterns and the degree of trend that you’re working within.
The motive waves shown above are typical in terms of their look and length. Subwaves of motive waves measure out to specific lengths (fibonacci ratios) very accurately. Motive waves are the easiest waves to trade.
Waves 1, 3, and 5 of a motive wave pattern each contain 5 motive subwaves. Waves 2 and 4 are countertrend waves and move in 3 waves.
Motive waves also travel in channels. The red channel above can be drawn from the apexes of wave 1 and 3 on one side and waves 2 and 4 of the other. The end of wave 5 typically meets the trend line on the wave 1 & 3 side before it reverses.
Countertrend waves move in 3 waves and always retrace. You’ll find much more about them in the countertrend section and the page on “The Right Look.”
To use Elliott wave analysis accurately, you must be able to recognize the difference between a trend wave (motive) and a countertrend wave (corrective). There’s very much more to proper Elliott wave analysis, but this gives you the basics.
____________________________
Registration for Commenting
Want to comment? You need to be logged in to comment. You can register here.
If you register, it protects your information. It also allows you to comment without filling in your information each time. Once you’re registered, simply go to the home page and click on the login link top right in order to log yourself in. Usually, you’ll be logged in for several days before needing to be logged in again.
______________________________
Problem receiving blog comment emails? Try whitelisting the address. More info.
______________________________
The Market This Week
Here's the latest daily chart of ES (emini futures)

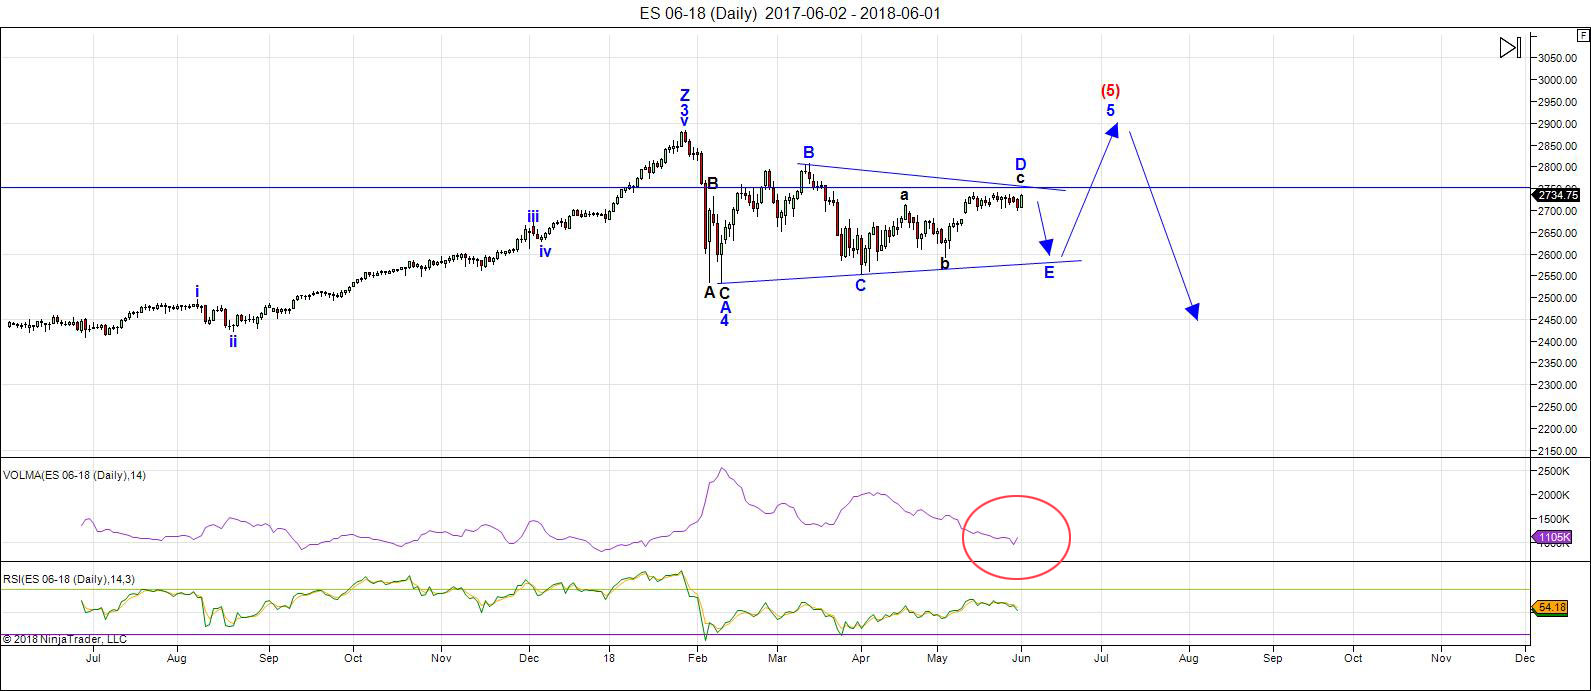
Above is the daily chart of ES (click to enlarge, as with any of my charts).
We've now being going sideways at the top of the D leg of the triangle for three solid weeks. This signals to me that the market is exceptionally weak and having a tough time making it to the required target. I'm expecting one more wave up to complete the D leg. We're either targeting the previous high (2742) or 2750. There's a possibility we could reach as high as 2760.
Volume is exceptionally low (I've drawn a red circle in the volume indicator), which contributes to the volatility and lack of momentum at times.
Once we hit the target, though, we'll head down in the E leg. I thought the turn had to happen last week, because of the inherent weakness and the length of time going sideways. This market is extraordinary!
After the E wave down is complete, we'll take off again to the upside in a fifth wave, which will simply finish off the pattern. We'll get to a new high and probably more, but don't expect (as I've been saying for a very long time) a large fifth wave that travels any great distance. (I think 3000 is possible but at the high end of the probability spectrum)
Summary: We're not quite finished the D leg of the contracting triangle. Topping out will result in a high probability trade to the downside (the E leg of the triangle) Once E leg (down) is complete, expect a final fifth wave to a new high. That fifth wave up to a new high will be the end of the 500 year bull market.
___________________________
Trader's Gold Subscribers get a comprehensive view of the market, including hourly (and even smaller timeframes, when appropriate) on a daily basis. They also receive updates through the comments area. I provide only the daily timeframe for the free blog, as a "snapshot" of where the market currently trades and the next move on a weekly basis.
______________________________________
Sign up for: The Chart Show
Next Date: Wednesday, June 13 at 5:00 pm EST (US market time)

The Chart Show is a one hour webinar in which Peter Temple provides the Elliott Wave analysis in real time for the US market, gold, silver, oil, major USD currency pairs, and more. You won't find a more accurate or comprehensive market prediction anywhere for this price.
Get caught up on the market from an Elliott Wave perspective. You’ll also get Andy Pancholi cycle turn dates for the SP500 for the balance of the current month. There’ll be a Q&A session during and at the end of the webinar and the possibility (depending on time) of taking requests.
All registrants will receive the video playback of the webinar, so even if you miss it, you’ll be sent the full video replay within about an hour of its conclusion. For more information and to sign up, click here.


A new weekend free post is live at: https://worldcyclesinstitute.com/from-the-crowsnest/
This website is for educational purposes relating to Elliott Wave, natural cycles, and the Quantum Revolution (Great Awakening). I welcome questions or comments about any of these subjects. Due to a heavy schedule, I may not have the time to answer questions that relate to my area of expertise.
I reserve the right to remove any comment that is deemed negative, is unhelpful, or off-topic. Such comments may be removed.
Want to comment? You need to be logged in to comment. You can register here.