
The US Dollar: Key to the Market
 The US Dollar is the reserve currency and just about everything (inside and outside the stock market) is priced based upon its current value. Almost all asset classes have a relationship with the dollar. Gold and oil are priced in US dollars. The currency of virtually every country in the world is priced based upon its relative value to the US dollar.
For over two years now, I have said, “Watch the dollar. Because when it reaches the bottom of its correction, that will be the top of the US equity market.”
I’ve also talked incessantly about “all the same market.” For the first time I know of, all asset classes are moving in tandem. It seems they are all going to turn at a top together. Even US treasury bonds are completely a trend and turning.
We have a turn starting to take shape to the downside in the US Dollar. That’s the second to last turn (the penultimate turn) before a US market top. The turn at the bottom (below $23.00 on UUP, or 11,500 on the US Dollar chart, or $88.00 on the Dollar Index) will be the top of the US equities market.

Above is a 7 day chart of UUP, the recognized US Dollar ETF that parallels the movement of the dollar. The patterns are virtually the same.
The chart shows five impulsive waves up, with a second wave arguably in place once we get a test of the low. That’s the bigger picture. The larger trend is up.
Let’s look at the shorter term. In the above chart, we have an A wave down to about $23.00 from the high just under $27.00 and a B wave up to ~$25.00. We now need a C wave down to test the previous low around $23.00. The horizontal line on the chart at 23.14 is at the 62% retracement level and makes the current corrective wave a second wave.
This is predictive of a large third wave that will travel well above the $27.00 level. If the US Dollar rises, it’s deflationary. When goes up in value, it means it’s scarce (there’s no enough money in the economy to satisfy demand). In other words, credit is drying up; debt is beginning to disappear. Under our current international banking system, debt that is repaid simply disappears. For an explanation of how banks work, you can read my blog post on it here.
As I’ve been saying for several years now, we’re heading into a deflationary spiral. If you’re on the right side of the market and understand what this means to the value of money (and take advantage of it), you’re going to be just fine.
Now that my technical issues have calmed down somewhat, I’m putting the final touches on a new version of my webinar, “Navigating the Crash,” along with a second webinar, entitled, “The New Rules of Investing in an Uncertain Economy.” More info to come this week on both of these.
In the meantime, US indices are in ending diagonals — SP500, ES NDX, NQ, Nasdaq Comp, Russell 2000, and Russell 3000.
Ending diagonals are ending waves. I consider them corrective. In a fourth wave position, which we’re in, they foreshadow an imminent trend change. That’s a hard rule that will NOT be broken.
Right across the board, it’s clear: We’re in the final stages of this 500 year bull market. The US Dollar, as I’ve been saying for over two years now, will be the key to timing the top of the US market, and other markets around the world. The US Dollar is ultimately going to increase in value. That’s deflationary. So is contracting credit, which we’re seeing worldwide.
After all these markets top (or bottom, as the case may be), they will all move down together in what’s going to be the show of a lifetime. The drop in the eventual third wave (likely this fall) will be labelled “the crash” and it’s likely to be breathtaking in it severity.
_______________________
Elliott Wave Basics
There are two types of Elliott wave patterns:
- Motive (or impulsive waves) which are “trend” waves.
- Corrective waves, which are “counter trend” waves.
Motive waves contain five distinct waves that move the market forward in a trend. Counter trend waves are in 3 waves and simply correct the trend. These patterns move at what we call multiple degrees of trend (they are fractal, meaning there are smaller series of waves that move in the same patterns within the larger patterns). The keys to analyzing Elliott waves is being able to recognize the patterns and the degree of trend that you’re working within.
The motive waves shown above are typical in terms of their look and length. Subwaves of motive waves measure out to specific lengths (fibonacci ratios) very accurately. Motive waves are the easiest waves to trade.
Waves 1, 3, and 5 of a motive wave pattern each contain 5 motive subwaves. Waves 2 and 4 are countertrend waves and move in 3 waves.
Motive waves also travel in channels. The red channel above can be drawn from the apexes of wave 1 and 3 on one side and waves 2 and 4 of the other. The end of wave 5 typically meets the trend line on the wave 1 & 3 side before it reverses.
Countertrend waves move in 3 waves and always retrace. You’ll find much more about them in the countertrend section and the page on “The Right Look.”
To use Elliott wave analysis accurately, you must be able to recognize the difference between a trend wave (motive) and a countertrend wave (corrective). There’s very much more to proper Elliott wave analysis, but this gives you the basics.
____________________________
Registration for Commenting
Want to comment? You need to be logged in to comment. You can register here.
If you register, it protects your information. It also allows you to comment without filling in your information each time. Once you’re registered, simply go to the home page and click on the login link top right in order to log yourself in. Usually, you’ll be logged in for several days before needing to be logged in again.
______________________________
Problem receiving blog comment emails? Try whitelisting the address. More info.
______________________________
The best of them JL 2
The best of them …Last couple of years, I subscribed to several ‘market traders’. You are by far the best of them and the personal contact is awesome. Daily and daily updates are very well written! Besides your expertise in EW, I also like your cycles analysis. Best investment I ever made! —JL |
Have not had a losing week RW 2
Have not had a losing week …I have been with Peter almost a year. The only thing that matters is have I made money with his service. I think I have finally turned the corner using Peter’s EW. I have not had a losing week in the last 5 months. Thanks Peter, for your amazing amount of hard work. —RW |
Tops in your field DZ 2
Tops in your field …You are tops in your field. Tried to follow Elliot Wave international for years. They were always behind the market. After discovering you, I perceive that you are an expert in reading the waves, which puts you way ahead of the rest of your peers. And you can read the Waves like you are reading tomorrow’s financial section. I pray you stay healthy. —DZ |
Couldn’t be happier … KK 2
Couldn’t be happier …The analysis and insight you provide is simply amazing! I’ve been trading the futures and equity markets for well over thirty years and usually average around 5% monthly. Since joining your Traders Gold Service two months ago, that number has better than doubled. I couldn’t be happier.—KK |
A true expert in Elliott Wave FL 2
A true expert in Elliott Wave …You are a true expert in EW analysis. What you provide is not available anywhere and is priceless. Subscription on your services is the best thing I have ever done. Many thanks for your effort to make me a better investor. I now have more trust in my investment decisions. I hope you will continue the excellent work! —FL |
Rise above the rest … SM 2
Rise above the rest …I have only ever met a few people who, in their chosen fields (astrology, medicine, music, martial arts, technical analysis), rise above all the rest and you are one of them…you have ‘the gift’…and that’s why I’m a Trader’s Gold member. —SM |
Get an upper hand … JC 2
Get an upper hand in trading …Seeing all the different currency pairs and the wave structures and hearing you explain why this has to do that on a nightly bases gives one a upper hand when trading. Elliott Wave applies to all stock and indices and can be applied to any candlestick chart. If someone ask what you want for Christmas – Tell them a membership to Peter’s “Traders Gold!”—JC |
the real deal SM 2
The real deal …‘Educational, insightful and thorough market analysis for all levels of traders. It’s Elliott Wave at its best….Peter Temple is the real deal’ —SM |
The Market This Week
Here's the latest daily chart of ES (emini futures)
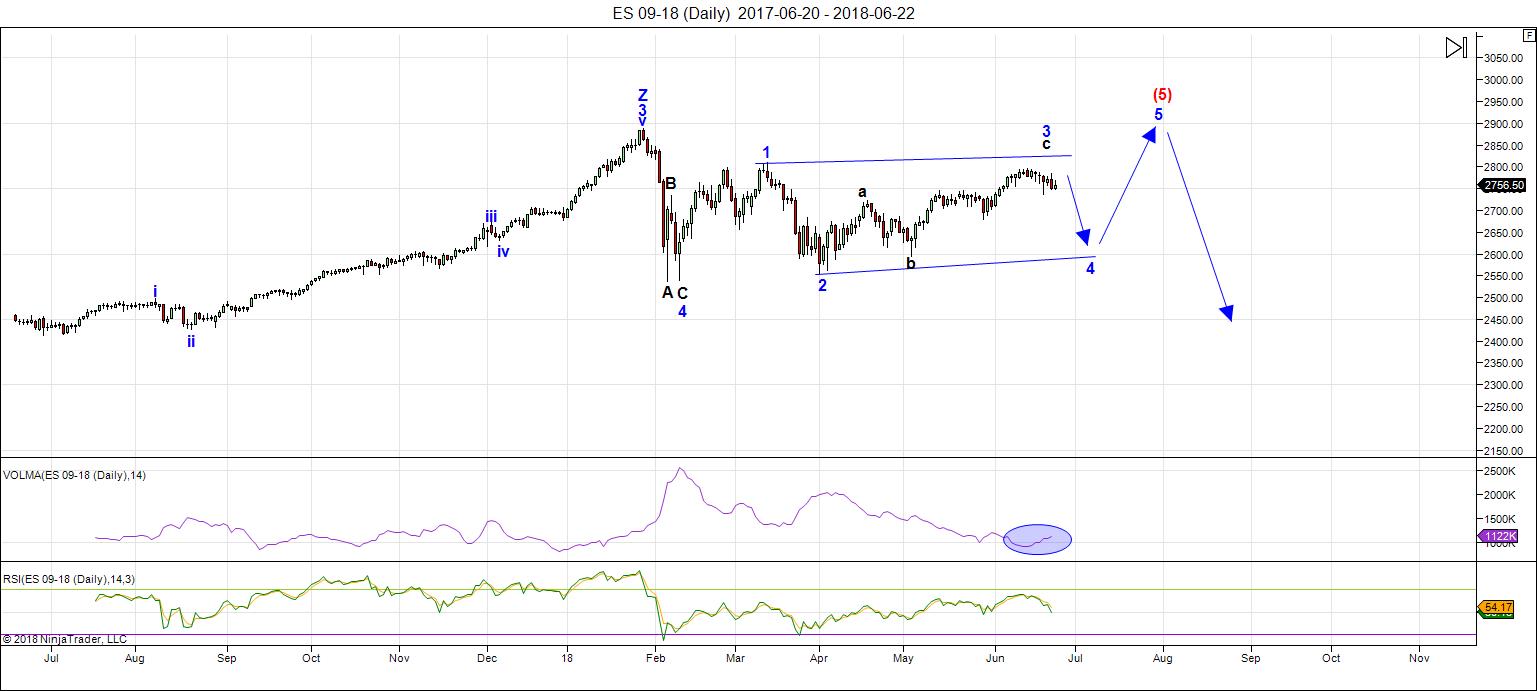
Above is the daily chart of ES (click to enlarge, as with any of my charts).
We wait, ready to pounce. The third wave of the ending diagonal is not yet complete. It's been a bit of a cat and mouse game. However, the mouse is really weak has been careful about showing itself. Starting this weekend, however, it may be on the move up to the target.
Friday's market hardly moved except for the last half hour or so of the day. It seems it was all about a turn ... perhaps right across several asset classes. In the last half hour, ES gave us the signal it was going to start heading up in the final leg. However, we may see a little more downside before that move up happens.
The subwaves are getting difficult to read. From Monday through Wednesday, we traced out an A wave in ES that simply looks corrective. Thursday, we traced out a deep B wave down and Thursday night, we completed a small 5 waver up. Friday late in the day, we completed the turn to the downside. Are we done with down? I don't know, but we should know my Monday morning.
The early part of this coming week should see the final move up in the third wave of the ending diagonal.
The target is still above about 2803 or so and will lead to a strong 4th wave down, which I've been saying for weeks now. This third wave has been one for the history books, and not in a good way. It's been frustrating to say the least.
ES is extremely weak. The SPX/ES/SPY is the laggard, as the other US indices, for the most part, have hit their targets on the upside. This week should finally see the resolution, based on what I'm seeing this weekend.
Timing? Watch this date: July 27 — A nasty "Buck" Full Moon, with a total lunar eclipse
Mercury, Mars, Saturn, Neptune, and Pluto in retrograde
Summary: We continue to trace out the third wave of an ending diagonal. We're waiting for the third wave to top. Topping out will result in a high probability trade to the downside (the fourth wave of the ending diagonal). Once the 4th wave (down) is complete, expect a final fifth wave to a new high. That fifth wave up to a new high will be the end of the 500 year bull market.
___________________________
Trader's Gold Subscribers get a comprehensive view of the market, including hourly (and even smaller timeframes, when appropriate) on a daily basis. They also receive updates through the comments area. I provide only the daily timeframe for the free blog, as a "snapshot" of where the market currently trades and the next move on a weekly basis.
______________________________________
Sign up for: The Chart Show
Next Date: Wednesday, June 27 at 5:00 pm EST (US market time)

The Chart Show is a one hour webinar in which Peter Temple provides the Elliott Wave analysis in real time for the US market, gold, silver, oil, major USD currency pairs, and more. You won't find a more accurate or comprehensive market prediction anywhere for this price.
Get caught up on the market from an Elliott Wave perspective. You’ll also get Andy Pancholi cycle turn dates for the SP500 for the balance of the current month. There’ll be a Q&A session during and at the end of the webinar and the possibility (depending on time) of taking requests.
All registrants will receive the video playback of the webinar, so even if you miss it, you’ll be sent the full video replay within about an hour of its conclusion. For more information and to sign up, click here.


Thanks Peter.
The dollar argument vis a vis the equities market is a bit confusing as you have presented it. If the dollar is indeed in an impulsive wave up, and I agree with that count, a new low, which would presumably signal a market top, would clearly invalidate an impulsive count.
I guess I don’t quite ubderstand, based on your Dollar thesis, why you expect a market top at the start of the Dollar’s third wave up after a corrective second wave, as opposed to having topped at the low preceeding the first impulsive wave up.
What am I missing? (Won’t be the first time). 😛
OK. I just realized was looking at a multi- year chart of the Dollar. Got it.
I re-read it, removed a line that was redundant and cleaned up the copy a bit. Sorry. Yeah, it was a bit confusing as written. Thanks for the head’s up.
Most welcome. Thanks!
Raymond merriman
We may see behaviors start to shift by (or shortly after) the full moon in Capricorn at the end of this week, June 27-29. That full moon is also conjunct Saturn (Sun/Saturn opposition), just a day after Mars turns retrograde. We already see a heavy Venus grand square in force, combined with a strong Neptune, stationary. To that, the cosmos will now add a heavy Saturn/Capricorn influence with a powerful Mars stationary. This brings to mind the pressure cooker reaching an extreme boiling point. Then this offensive dynamic gradually recedes, as the Moon begins to wane over the following two weeks, and Jupiter starts to assert his dominance. The mood probably becomes lighter, although there is a possibility that everything becomes even more exaggerated, and morphs into hysteria. I am thinking that we may get a break, and conscientious acts of kindness and efforts exhibiting goodwill may become noticeable.
How will this affect financial markets? Well, any market making cycle lows into this period (June 20-27) is susceptible to bottoming and beginning rallies. This is not a time to panic. Let others do that if they so choose. This can be a favorable time to look for opportunities, new trends, which could continue into the Jupiter/Neptune and Saturn/Uranus trines of mid- to late August. The only wild card in the deck is Mars square Uranus, which lasts until mid-September and can still correspond with unexpected events and announcements that drive the markets (and investors) crazy, especially around August 1 +/- one week.
https://mmacycles.com/index.php?route=blog/article&category_id=1&article_id=203
Interesting and thought-provoking posts Joe Thanks. From an EW viewpoint,futures putting some pressure on the idea of a third wave ED zig zag. It already no longer has a three wave look and a move lower will exacerbate the disproportion.For the ED the third wave has to move above the wave one high and we really should see turn today if that pattern is going to play out.
This decline is now really starting to look like a new downtrend which would imply completion oc the previous wave. Commer ials covered half their E mini shorts so I expected upward movement today. So far it looks like that might not hppen. I held my long vol positions and glad I did. The coming full moon could indeed bring a vol spike and i.terim market bottom.
My Astro work is pointing for a low on Tues/wednesday this week.
Closed SPY puts. I think /ES May 29 lows will hold.
Tremendous technical damage being done to equities markets by today’s decline. The numerous overhead open gaps, and demolition of several S/R pivots is quite ominous imho.
The last wave up is clearly history but I am not at all sure how to count the present decline.
Back to the Chart Show on Wednesday for the updated skinny.. I am sure Peter is already hard at work following the action. 😊
Triangles! Hate ’em. And yes, I am. It looks like we have a triangle in ES after all, rather than an ending diagonal, while the other indices have ending diagonals. Mixed bag.
This is becoming interesting .
The up coming full moon as well as the july 2 date.
im following 2 separate cycles they blend but they do not match.
my gut says keep bearish yet expect a reprieve .
new moon high to new moon low is my key for the set up .
yet what if we get a repeat of sorts ??? july 13 should be a key to this
not saying i want a july 13 high yet fits as an extension .
july 27-mid august can be all over the place .
confused and rambling .
I was thinking the same thing with E down underway. If correct, a sharp reversal is just ahead.
For the triangle idea, we probably are completing just the A wave of the zig zag so a temporary bounce just ahead. The C wave down should sharp, short, and sweet! Full moon bottom may be on tap.
The NQ ED is looking good. The third wave still looks to be shorter pointswise than wave one, and now wave four needs to similarly remain within the points distance traveled by wave two as well as travel into wave one territory. Then of course wave five has to remain within the points range of the third wave.
Holy Moley! What an AWESOME potential set-up for the short trade of a trading lifetime!
Thoughts welcome! 😀
I am looking with great interest now at the A/C potential trendline for SPX.
A sharp bounce in that area will in my opinion be the triggrer for deployment of the mother of all bull put spreads!!!
That level looks to be around 2625…..
https://www.youtube.com/watch?v=1yi4E7PNeFw
$UTIL
Just something to look at it.
Joe,
Seeking clarification, if there is any to have with this market. From your new moon high on June 13th you were looking for a new moon low on July 13th. However, an almost parallel cycle is influencing things to the point that July 13th could also be a “new moon high”, is that interpretation accurate?
If so, what does that mean for your bearish view and the “new moon August 11th” date? Don’ feel compelled to offer up an opinion…I am confused with a bearish bias. Just seeking a little clarity.
Bradley model turn date June 9 which was a saturday .
Closing high June 11 which was the monday following.
updated as of yesterdays close.
https://imgur.com/7aIitNq
Caution is warranted. JPM broke its Feb. 5 low and trading below 200sma.
I have the ES 15 minute bumping up against a downward trend line at 12:30 (EDT), and see a 7/13/18 low based on a Mars/Uranus cycle. Shorting here with tight stop.
Looks like the banksters decided to run a few stops of short trades entered at the resistance line. Typical! 🙂
Joe,
Thank you for the updated “cycles” chart from earlier today!
https://bradleysiderograph.com/2018-turn-dates-sp500/#prettyPhoto/4/
https://bradleysiderograph.com/2018-turn-dates-sp500/
It is truly remarkable how many analysts are counting an impulse up off yesterday’s lows…
What am I missing? 🙂
Well, you could count is as an impulse wave if you ignore the subwaves (many of which are overlapping), the fact that it doesn’t measure properly, and has an extra set of five waves at the top (which might be OK if you had a valid second wave after the first five waves … but you don’t).
Just minor stuff like that.
Or if you’re blind.
Yes indeed! If there is anything I have learned from attending the Chart Show is what is a corrective wave and what is not! 🙂
Longer term perspective and not becoming to extreme with the
bearishness.
Why i think the low 23000’s are coming .
Key price cash dow:–24266.97 – Above a bullish view -Below a bearish bias
to much lower prices
https://imgur.com/x7L8yPl
So far so good. The indicators give a High on Friday so up we go from here. http://www.prognoseus500.nl/
Looks to me like a 3,3,5 correction off Monday’s lows. A move higher into Friday would result in a VERY large C wave imho….
I think the markets are at an inflection point.
What I saw in the futures markets this morning strikes me as sheer panic on the part of central banks. Does anyone think this kind of price action is in any way remotely normal?
Next bus stop Juli 3….
Ed
The set up I watch for is simple . A new moon high
Which is roughly 1 month prior to the solar eclipse .
Hence new moon high to new moon low .
I have issues with it because I also see a mars Uranus cycle low
On July 2.
To add to this look at the late January high and the Feb low .
A little different way it played out yet it was a lunar eclipse
High of sorts to the solar eclipse low , the solar eclipse
Was around Feb 15 and the market bottomed Feb 9 ?
The July 13 solar eclipse should ideally be a low of sorts
Indicator wise the market is mildly oversold .
The July 27 to mid August to as late as Sept 8-9 is the time
Period I am most interested in .
What is concerning me right now today is we will have
2 solar eclipses ( the set up above requires a new moon high to a
New moon solar eclipse low ) so which is it ?
As for targeting the end of the cycle you go out 6 weeks
Past the solar eclipse to the full moon surrounding that time count .
July 13 plus 6 weeks as well as Aug 11 plus 6 weeks .
I have not put every variable together
Joe
Seems to me like folk calling for bullish price action may want to revisit that prediction.
This morning’s ramp had all the classic earmarks of a C wave. If you allow those to pull you in you are going to loose money.
Looking foward to the Chart Show to get the inside scoop.
I am not always successful in using EW to plan trades but there is at least a logical basis for its predictions, and always a number that says I am wrong.
Joe,
“I have issues with it because I also see a mars Uranus cycle low
On July 2.”
FWIW, I see a M/U low on July 13 (per Cowan) which fits nicely into your new moon high to solar eclipse low theory.
we made a Low on 2695 and on 2695,25. perhaps the lowest LOW is done. Then the indicators are giving a high tomorrow and i Think close till the end of US trading.
for the mid term it looks like a high around 11-13 july
Be carefull Willem
I think counter trend bounce is done.
1. Failure to hold contested 2720 pivot.
2. Long upper wick, almost shooting star candles.
3. Closure of morning gap up on high volume
4. Negtive divergences at morning highs.
5. RUT prints red on give-back of morning’s gains, and then some.
I expected as much and shorted the pop.
Have a great weekend everyone!
Just wanted to say thanks again to Joe and other astro guys who give REASONS for their projections. It is very difficult, if not impossible, to learn anything from, or even take seriously, posters who throw out assertions without any kind of support for what they are saying. Why bother? No offence.
Their indicators might be proprietary. I check if it aligns with Peter T’s, Joe’s & my own projections/hypothesis and the usual indicators. You can’t learn from them but it’s a nice confirmation if it’s in synch with yours.
A new free blog post is live at: https://worldcyclesinstitute.com/the-technical-ew-advantage/
I am a new poster here, but Verne, get over yourself! i find your reactions to certain posters whom you deem not to your liking haughty and unnecessary. We are muzzled enough in this world, not to be pettily and petulantly critiqued from within. I say post away comrades! There is no marginal cost apart from a mouse-flick.
Besides, I don’t know anyone who consistently makes money in any market to fully reveal their reasons involving proprietary trading strategies.
https://worldcyclesinstitute.com/elliott-wave-the-long-term-corrective-scenario/#comment-18689
Good point Liz. Thanks!
This website is for educational purposes relating to Elliott Wave, natural cycles, and the Quantum Revolution (Great Awakening). I welcome questions or comments about any of these subjects. Due to a heavy schedule, I may not have the time to answer questions that relate to my area of expertise.
I reserve the right to remove any comment that is deemed negative, is unhelpful, or off-topic. Such comments may be removed.
Want to comment? You need to be logged in to comment. You can register here.