Update: 12:30PM EST, Sept 9, 2105
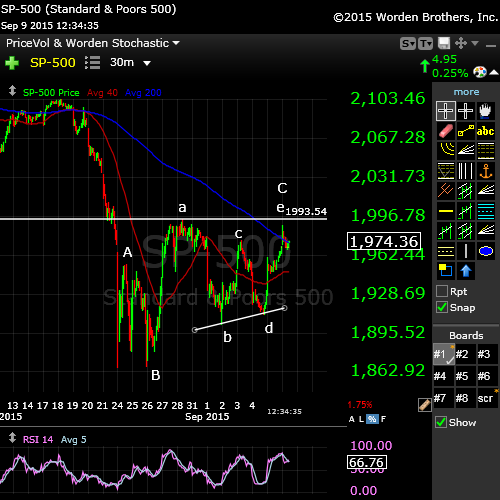
Above is the SP500 as at the time and date at the top of the post. The C wave has extended and we’re expecting a flat. There are 11 different patterns that a fourth wave can trace out (the main reason I stay away from trading this wave) and the flat is the most common. It’s 3-3-5 wave combination and typically does a double top at the previous high, which in this case would be 1993.48 in the SP500. Timing for the turn is most likely tomorrow (Thursday morning).
Original Post (Sat, Sept 5): We’re very close to the end of our first set of five waves down. Technically, in Elliott Wave, completing a full set of 5 waves signifies a change in trend, in this case, to down. This post is intended to take you through to the end of what is a very clear pattern. I will likely do another post mid next week, once we get to the bottom.
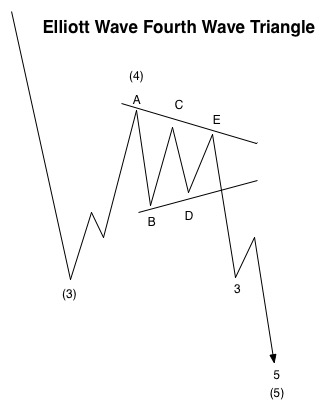
I’ve tightened up my diagram (on the left) to concentrate only on the fourth and five wave combination as we unwind this rather traditional Elliott Wave pattern.
A triangle is a continuation pattern and is labelled ABCDE. In other words, if the trend is down, the triangle isn’t going to change the direction. The trend will continue in the same direction upon exit.
Triangles are 3-3-3-3-3 wave combinations. Each wave within it must be in 3 waves. I’m providing a chart below zoomed in (SP500) to show what technical analysts look for in order to determine whether the waves are motive or corrective. Waves in 3 are always corrective. Motive waves, however, are trending waves but must adhere to a strict set of rules in order to qualify. If they break even one of these rules, they must be labeled as corrective and will retrace.
After the fourth wave triangle is complete (I’m expecting this to happen over this weekend), we’ll have a final fifth wave down. Here’s an excerpt from the Elliott Wave Principle – Key to Market Behavior that describes that wave: “wave five is sometimes swift and travels approximately the distance of the widest part of the triangle. Elliott used the word “thrust” in referring to this swift, short motive wave following a triangle. The thrust is usually an impulse but can be an ending diagonal. In powerful markets, there is no thrust, but instead a prolonged fifth wave. So if a fifth wave following a triangle pushes past a normal thrust movement, it is signalling a likely protracted wave.”
In summary, this final wave must go to a new low, must at least be the length of the longest wave of the triangle, and can often be very long and dramatic. The bottom chart from 2008 gives you an idea of that length as compared to the pattern we’ve traced out so far, which is the same. These bearish 5 wave combinations of major bear markets are invariably the same, time and time again.
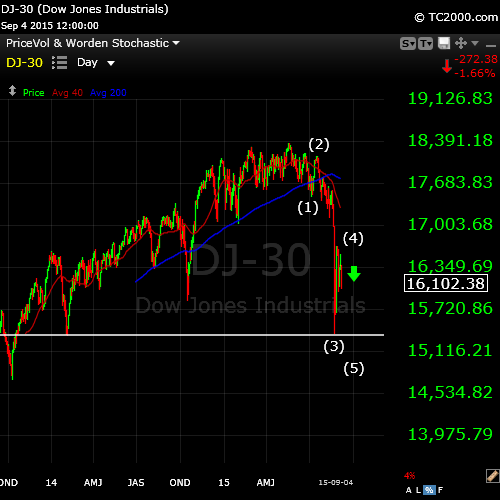
Let’s take a look at the bigger picture, with this chart of the DOW (above). You can see the massive drop so far, which has wiped out two years of upward progress (so far). We could see another large drop in the order of 1,000 points (or more) in the DOW to complete this final wave. But be careful at the bottom, because these final waves can result in a sharp capitulation move and then a very sharp and dramatic retrace, which you’ll see in the very bottom chart of the drop in 2008. Interestingly enough, it was at the end of August.
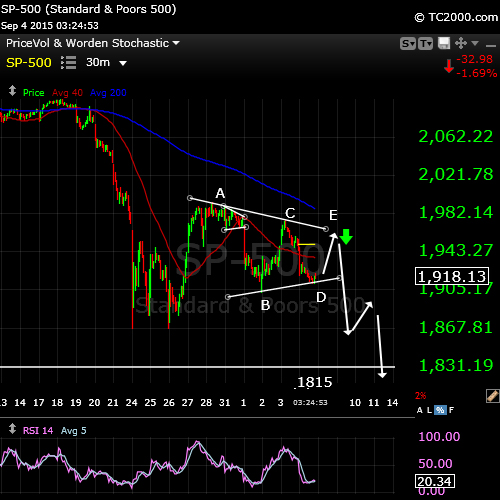
Now the SP500. This view shows the fourth wave triangle unfolding. I’ve drawn in the path from here. I would expect a turn down at the top of wave E at about 1964. In the SPY, the turn might be around 197.
The waves are not in proportion to how they might play out. It’s difficult to say how long the fifth wave will be, but it will be in 3 waves (a continuation of a 5 wave pattern, the triangle taking up waves 1 and 2). The fourth wave could end up being very small, and in fact, the third wave down from the top contained a running triangle fourth wave, which hardly retraced at all.
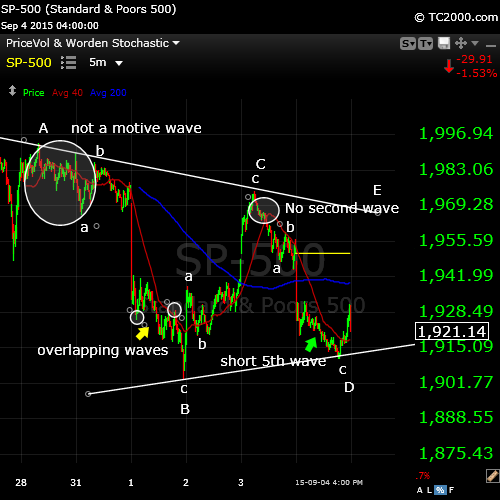
For those of you who follow Elliott Wave, or want to learn more, here’s a zoom-in shot of the SP500. There are several issues with this sequence of waves that make them all corrective, or each 3 waves. You can see I’ve labelled the waves abc to show that they’re corrective. I won’t go through them all here, but if you’d like an explanation, I’ve provided more detail on a separate page here. The point is that this is definitely a triangle. It can be nothing else.
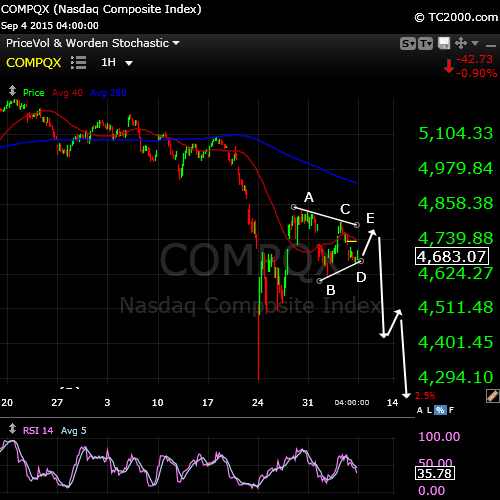
The Nasdaq (above) sports exactly the same pattern and will have the same outcome. This chart points to the magnitude of the upcoming move. We must reach a new low before wave 5 is complete. In the Nasdaq, that will be a drop of more than 400 points just to get there from the top of wave E. I would expect a turn down near 4780.
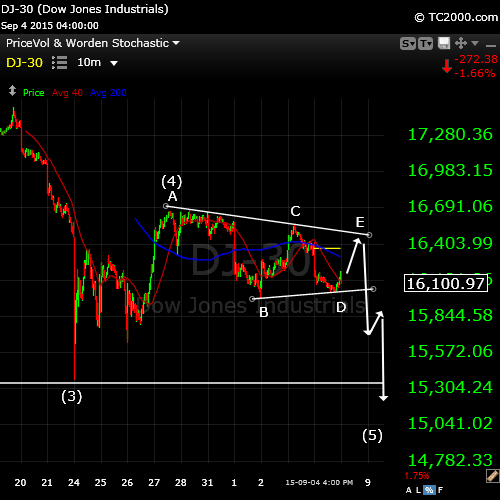
The DOW above is no different. I’ve labelled the chart and drawn in the projected path (again, not to scale). The DOW must travel at least 1,000 points to reach a new low and may go lower still. I would expect a turn down at about 16,488.
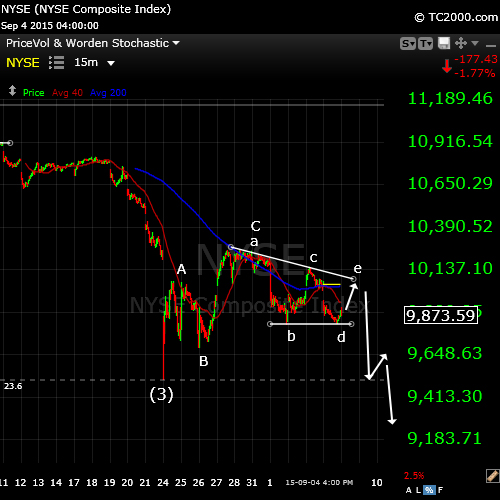
Finally, let’s look at the NYSE as a whole (above). It’s slightly different, in that it shows a barrier triangle, which is even more bearish than the nicely balanced, horizontally positioned, contracting triangles of the other indices. With barrier triangles, the lower line is horizontal, but the outcome is the same.
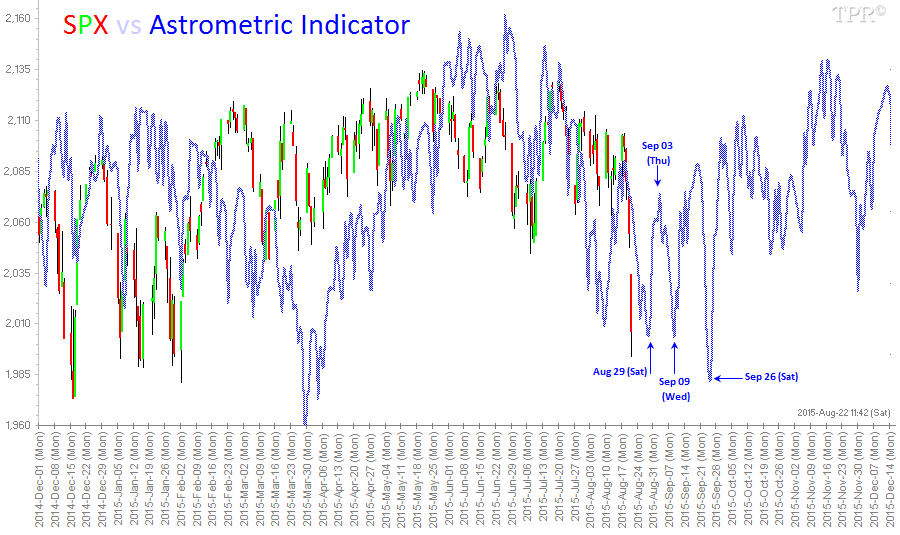
Above is an indicator for the SPX (SP500) that I’ve taken from Time-Price Research. There are many more charts that pertain to timing the market through planetary influences. It’s very worthwhile checking out all the information that’s kept up-to-date on a daily basis. This suggests that the bottom of the fifth wave may take place on Wednesday, September 9.
The next wave up after we reach the bottom will be in 3 waves. I expect a dramatic A wave rise and then a short term top, before heading down in a B wave. You can see a September 26 date which might coincide with the B wave drop (not to a new low). Then there will be a C wave rise into a top in October. More about all of that as we get closer.
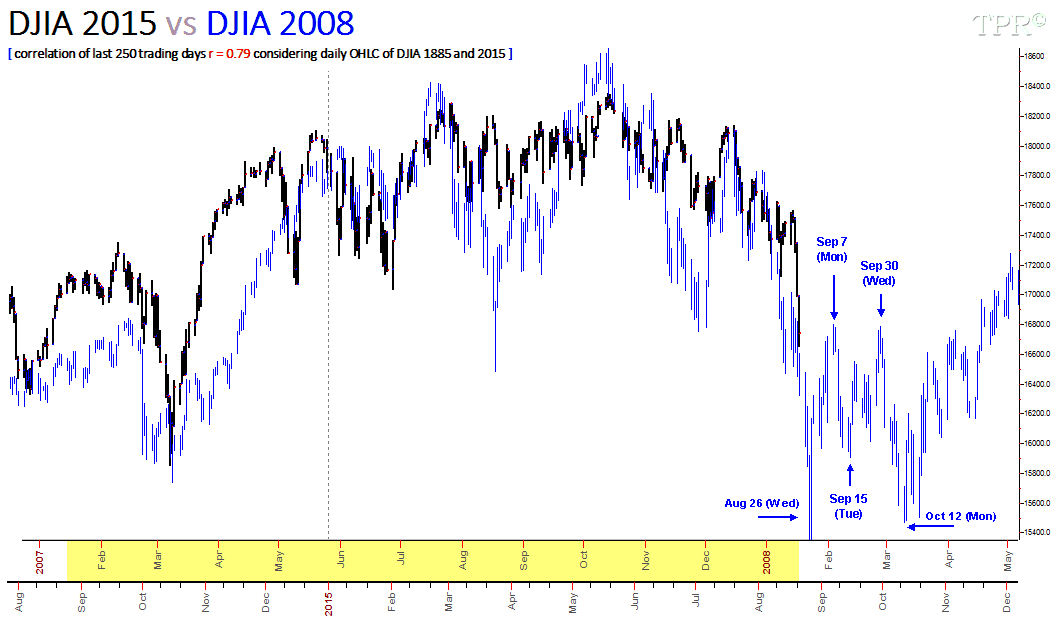
I’m posting this historical perspective in order to provide some guidance in terms of what’s in store for us (also from Time-Price Research). On this chart (the DOW from 2008), you can see the third wave down in black and then the final fifth wave down in blue. It’s instructive to note the length of the fifth wave in comparison to what had transpired to that point. Check out the similarities in the wave structure of the entire drop from the top. Note the dramatic rise when the final wave hits the bottom. Take a look at the three wave pattern after Aug 26, which is what I alluded to in my comments below the Astronomic Indicator chart above this one. Take a lesson from history—these drops typically follow the same path time and again.
Summary: I expect the market to complete the 3 way rise within the triangle (wave E this weekend) and possibly top on Tuesday morning. This would set up for a drop in Wave 5 to its conclusion. It will be a dramatic drop which will be answered with a dramatic rise at the bottom.


Thanks again Peter!!!
Still 1 thing is not clear to me: do I understand it correctly that wave 1 and 2 are D and E in the triangle? So in other words, D and E overlap with wave 1 and 2 so they are the same???
Cheers,
W
Yes, the triangle acts as 1 and 2.
Haha! Asking a question without reading till the end, very smart W! 😛 Ignore me Peet. 😉
I am very curious if the Wave 5 down will play out. Why? I am starting to doubt this scenario somehow (I can’t explay why) even though it is also my main scenario (S1).
My alternative scenario (S2) is that we made a bottom on Friday and will head higher into 9 September (fast!) and look for the big Wave 2 top…
Well, I just hope S1 will play out. Looking at EW and all the evidence you present I can only concur with you Peet. 🙂
Cheers,
W
Peter, excellent post as usual…
My fb group count on the stock market (a little different from yours) continues to project that the stock market is finishing up its c of ii of (iii) of {iii} with a price target of approx. 14, 680 on the DJIA (1708 SPX) and time target from late September to first week in October. This was based on an approximate 20% price correction from the May top. So far so good… the anticipated 2 to 3 trading-days bounce from Aug. 31st/Sept. 1st…. and here we are about ready to commence the next leg down (no later than Sept 8th).
For anyone that studies history as I do, one could also have expected the stock market to move in the opposite direction of its new downward trend during the first few trading days of this new month, September. These are the “head fakes” that one comes to expect… I call them “First Way Wrong Way” moves designed to fleece the pockets of inexperienced traders lured into the market when in a corrective mode. The last few days was a perfect example. The Dow Jones Transportation Average provides many examples as well…. we saw turns on Feb. 2nd low, Apr. 6th low, May 4th high, June 3rd low, July 8th low, Aug. 5th high, Sep. 3 high. This fits with my longer term projection of a low in late Sep/early Oct to be a low in the first couple of days in October. (Also notice the 3-month lows in early Jan., early April, early July… with the anticipated low coming in early October. Also we can see the low-high-high-low cycle and a repeat of this pattern would give us a low in early July, a high in early Aug, a high in early Sept and the anticipated low in early Oct. fwiw…
This is a good analysis and good be proven right.
If this week is down next week will be up as Mercury starts it retograde cycle on the 14 and will lure everbody in agian..
Joel is your facebook group open for new members?
If so I m interested can you write me a note email
markentom@gmail.com
Thanks
John.
John… Our group is a mix of cycles/TA and fundamental analysis. It’s not for people that think “fundamentals are useless”… of course, markets are not scientific as most assume, but instead are based in psychology.
Through the study of history, cycles, and the macro-economic fundamentals, predicting government and investor/trader reactions to market conditions and policies especially at turning points in the cycles is imperative to anticipating where things are headed.
I could explain this in detail but would just be repeating an ongoing discussion for the past 17 years starting at the CSU Long Waves group carried over into the original K-1 discussion group at Kitco. Discussions posted as far back as 17 years ago accurately projected the economic conditions we are seeing today. Charts confirming the interpretations of those macro-economic fundamentals posted as far back as the late 90s, projected market conditions today.
In my experience, people that say fundamentals are useless are people that misconstrue them or don’t have the ability to connect the dots showing the big picture.
I do NOT see Sept 8th as start to the down trend. 8th represents abundance. The 9th represents endings. The bears will once again be disappointed for the 8th. you mentioned at the latest Sept 8th. For the bears sake,I hope you will be correct that Sept 8th is the start of trend down wards. Do you have a alternate count if you may be wrong? I have a half position long in the market as of Friday afternoon and plan on purchasing the other half Tuesday morning if the market does not GAP UP. All the best to you and every one else.
Actually… although I thought I was clear, apparently not.
“the stock market is finishing up its c of ii of (iii) of {iii}…” means that September 8th should be the last day of early September (given that yesterday was a holiday) for the “c” leg to finish… that would be today.
So far this bear is not disappointed in that my May top has (so far) been correct… we shall see.
you will be proven correct.
Joel!
That sounds good, I hope it will be this way, but I am still in doubt…
Greetings,
W
Wazzup… Skepticism is good. Thank you for the comment!
Hi Peter,
Excellent EW analysis especially for beginner in EW easy to read and understand. Based upon PALS (planet angle lunar seasonals):
Phase: approaching New Moon bullish
Distance: post perigee sell off over, bullish
Declination: at or near N all week, bullish
Seasonals: bullish all week
Planets: bullish (no conjunctions or 90 degree angles with inner planets)
Summary: long SPX into open Monday, looking for 3 percent gain this week. Following week bearish looking for 4 percent gain on short.
I am with Joel.
1) the lunar cycle predicts a low between 9/28 and 10/11 (gravity)
2) next weekend a heliocentric grand trine on Saturn (see post yesterday)
3) The very special lunar eclipse I posted abour earlier.
4) 10/10 wil be exactly 2 s&p 9/19/14 cycles from the May 20/21 high
5) 10/15 will be 1 year from the 10/15/2014 low.
See what Olga Morales posted:
https://astrologyforganntraders.wordpress.com/
The Jupiter/Saturn cycle, using Vukcevic’s formula gives an extreme reading 10/17. This is about how the magnetospheres of Jupiter and Saturn affect plasma currents within the Sun and – in the end- solaractivity (sunspots).
See http://www.vukcevic.talktalk.net/ for more on this.
Still experimenting with this technique but what I see is promising.
We have to realize that solar activity is just one of the forces. So as a standalone tool it has less value than when we combine it with other tools.
But now we see confluence in Gann (2*360 degrees in square of nine on S&P), gravity and solar activity.
10/16 mercury max west, 10/26 Venus max west. Considering the orbits of those two; this alignment is significant. Bradley dates give a strong cluster 10/8-10.
10/12 is 12 squared from 5/21. 10/9 is 120 degrees in the Galactic year, using the solunar year (346,36 days).
2/17/2009 Mars and Jupiter were conjunct. Very close to the 2009 low.
Within one 20 year Jupiter/saturn cycle we see 9 Mars-Jupiter cycles (geocentric).
Square root of nine is 3 (duh). But 3 Mars-Jupiter cyles from 2/17/2009 brings us to 10/17/2015.
One mars-Jupiter cycle takes 817 days, about 2 times a full-moon cyle (411.5). The full moon cycle ends with the lunar eclipse (9/27).
There is order in the universe 😉
Hi Andre
very interesting comments. I also follow the daily Moon tidal movements and see frequent matchups with the Low or High of Day at either low or high tides. Normally we expect the Moonrise in Chicago to push ES prices up and the Moonset to bring them down. What are the inversions you are speaking of if you don’t mind explaining, how do you know of them? Thanks
Whitemare,
Inversions can be found in tidal data. I use a tidal station for my analysis. This gives you 4 tides a day. My method of finding them is proprietary, but I am happy to share the results of my analysis. In the previous blog you can find the relevant dates for the entire month.
Cheers,
André
AWESOME! André, if I buy you a retour ticked from your place to mine (The Netherlands), will you come and give me a ‘speedy learning process’? 🙂 I will give you food and shelter! 😉
Thanks for sharing!
@Valley, so my feeling that we might go up hard is backed up by PALS right? 😉
Cheers,
W
I wish I could edit responses… I mean, who writes the word ticket with a ‘d’ at the end? That must be me, whahaha. 🙂
Nothing personal, but I prefer online education 😉
Hi W,
PALS does show bullish for next week and bearish following weak.
Haha André! I like Skype and the option to share your desktop so the other can see what you are doing. 🙂 That is fine by me, haha and saves me a lot of bucks! 😉
Cheers,
W
Also watch Nikkei and Hang Seng they are already breaking there august 24 lows…
All crashes come from the east…
Great job Peter. Your EW analysis is one of the best out there. I feel like reading a good manual with clear step by step instruction. I wonder if you have an alternative count?. While I agree with your count wholeheartedly, my alternative, and most imminently bearish count is an immediate drop to the 1880 area, then a dramatic drop to the 1700s as a sub-wave 3 of a larger wave 4. Then a rally/consolidation back to the 1880 level to set up a final low in the sub-wave 5 of a larger 4.
The Gann analysis and other techniques Andre is researching on are quite fascinating. I don’t quite get everything Andre said because of my limited understanding of Gann, but I follow your turn dates very closely. Peter’s count plus Andre’s Gann is producing something very special that we on this board are surely benefiting. Great thanks!
Agreed that the trend for the next 8 weeks is DOWN. I am fully short with Oct hedge.
As far as market direction for next week is concerned, it looks like there are different reads by the 3 experts?
Peter: down
Andre: down.
valley: up
The Elliott Wave Bible: Elliott Wave Principle – Key to Market Behavior
My last thoughts on the markets…
We are all so conditioned buying the dip and the rally up..
But I think we reached the point that every rally will be short lived and should be sold till Okt 4-9
This week we will be lucky if we drift a little lower after that it’s bear time just like 2008..
Things will fall apart and we will watch lower and lower prices… Bailouts,margin calls etc,, and the fed is not able to do a thing about it….. This is the big one…
John>>>>>>>>>>>>>>>This week we will be lucky if we drift a little lower after that it’s bear time just like 2008..
Things will fall apart and we will watch lower and lower prices… Bailouts,margin calls etc,, and the fed is not able to do a thing about it….. This is the big one…
I see that scenario being played out, possibly late Sept into the 3rd week of Oct
All the best to you.
Thanks Dave,
Just look at fundamentals the Titanic hit the iceberg big time and we are short of lifeboats…the money printing machine is broke ..confidence is gone with the wind
This system is dead…
I think we will have a complete mess and revolution… but after that we will enter a new era
LOLOL John, save me a lifeboat. I will be liquidating my longs tomorrow. I doubt very much I will be able to get the other half of my long, due to a gap up in the markets.Thats find, I am happy.I will be getting very aggressively short. I am looking for Sept 14th possibly the 15th for some kind of deep retrace in the markets to at least the previous lows. LOL I may be a week early, but that is better than being a day late. All the best John and every one else.
John………………… I think we will have a complete mess and revolution… but after that we will enter a new era. Yes you will be proven correct John. It is like the great Roman Empire about to crumble, rotting ( cancer)from within the whole economic system. Their will be revolutions against the governments around the world because of the corrupt system. The people will start to stand up against the controlling interest. It is than, we will enter upon a whole new paradigm shift in consciousness to unveil a whole new economic system, freed from corruption. I am looking forward to the new shift that will free the common man from this slavery system we are in. . LOL, Their is light at the end of the tunnel, we just need a little more time to finally see the unveiling of our new paradigm shift.
Happy to see we are on the same page..
I like the work of Ravi Batra he has made a lot of predictions that have come true
This is a good link:
https://onenessofhumanity.wordpress.com/2015/05/23/economist-dr-ravi-batra/
John, good info.
Dave,
If you really want to get into the background of it all and have 3.5 hours, here’s a powerful online documentary that goes right through the history (if you haven’t seen it already), starting with the Rothschilds, who I mention in my vidoes: “From JFK to 911: Everything is a Rich Man’s Trick.” https://www.youtube.com/watch?v=U1Qt6a-vaNM&feature=youtu.be
And then there’s the controlled demolition of the World Trade Center to top it all off: http://www.garlicandgrass.org/issue6/Dave_Heller.cfm
Yes, the revolution is on its way …
Thanks Peter, I will take a look later on tonight.
Thanks Peter for the links! It makes me sad that (becasuse I believe this is how the world works) a war is needed to end this shit…
I guess, a lot of people are not aware and won’t believe this even after seeing/reading this stuff. At least we know what is coming…
Cheers,
W
I was 13 and in school in the US when Kennedy was assassinated. I never believed in the gov’t story and have several books on it, “Best Evidence” being the best. This just filled in the holes. I think it’s an exceptional piece of research. I already knew the war connections through other sources. Yes, it’s a sad situation …
Thanks for the information Peter,
There are so many questions why?
The lowest point SP500 March 2009 666 ( number of the beast) coincidence no it’s all planned.
And that is what is happening right now lure everybody in… crash the system and buy back for nothing and gain more power..
Behind this is the strategy :problem -reaction -solution
The same people who cause the problem example…. ( twin towers)… watch to see the reaction (the people scared).. ofer the solution.. war…Irak… and so on camera’s every where freedom gone..
Hey Peet!
Good we are on the same page about a sad thing… 🙁
With the spike up (gap up opening, gap still is a little open) this morning in Europe, do you see your plan evolving? I guess right?
Cheers,
W
You’re going to find that EW is exceptionally reliable. These patterns happen over and over again. Yes.
btw, if you look at the US futures (ES or NQ), you’ll see that we’ve finished the A wave up and are in the B wave. That leaves the C wave for tonight.
Yes, Peter,
ES looks like to be in wave B. It down exactly 0.38 level from the high of wave A, but a little bit strange that it is blocked there for the whole day wishing to break it down.
Do you think if it may begin the 5th wave directly from here without finishing the wave C in E ?
Peter!
I hope you are right since something tells me it is still not clear and we might get up hard… If this happens, what is your alternative or are you just looking at this scenario right now?
Cheers,
Wouter
Coincidence I just received this link:
https://www.youtube.com/watch?v=XM1GiqaXluQ&feature=youtu.be
Cheers
Well Peter,
we should be heading south quickly I guess Mercury retograde is Sept 14 and may be the Joker for the dramatic move up after the drop…. if that comes you will beat all the other forcasters.. just wait and see how this will go from here,,
Cheers
Well, thanks …
but that’s a little ways off, and this is not magical, it’s just Elliott Wave (and I note Elliottwave International has the same count), so it’s just the experience and knowledge to read the waves. I certainly can’t be the only one out there … EW is how the market moves. Planets/cycles can help with the actual turn date at the bottom.
Well,
Neuro netwerk,peggy,Valley,Stan Harley,etc are all on the other side this week..
I think we may have to do a double top still. We’ve come down in three waves, so I’m paying attention to that.
Well, there’s obviously some positive bias here this morning, but I don’t see us going above the upper trendline on the triangle. I’m not a day trader so I will be patient. In both futures and indices, it’s a three wave move up (abc), so I expect it to burn itself out before it moves very far …
Peter,
do you mean that it should do one more wave up to touch the upper band of triangle?
Yes, if it’s a triangle, it should, but the indices look like one wave up right now (over the weekend), so they need a small c wave and that would suggest a double top to this morning’s high. Either one of those makes the most sense to me. The larger move is down, so it depends on whether you want to play smaller waves. As a daytrader, I would think there’s a good move in the futures to this morning’s top. I wouldn’t give it much more than that.
And if you play it, if it does a double top, it has to go up in 5 waves, as it’s an ending wave 🙂 We’re in wave 3 now.
Dmitri,
This action in the futures is why I’m not a big fan of playing countertrend moves in this market. The retraces are brutal, particularly right in front of a big drop. I can find enough pain on my own … 🙂 I’d much rather wait. I’m expecting the indices to top at the end of the day, based on what I’m seeing, and the futures in the morning. All the waves up are obvious corrective waves.
Since this will be my last posting on this blog, I thought I would leave you one more update. The markets are having one last frenzy here. It is just clearing out as many bears as possible. Their were just to many bears in this time period. I personally will be going short towards the end of the day with 3x etfs and layering in the put options. No one has mentioned Sept 14 th – 16th I am looking for a retest of the previous lows at THE VERY LEAST. Their seems to be very little interaction on this blog for my liking, mainly due to being a EW blog. I take full responsibility, no ones fault. All the best every one.
PS Remember to take profits. Bulls and Bears make money. PIGS LOSE
Sorry to see you go, Dave.
Hi Dave,
Too bad to see you leave. You are right that it is not that crowded overhere and it can be silent sometimes, but the information quality that is being shared is high imho. But of course I respect your decision. The best to you!
Cheers,
W
Peter,
Looking at the numbers of the bradley Siderograph it seems the market will go sideways
so little up and down in a trading range this changes after the weekend is this possible in your e-wave count?
So we might turn down late next week?
John,
the Nasdaq is a little different than the SP/DOW. The Nasdaq now looks to be doing a flat at 4836.78. I count it in the final wave, but it doesn’t look complete. The SP500 and DOW could be going to a test the top of a second wave, or they could also be going to do a flat. The second wave top for the SP500 is 1975.01. The flat for the SP500 is 1993.48. We’re grinding away.
The thing EW doesn’t do well is timing. I rely on cycles and planetary influences for that. Could it last til next week? The SP500 in in what looks like the final wave, that’s why I’m suggesting a second wave test. The answer is, “I sure don’t think so,” looking at the current wave structure. I could see a turn tomorrow, depending upon what futures do tonight.
There are also wave lengths to consider and measuring the SP500, it suggests the 2nd wave test. We don’t have far. The last wave is in 3 waves, but the market will do what it can to frustrate us all.
I would actually rather not have the triangle, as triangles tend to limit the length of the fifth wave. The two options will leave it open-ended and easier to measure once we have a first wave down.
Thanks Peter,
I was thinking again this looks like the bear of 2011.
I have mentioned earlier complex botomming proces till early Oktober.
So I googled for 2011 and I was not the only one today zerohedge showed me this It is in line with my gut feelings…
http://www.zerohedge.com/sites/default/files/images/user3303/imageroot/2015/09/20150902_bear1.jpg
As I’ve said several times, they all look pretty much the same. We eventually have to go to a new low. However, the fourth waves are different in this case. In the fifth wave, the 2011 one did an ending diagonal, which is always an option, but that’s once we start down in a fifth wave, and we’re not there yet. The fourth has a couple of possible ending points.
Clear thanks,
My best Guess up in between sp 1975- 1993….top there go down test bottom again up and final the capitulation move Okt…
John,
I added short update: https://worldcyclesinstitute.com/wrapping-it-up/
I’ve just measured this final wave and after seeing the first wave up within it, the top measures at 1993. So this looks to be a flat. I suspect we turn at a double top tomorrow morning.
Within 10 hours after the close tonight the market will turn. Take care!
Cheers,
André
P.s. If this happens I’ll explain my new timing this weekend.
Hello, Peter,
do you have any ideas where we are now after this crasy rally overnight?
Dmitri,
This is the flat I mentioned in comments yesterday. We need to do a double top. Fourth waves have 11 patterns and this one ends up being the most common. We should turn down today or tomorrow into a long 5th wave. I see André has posted with similar info.
Dmitri,
I was looking at the futures when I gave you that forecast. They’ve gone up in five waves. The main indices have gone up in three waves, so we need to do one more wave up, which will likely break above the previous high. We’re in a fourth wave now, which should go down to the previous fourth (SP 1967 or so). We then need to do a fifth wave and that may stop at 1997 or could go as high as 2013 before turning down.
So it looks like we’re stuck here for the day. This would fit with a turn down tomorrow morning. We’ll just have to see. Waves in a flat are 3-3-5 and this is the last one and we’re heading into the final wave.
We may also stop dead at the previous high, which is 1992 and change in the SP. All the other indices will do the same, of course, and futures will follow.
Thanks
Dmitri,
This most recent wave down is a corrective wave (missing a second wave), so we’re back to the top. I suspect this is simply going to be a flat and I see on the SP that the target is 1993.48 (updating the earlier number).
Hi André/Peter,
I am still wondering if we will make my 2040… Let’s hope I am not right, but for now my alternative scenario is working perfectly… Not happy with it, should have sold puts on Friday/Monday. Doesn’t matter, I will add extra this Friday. 🙂
Cheers,
W
PS: André, looking forward to your new forecast!
Hi Peter/André,
Somehow I still see 2040 coming… A way longer than normal wave 4 that means… So let’s see, because this market cannot be trusted and we are all being misleaded…
@André, I am looking forward to your forecast and the reason why! 🙂
Cheers,
W
Well, buddy, hate to break it to you, but that’s now impossible. Going above about 2013 would make wave 3 the shortest wave, which is a very strict Elliott Wave rule. Wave 3 can never be the shortest wave. So, we’re stuck with turning before about 2013 or less, depending upon how deep this fourth wave is …
Peter,
No idea, why I could not see my old post.
So I reposted something alike and now I check back and I see both. WEIRD!
Cheers,
W
I updated at chart from about right now: https://worldcyclesinstitute.com/wrapping-it-up/
It shows the most recent labelling.
Looks like we go down directly
No, I don’t think so. We’re right at the 38% level. This is where the fourth wave should revert to and then bounce to a fifth wave top.
PLUS, they aren’t motive waves down. They’re corrective.
Now, if we go from here up to 1977 (62%) in the SP500 and then turn down, I’m wrong. But this still looks like a flat finishing up to me.
I’ve added the shorts and going to keep them.
Any way even if we bounce we should go down later
Correct. We should just top from here and then roll over for good. I think tomorrow morning. This still looks like a corrective wave down to me … a fourth.
In the ES, which I’m watching, the previous fourth is at about 1945, which is where it might bounce. I may play it up. SP should bounce from about here.
Do you have any invalidation level that if we break down you will change your count?
We’re already starting back up. A first wave down has to go to a 62% retrace up in three waves. If it turns there, we’re done. Nothing comes straight down. And it has to be motive, which this wave is not (that I can see).
Wave 4 came down so far, that to keep wave 5 up legal, we can only go to 1994, so that pretty much confirms the flat at 1993.48. Otherwise wave 3 would be the shortest wave and that can’t happen. Dem’s da rules.
So somewhere between 1795 and 1994 should be the final top (and my money’s on 1994).
Just another quick note on your question. It’s not the wave length, it’s the structure that makes the count.
And now the SP has hit the previous fourth level, at 1946. Still looks corrective.
Now things have changed again. Wave 4 has come down below the previous 4th, so I’m going to have to think this through tonight, as the wave relationships have changed. But the wave either isn’t complete or it’s corrective. Doesn’t look right to be motive. Dilemma. Hmmm.
Dmitri,
This now looks like a first wave down … it turned into a 5 (I think) in the last half hour or so. We’ll have to see what happens tonight. If we head up to 62% and turn, then we’re into the fifth wave down. It’s very strange where it turned, though.
However, I can now count five waves down.
Ok, Peter,
if you find what happens could you give your opinion.
I’ve the feeling to lose the wave we’ve been waiting for
I wouldn’t worry about that. If we’ve started down, this would be the first wave of the third actually. We now need to bounce 62%. That’s the best place to get in (which is almost back to the top). This wave has a long, long way still to go. We have to get to a new low just for starters.
You’ve seen what happened to the wave 3.
1500 points down without any bounce. When the unwinding begins it’ like a waterfall.
You cann’t predict such a move. You should just be in the position adding at the bounces and selling after important drops
Well, no, that’s not true. You have a short memory. Wave 3 had a second wave like any third wave. That was where I got in – right at the top of the second. And I predicted that wave. It also had a fourth wave, but that was a running triangle and they don’t retrace all that much.
I’ve been doing this for a long, long time. There’s always a second wave and it always goes to 62%. Even in this first wave, there was one. And there’s always a fourth wave. You can see them all in today’s wave.
But there are differing opinions out there as to whether this is a triangle or not. I don’t happen to think so at the moment.
In any event, we’ve done 5 waves down and we need to bounce and do a second wave, or we continue down and create an abc wave with an even bigger bounce. Those are the options at the moment.
Hi Peter
First , I like to thank you for all your efforts your are putting here , and for sharing your thoughts with us .
Am I right thinking that second wave up could reach up to 78.6% and even 88.6% ?
Regards
AZ
AZ,
A second wave in Elliott Wave can retrace to 99.9% of the first wave. In fact, that’s what I believe happened today in the SP500 (not quite that far, but almost!). But it also seemed to tag a previous second wave, which gets a little complicated. I’m going to try to explain that in a post tonight.
Hopefully, I answered your question.
Thanks Peter,
Just a new chart and what you expect next would be verry nice..
Hi all,
As far as I can tell, we are in a VERY complex wave 4 and I will remain looking at 2040-2050. 😉 After that, wave 5.1 will start imho.
Ofcourse I keep the 1994 in mind, thanks for that Peter. Awesome how you make yourself so clear and help us to understand EW better! 🙂
Cheers,
W
Don’t see my comment again…
Now I do, ignore my last 2 posts guys. 🙂
New post up. https://worldcyclesinstitute.com/wave-five/