
 On Friday, the frustration with this market took me back to the music of the 60s …
“Set me free why don’t cha babe
Get out my life why don’t cha babe
‘Cause you don’t really love me
You just keep me hangin’ on”
That’s the chorus from “You Keep Me Hanging On,” a big hit for both the Supremes (1966), pictured to the left) and Vanilla Fudge (1967).
This market from a big picture perspective just keeps “hanging on” and this D leg of the triangle is doing exactly the same thing.
In any event, my prognosis of the D leg has changed since the Chart Show on Wednesday: I now think we have one more small wave up to the original target of 2750 (or slightly higher) before the E leg down gets underway.
Subwaves are exceptionally difficult to analyze at the moment, so my confidence level in that call is about 70%.
All the Same Market Turns
Last week I wrote about “All the Same Market” and laid out the current supercycle count.
But there’s an additional point I want to make about the recent action in this market. This weekend, we have USD currency pairs in various stages of a turn. They all turn together now (more or less with the US indices) and this is wreaking havoc with the wave structures.
Currency pairs tend to wander around aimlessly waiting for the US indices to turn, for example, so this makes it more difficult to catch them. Waves in the US indices, by and large, are shorter than waves in currencies and so we tend to wait until they sync up. It’s frustrating, but that’s the market we have.
Volume is also exceptionally low and this is adding to the challenge. As I tell my Trader’s Gold folks almost daily, this is the most dangerous market you’re ever likely to experience, so extreme caution is warranted trading it. Entries are not as clear-cut as they normally would be.
Extreme caution is warranted.
Elliott Wave Basics
There are two types of Elliott wave patterns:
- Motive (or impulsive waves) which are “trend” waves.
- Corrective waves, which are “counter trend” waves.
Motive waves contain five distinct waves that move the market forward in a trend. Counter trend waves are in 3 waves and simply correct the trend. These patterns move at what we call multiple degrees of trend (they are fractal, meaning there are smaller series of waves that move in the same patterns within the larger patterns). The keys to analyzing Elliott waves is being able to recognize the patterns and the degree of trend that you’re working within.
The motive waves shown above are typical in terms of their look and length. Subwaves of motive waves measure out to specific lengths (fibonacci ratios) very accurately. Motive waves are the easiest waves to trade.
Waves 1, 3, and 5 of a motive wave pattern each contain 5 motive subwaves. Waves 2 and 4 are countertrend waves and move in 3 waves.
Motive waves also travel in channels. The red channel above can be drawn from the apexes of wave 1 and 3 on one side and waves 2 and 4 of the other. The end of wave 5 typically meets the trend line on the wave 1 & 3 side before it reverses.
Countertrend waves move in 3 waves and always retrace. You’ll find much more about them in the countertrend section and the page on “The Right Look.”
To use Elliott wave analysis accurately, you must be able to recognize the difference between a trend wave (motive) and a countertrend wave (corrective). There’s very much more to proper Elliott wave analysis, but this gives you the basics.
____________________________
Registration for Commenting
Want to comment? You need to be logged in to comment. You can register here.
If you register, it protects your information. It also allows you to comment without filling in your information each time. Once you’re registered, simply go to the home page and click on the login link top right in order to log yourself in. Usually, you’ll be logged in for several days before needing to be logged in again.
______________________________
Problem receiving blog comment emails? Try whitelisting the address. More info.
______________________________
Have not had a losing week RW 2
Have not had a losing week …I have been with Peter almost a year. The only thing that matters is have I made money with his service. I think I have finally turned the corner using Peter’s EW. I have not had a losing week in the last 5 months. Thanks Peter, for your amazing amount of hard work. —RW |
Rise above the rest … SM 2
Rise above the rest …I have only ever met a few people who, in their chosen fields (astrology, medicine, music, martial arts, technical analysis), rise above all the rest and you are one of them…you have ‘the gift’…and that’s why I’m a Trader’s Gold member. —SM |
the real deal SM 2
The real deal …‘Educational, insightful and thorough market analysis for all levels of traders. It’s Elliott Wave at its best….Peter Temple is the real deal’ —SM |
The best of them JL 2
The best of them …Last couple of years, I subscribed to several ‘market traders’. You are by far the best of them and the personal contact is awesome. Daily and daily updates are very well written! Besides your expertise in EW, I also like your cycles analysis. Best investment I ever made! —JL |
Get an upper hand … JC 2
Get an upper hand in trading …Seeing all the different currency pairs and the wave structures and hearing you explain why this has to do that on a nightly bases gives one a upper hand when trading. Elliott Wave applies to all stock and indices and can be applied to any candlestick chart. If someone ask what you want for Christmas – Tell them a membership to Peter’s “Traders Gold!”—JC |
Tops in your field DZ 2
Tops in your field …You are tops in your field. Tried to follow Elliot Wave international for years. They were always behind the market. After discovering you, I perceive that you are an expert in reading the waves, which puts you way ahead of the rest of your peers. And you can read the Waves like you are reading tomorrow’s financial section. I pray you stay healthy. —DZ |
Couldn’t be happier … KK 2
Couldn’t be happier …The analysis and insight you provide is simply amazing! I’ve been trading the futures and equity markets for well over thirty years and usually average around 5% monthly. Since joining your Traders Gold Service two months ago, that number has better than doubled. I couldn’t be happier.—KK |
A true expert in Elliott Wave FL 2
A true expert in Elliott Wave …You are a true expert in EW analysis. What you provide is not available anywhere and is priceless. Subscription on your services is the best thing I have ever done. Many thanks for your effort to make me a better investor. I now have more trust in my investment decisions. I hope you will continue the excellent work! —FL |
The Market This Week
Here's the latest daily chart of ES (emini futures)
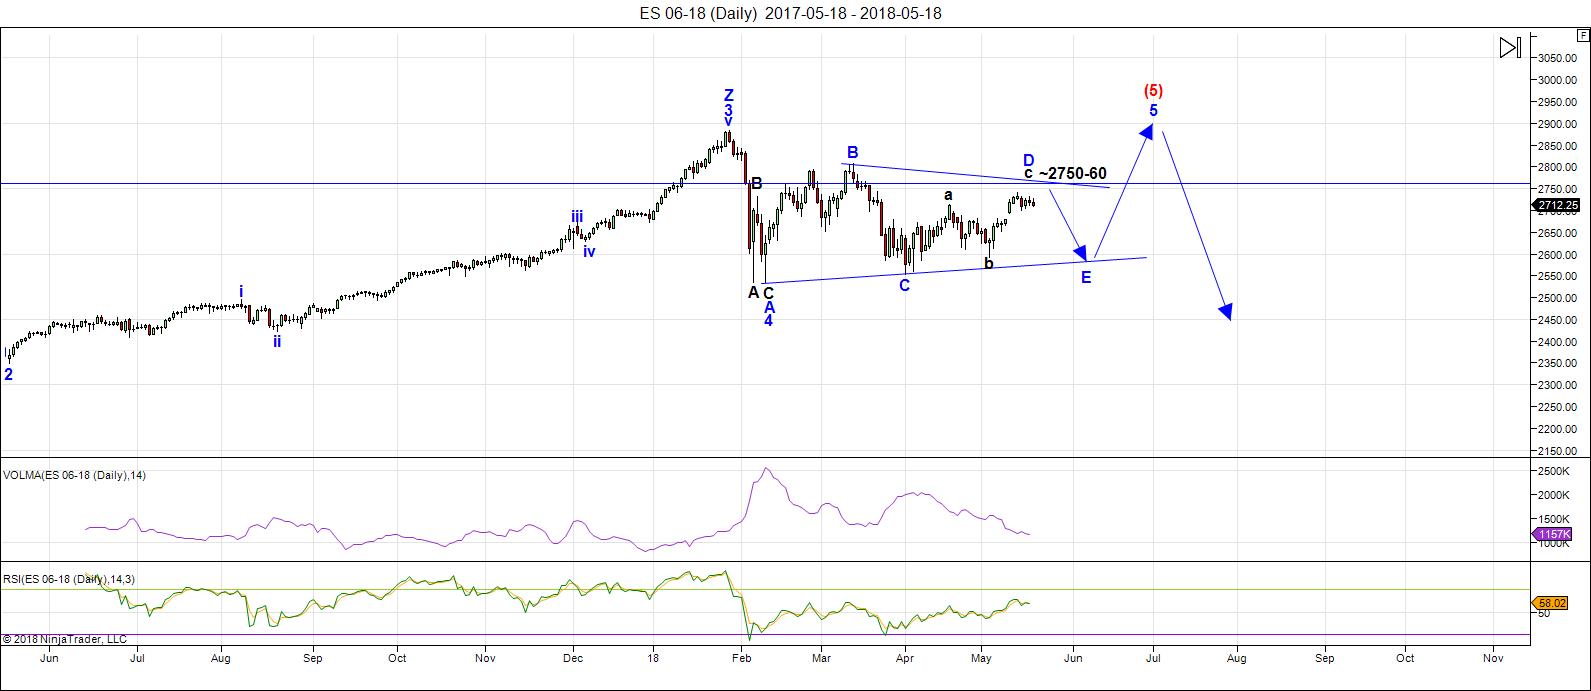
Above is the daily chart of ES (click to enlarge, as with any of my charts).
This past week was a quagmire. We have small degree corrective waves in both directions this weekend and not much to go on for direction. However, my preference is for another final wave up to finish the D leg of the contracting triangle properly.
Volume is exceptionally low and this plays a factor in the volatility and lack of momentum at times (volume is the purple line indicator below the chart).
The D leg wave structure is very complex and the original target was in the 2750 - 60 range. We still may be targeting this level, but the waves are anything but clear. So, early this week, we'll be looking for a top to the D leg, followed by a turn down into the E leg.
The bottom line is that I don't think (based on Friday's action) that we've completed the D leg.
After the E wave down is complete, we'll take off again to the upside in a fifth wave, which will simply finish off the pattern. We'll get to a new high and probably more, but don't expect (as I've been saying for a very long time) a large fifth wave that travels any great distance. (I think 3000 is possible but at the high end of the probability spectrum)
Summary: I think (although I can't be absolutely sure) that we are not quite finished the D leg of the contracting triangle. Targets for the D leg top are within the 2750-60 area. This will result in a high probability trade to the downside (the E leg of the triangle). Once E leg (down) is complete, expect a final fifth wave to a new high. That fifth wave up to a new high will be the end of the 500 year bull market.
___________________________
Trader's Gold Subscribers get a comprehensive view of the market, including hourly (and even smaller timeframes, when appropriate) on a daily basis. They also receive updates through the comments area. I provide only the daily timeframe for the free blog, as a "snapshot" of where the market currently trades and the next move on a weekly basis.
______________________________________
Sign up for: The Chart Show
Next Date: Wednesday, May 30 at 5:00 pm EST (US market time)

The Chart Show is a one hour webinar in which Peter Temple provides the Elliott Wave analysis in real time for the US market, gold, silver, oil, major USD currency pairs, and more. You won't find a more accurate or comprehensive market prediction anywhere for this price.
Get caught up on the market from an Elliott Wave perspective. You’ll also get Andy Pancholi cycle turn dates for the SP500 for the balance of the current month. There’ll be a Q&A session during and at the end of the webinar and the possibility (depending on time) of taking requests.
All registrants will receive the video playback of the webinar, so even if you miss it, you’ll be sent the full video replay within about an hour of its conclusion. For more information and to sign up, click here.


Great post Peter
$RUT has 5 waves up on the daily chart
Yet I doubt it looks like 5 up on weekly chart.
Spx 2600 ? I can agree yet that move will open the door
To a potential bearish triangle as well.
Dangerous market most definitely !
Thank you for you time and efforts Peter
They are appreciated
: )
Peter T,
Dittos on Joe’s Comments! We don’t thank either of you enough!
Thanks, Ed.
Hi Willem,
What happened to your “old indicator”? I found it most useful!
Hi Jack, The old Indicator has replaced the blue line.
The next period is declining.
Monday the LOW and 23th the HIGH. A lower HIGH on the 25th, then a lower HIGH on the 30th, Then a lower HIGH on 5/6th, then a lower HIGH on 11th again in 13th
Thanks Peter. Missed the chart show as I screwed up time zones.
Definitely a trying market!
I just made the last adjustments for this week. I replaced the blue line by my old indicator and I will take the Bradley prediction close. For June it seems to fit with indicator 2a and 2b. The top on the 23th or with a lot of support the 30th.
http://www.prognoseus500.nl/
Be carefull with trading. My old indicator is new on the podium. QE made it look like nothing.
I think you’re right about this week.
387 trading day Turning Point Pattern… on daily a-d line, not the popular indexes…
March 26, 2012 Top (middle high of triple top)
October 9, 2013 Bottom never since exceeded
April 24, 2015 Exact high lasting over 1 year
November 3, 2016 Exact low never since exceeded
May 21, 2018 !!! ?????
Should be said that these a-d points are from TradeStation and may differ slightly from Wall St Journal or Bloomberg data points…
Peter
Your site is quoted in this article
He has a different view yet… This site is referenced
http://www.thetechnicaltraders.com/fibonacci-and-elliot-wave-predict-breakout-highs/
May 28 is a shorter term low to low to…..high ? Count
Also June 6-9 is a turn day .
Thanks for the post Peter G
Peter G,
Trying to read between the lines of your comments…Are you thinking that this might be the beginning of the long awaited divergence between the A/D Line an price?
Perhaps I have too vivid an imagination tonight!
Thank you for all the updates Peter T!
Sold upro, udow. Have a great memorial day. See you all early June. https://worldcyclesinstitute.com/the-500-year-market-top/#comment-30047
Liz H,
Sounds like a short holiday. If so, have a good one!
Lol Peter. “Short” holiday vs “long” holiday.
Yeah, well that’s what I thought … coupla days by the time you get anywhere.
The SPX May 14th and May 22nd highs on the 4-hr chart looked similar to the /BTC 4/24 & 5/3 highs. Fractal too similar for me to ignore.
Ed,
In answer to your question above, all the pattern tells me now is that there’s a cyclic chance that the daily a-d line has reached a top of some kind—perhaps even an important one. The amazing aspect of these new highs in the daily a-d is that not only are the popular averages not confirming those new highs, they are several percentage points below their all-time highs. I am searching for a previous time when this was seen. In the 2000 market, there was historically strange behavior by the daily a-d, but I have not found a time when the daily a-d was making new all-time highs while the DJIA and S&P were 5-6% below their all-time highs. It is perplexing indeed. Until strong evidence argues otherwise, I still feel the Jan 26 high will turn out to be a very major one for two reasons. First, the DJIA broke convincingly below its parabolic upward arc from that high. Parabolic breaks tend to be important and rarely if ever completely retraced within a few years of the break. Second, the 17 year cycle which has been amazingly consistent throughout the complete life of the DJIA beginning before 1900, pointed to late 2017 or very early 2018 as its next resolution after the year 2000. New highs from here on in would be hard to explain if the 17 year cycle, turning point pattern, proves to be accurate this time around…
Most analysts will argue that the A/D line should be viewed as a leading indicator, which is why most of them are seeing a bullish count. In fact the most commonly cited argument against a top cited is the absence of A/D line divergence at recent highs. This market has continued to nullify numerous fib and cycle relationships the past few years so I tend to be a bit cautious when referencing them. The most stunning development in my view is the negation of NINE official Hindenburg Omens in the last year. That is truly a statistical anomaly as significant as I have ever seen!
Hi Peter, just confirming that the chart show is at 4.00 p.m central standard time today (5.00 EST)
As always, yup.
P
Peter G,
Thank you for providing your insight! Always interesting perspectives!
Peter G,
As I have asked before…Aren’t there lots of stocks making new highs that are losing money, losing market share…that have large amounts of debt that will never be repaid?
Why wouldn’t the “answer be” these stocks are making new highs because they are components of an ETF? Wouldn’t that distort the A/D Line?
I believe you are correct when you suggest that the January 26th high might well be
the high for the two reasons you mention. We shall see!
I have to say it is very intriguing to hear so many thoughtful comments about the plethora of anomalies that persist in this market, and has for some time. I suspect when the story is fully told, we will have discovered an obvious reason that so far,I have not heard a single person offer as a possible explanation, namely, outright FRAUD!
We know that banksters are liars and cheats. I refuse anymore to keep large overnight positions in what to me is clearly corrupted and grossly distorted ( wrt price discovery) market. Just one man”s opinion. Trading instruments are not FDIC insured, and even if they were, there is not remotely enough money to cover potential losses. Caveat Emptor!
Everything adjusted and Bradley’s Siderograph added in the graphic
What does that mean???
I have the indicators 2a and 2b that indicate the direction over a period of time.
Let’s exactly agree on September 12 !!
That could therefore be a confirmation that what Bradley predicted is correct.
Careful!
http://www.prognoseus500.nl/
Till 12 september the indictors 2a and 2b give the same as Bradley
https://worldcyclesinstitute.com/the-500-year-market-top/comment-page-1/#comment-29966
https://twitter.com/allerotrot/status/999705794085081088
Free Amanita Newsletter – Manfred Zimmel | May 23, 2018
https://www.amanita.at/docs/open/newsletter-e.pdf
“This model reflects good & bad times for humanity:
good times: economic growth, political stability/ peace, equity bull markets, commodity bear markets, low unemployment & inflation, good world health, calm earth
bad times: economic, financial & political crises/ wars, equity bear markets, commodity bull markets, high unemployment & inflation, epidemics, earth changes
Almost all models in the Amanita system have their bottom of the 21st century around 2022/23 or 2033-37”
To all …
I am suddenly unable to post a comment (happened within the last 15 minutes – I get told it’s spam). I have a sneaking suspicion this has to do with GDPR lockdown that’s happening in Europe. I have my site on a European server, scheduled to be moved this weekend, so I may have to speed up that process. I have a message left with my server company, who will hopefully call me back soon.
I’ve never had to leave my number for a call back before, so this tells me I’m not the only one that’s having issues. The complexity at the top of a major cycle continues to play out …
I’m now in the midst of moving my site to another service, so there may be some downtime over the weekend but I should be up and running by Monday with everything working.
Peter G
I think ed makes a good point on individual stocks
Being part of an index. I could add all of the various
Etf’s as well. This is off the top of my head yet I’d say the
Mindset of investor’s/traders has changed from looking at
Individual stocks to buying an etf or just buying a sector vs
A stock . As for the advance decline line I’m curious which
Advance decline your looking at : NYSE ? Or nasdaq or ?
Is that a cumulative advance decline line or just advancers minus
Decliners ? Does a person buy say Facebook and Amazon
Or do they buy a FANG etf which buys all of them ?
I do look at the advance minus declines on the NYSE and
I don’t see it as making new highs . It trades in a range .
As for the oddities in this market I’d say the year 2016
Was where the extension began . Also I’ll mention the year
2015 was also an inversion of sorts .
Corporate buy backs also play into this and I read somewhere
That this year 2018 is forecast to be a record year for corporate
Buy backs .
The bottom line though is cycles do appear to change
From to time yet do they really change ?
You mention the 17 year cycle from 1900 yet you didn’t
Elaborate . You also mentioned the year 2000 which the nasdaq
100 crashed into April that year and the monthly closing high
For the spx was July or August 2000 even though the print high
Was March. If my memory is correct it was Sept 2000 when
All of the index’s began to drop $NYA included .
A similar cycle exists this year as well.
One thing I try not to get caught up in though is the
Thought that “this time is different”
History does rhyme but it’s never exact .
Just my thoughts .
Look at previous market peaks there are similarities
In all of them and no 1 indicator is perfect .
Joe
Lastly
The cumulative advance decline line making new highs
As the market index’s fail to make new highs is a very bearish
Sign. Go back and look at the rally from October- Nov 1929
To April 1930 as just 1 example . That same pattern shows up
Enough times to watch for it near market peaks
I like Avi Gilburt and think he is a fairly competent EW analyst. Having said that, I must say I find his confident call for several more years of a continuing bull market to take the S&P as high as 4,000.00 to be sheer lunacy. According to him, this bull market will not end until everyone is convinced that it will not. What irony! 🙂
Possible fractal. Check daily chart.
Netflix 4/25/2018 to 5/29/2018 (?) is similar to
12/26/17 to 1/29/2018.
AAPL, AMZN, NFLX – all in ending diagonals. One more down and one more up to go in the lot of them.
Thanks Peter!
You bet! Not much longer …
How about crude? I’m seeing one more minor high likely there as well, based on my own non EW methods and also some EW charts I’ve seen out there that look solid.
Liz H
I can’t recall the dates but use a daily chart on the Dow or spx begin on May 28 2018
And count backwards . There should be 2 equal distances between lows which then
Points to May 28 . Also while I have said I don’t rely on the Bradley model . June 9
Is a Bradley date for a high . That said using calendar research timing June 6 is a low .
All I can make from it is June 6-9 th as a turn which then targets a Sept 8 turn .
My own work shows a down turn from mid August: mid Sept as a high with a Jan 20 2019 bottom.
The Jan 2019 cycle low points to a late 2019-early 2020 top.
The years 2021 and 2023 being cycle lows.
Some call highs as left translation or right translation .
A high on the left side of the cycle being a weaker type decline yet a high on the right
Side of the cycle tends to bring a crash . That said a high into late 2019-early 2020
Would be on time in my work yet for many I’ll suppose they would consider it a right side
Translation and if so we get one hell of a dump in 2020 going into 2021. .
There is a ton of reasons to expect a late 2020 to 2021 low .
According to the late George Lindsay you count 12 years 3 months to 12 years 8 months
From a major top and look for an important low.
Look at the 1919 high and the 1932 low , or the 1929 high and the 1942 low , 1937 high to the 1949 low .
The March 2000 top as well as the August 2000 top the dates surrounded the Nov 2012 election .
Now take the Oct 2007 top and count 12 years 3 months to 12 years 8 months .
Jan 2020 to August 2020 , the Benner business cycle has a year 2021 low from a year 2018 high.
And the mars Uranus cycle of which has been in effect in major market crashes calls for a rough
Jan 2021 low ( it’s a 2 year cycle )
There in sits my dilemma , everything pointing lower into Jan 2019 and then up .
I’ll go with the right hand translation .
What matters most to me is how this market moves from mid August into January
As that is where the decline should be. Until then I give this market some room
Yet don’t trust it and stay bearish . Next year should be up and that can be a blow off
To higher highs or just a counter trend bounce that retraces a steeper decline .
The Feb 2018 lows I expect to be broken yet I have no downside targets at this point .
This year to me is the set up turning the long term indicators down with 2019
Leaving the market with bearish divergences . 2020 ends up a right translation high
A presidential election and many cycle lows targeting 2021 – 2023 .
So far this year the Dow and other index’s going nowhere .
Short term trading and trading the range may last longer than most expect .
Anyways may 28 is a low to low to high count on the daily chart .
The real move though should begin in Aug- Sept .
We will know soon enough .
1929 high to 1942 low I meant
is there any point making a forecast beyond tomorrow?
as we can see even tomorrows forecast changes each day
wasted energy if you ask me
Hello Joe, count backwards up to when?
Based on nflx, if tomorrow, plays out like 1/26/2018, here are some stocks that hit ATH last 1/26/18 and may have + gain tomorrow:
GOOGL
HD
MA
NFLX
AMZN
PFPT
DHR
Liz h
Feb low and late march low
Chart is old post yet will matter now
It’s a weekly chart using all of the major index’s
http://imgur.com/Vt81aBt
8 weeks and 16 weeks
I never used a daily chart nor
Did I use calendar days . If I had
The data I’d use all of what’s available
Now since we’re getting close .
Quite right about corporate buybacks Joe. That is where the bulk of the tax break is going, and no doubt has extended the duration of the bubble.
The Btadley dates only specify significant market turns, NOT highs or lows.
A historical chart I just saw
The bearish case fits my cycles work
https://s.marketwatch.com/public/resources/images/MW-GJ785_canacc_NS_20180524050701.jpg
The article here
https://www.marketwatch.com/amp/story/guid/9EC1AE18-5F12-11E8-8F8B-B4D651A263BC
Verne,
You mention that “nine” Hindenburg Omen’s have been negated in the past year…
What negates a Hindenburg Omen? I have never gotten an answer from McHugh on what negates a H.O. Thanks in advance.
The site has been moved and seems to be OK. The problem with leaving comments ended up being a spam plugin that was made GDPR compliant yesterday.
In any event, comments are now working again.
Hi Ed. The HO specifies a specific time window in which a market crash is expected to occur after the omen appears. The last omen “expires” at the end of May in just four more trading days. I think a failure of nine consecitive omens would be a first. In some ways it is really not too surprising. We have seen how the era of central bank hegemony has made it a vety dangerous game trying to predict this market, whatever the method employed. I pay absolutely no attention to prognostications and simply take a day to day approach to trading dcisions. The banksters have made many of us day traders, by necessity. Folk with all their life savings in this market in my opinion face outsized risks.
That is very interesting Joe as I have heard a few analysts making the exact opposite argument, namely that the A/D line new highs ahead of the indices is bullish as it is a leading indicator. I have never actually verified the assertion by looking at the evidence and just assumed they knew what they were talking about. I know of late OBV has been a really good indicator (one of the few I still find reliable) of market direction but I need to take a historical look at both the A/D line and OBV. Things can and do change.
Someone did an historical study in the last year or so on the A/D line. Perhaps James Goode, but don’t remember for certain. That person looked at every major top in the last century, and in only one case did the A/D line not form a divergent LOW coincident with new highs, to signal the top. Meaning at the last highs (Jan) if the A/D was not below a prior high, new highs for the markets should still lie ahead.
Would this be TOO difficult for our financial engineers to rig, and thereby fool the majority. Many many folks are paying attention to this “rule”.
Please replace LOW with Lower High in language above.
Yup, Goode. And just several months ago.
https://twitter.com/i/moments/973331872007716864
My point exactly. Just because the market adhered to certain rules in arriving at previous tops does not necessarily mean it has to adhere to the same rules in the current top being formed. It is really interesting how emphatically some folk are pressing the A/D line argument and dogmatically insisting we will not have a top prior to divergence. Look at the remarkable number of new 52 week lows we have seen with nine Hindenburg Omens yet no significant downturn. Something strange is clearly going on. I think it could be a combination of passive investing via ETFs, concentrated buying of heavily weighted index components, and unprecedented leverage. All these factors suggest that when the market finally does unravel, it will fall faster and farthet than any decline previously seen.
A new weekend post is live at: https://worldcyclesinstitute.com/complexity-at-the-top/
This website is for educational purposes relating to Elliott Wave, natural cycles, and the Quantum Revolution (Great Awakening). I welcome questions or comments about any of these subjects. Due to a heavy schedule, I may not have the time to answer questions that relate to my area of expertise.
I reserve the right to remove any comment that is deemed negative, is unhelpful, or off-topic. Such comments may be removed.
Want to comment? You need to be logged in to comment. You can register here.