
 History Rhymes. It’s never exactly the same, but it gets so close that the traits of the underlying cycles are eery when you’re sensitive to the periodicity (the typical lengths of a repeating period).
At this point in my narrative of the last few weeks, I’ve reached the doors of the Great Depression, ending with some similarities with the time of President Herbert Hoover (1928-32) and the newest US President, Donald Trump.
Just like Hoover, Trump is a populist president and just like Hoover, he will introduce tariffs, which will limit trade and is deflationary. It simply adds to the current problem, but doesn’t cause it. Governments always close the doors after the horse has left the barn.
I’m going to take a break from that narrative this week to concentrate on two areas, for two reasons:
- Cycles repeat, both natural and man-made. The former influences the latter. The lead-up to the 1929 crash almost exactly parallels what’s going on today and is the easiest to draw comparisons to, although in past posts, I’ve shown obvious parallels to the 516 year cycles tops (the Renaissance and the printing press of the 1500 top, the height of the Roman Empire and Christianity, and 100 A.D. top, and the 600 A.D. top, which began the Byzantine Empire and the birth of Islam). I’m going to summarize the situation in the 1920 leading to 1929, a smaller cycle turn below.
- Elliott waves run throughout every trend on Earth. Even though I’m accurate in my predictions in the 90 percentile in terms of currencies (the US indices, oil and gold), there seems to be this ongoing belief that there’s nothing to it; that there can be all kinds of different counts. Believe me, there’s only one count. It’s the analyst that’s the problem. I’ll outline where we are below right now, believe it or not
The 1920s and Interest Rates
During the 1920s (right after WWI), European countries and the US were still tied to the gold standard, which linked their currencies together. How well you were doing as a country depended upon your stash of gold, because it had to back up your currency.
If anyone traded in their currency, they were able to receive its value in gold. However, after the war, Britain had spent all its gold to pay for the war, and was in a state of depression. The US had come out of the war in really good shape financially (remember Fort Knox?), as it supplied most of the weapons and didn’t have war on its territory.
In my previous post, The Federal Reserve and the Great Depression, I told the story of Montagu Norman, the Governor of the Bank of England, who colluded with Benjamin Strong (head of the Federal Reserve) to set the US interest rates low so that gold would flow to Britain.
Since all countries were tied together on the gold standard, if you had high interest rates, people would move their money to your country, as they’d get a better return. But at the same time, money in the country with low interest rates is “cheap” to borrow just as it is today in most countries (in fact, we’re involved in currency wars). It leads to speculation in the stock market. It always does.
We’re not on the gold standard any more, so the value of currencies fluctuate; they’re not tied together (that’s the effect of fiat money). Governments today notoriously inflate to reduce the value of their own money so that their products are less expensive on the international markets. In that way, they sell more, resulting in more money flowing into their country. (If you can lower the price of your products, you sell more and become more profitable).
The bottom line is that in the 1920s, money in the US was inexpensive to borrow and that created a stock market casino (just like the one we have today) until the final blow-off, when the Federal Reserve raised interest rates.
It’s the same situation today. Exactly. Just watch the Federal Reserve go …
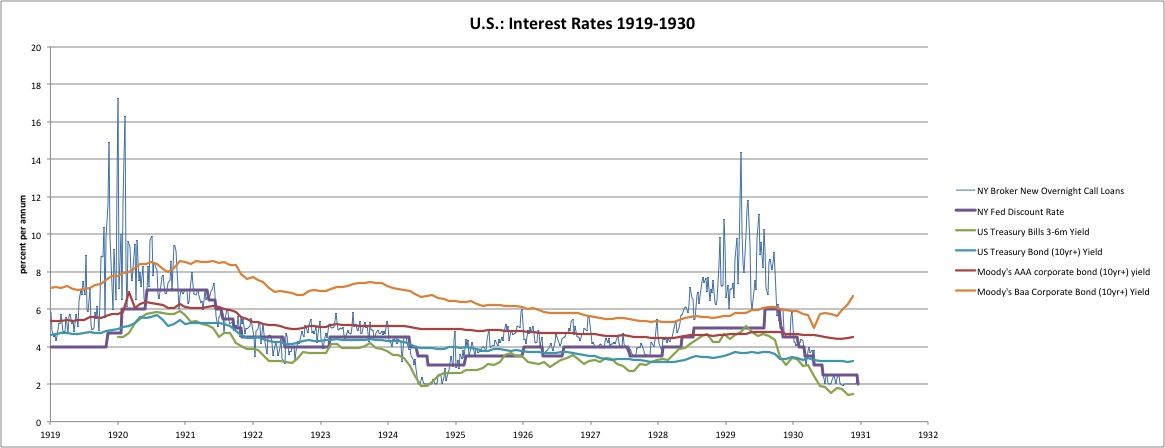
The above chart comes from New World Economics and tracks the US interest rate during the 1920s, leading up to the Great Depression.
You can see the high spike of interest rates in the 1920s above. The Depression of 1920-21 gets dwarfed by the Great Depression of 1929, but you can see the same phenomenon.
Here we go again. On the eve of another Federal Reserve meeting, I’m expecting to see another rise in interest rates and perhaps another one at the next meeting.
I’m going to suggest that this won’t be the cause of the crash, but is another marker that it’s coming very soon. It will likely help speed up the top, but the path is already “baked in.” Elliott waves tell us that.
Elliott waves run through every trend that takes place on Earth. You don’t find them just in the stock market, and that’s what the final section of this post is all about.
So, don’t discount them. They are hugely accurate, but it’s the skill of the analyst that makes them valuable. There are a lot of “pretenders” out there (that part seriously makes me crazy!). However, there is only one count that’s correct and a whole bunch of wrong ones. I’ll let you be the ultimate judge.
Herding and the Final Fifth Wave
The top will come when the tide has turned—when the final Elliott wave has played out—when the herd has everyone onboard the bull train and there simply isn’t any more money or unreasonable exuberance out there.
I hear the constant predictions of a turn-down at one top of another, but as I’ve been consistent with saying is that truncations in my experience are not real. They’re “fake news” from another time.
The Elliott wave structure forms the foundation for any major trend throughout society, worldwide.
Think of human nature and getting a herd of people to change their minds. Let’s use the example of smoking. Government and health organizations tried for many years to turn the tide on smoking cigarettes through huge amounts of advertising, negative ads right on the packaging itself, and taking the industry to court. But that’s actually just the recent history. All that happened after the tide had already turned!
Even though the argument was incontrovertible, due to study after study, and a long history of death from various cancers, the herd did not suddenly turn off smoking. People don’t suddenly, as a group, make a decision to change overnight. In fact, if you can get them to change a habit at all, it’s a major win!
Herding causes the change to happen gradually.
But the bigger story is two-fold:
- trends of any type follow the Elliott wave structure of 5 motive waves
- governments always get involved once the trend has changed (because they operate on consensus and the tide needs to turn more than 50% in their favour before a law will be passed)
So if you think Elliott wave is some crazy idea that’s kinda weird and sometimes works, guess again. It’s a mathematical representation of human nature and it’s simply going to play out, no matter what! The challenge is in the analyst—how good they are in reading the wave structure, which is fractal (a little plug for me).
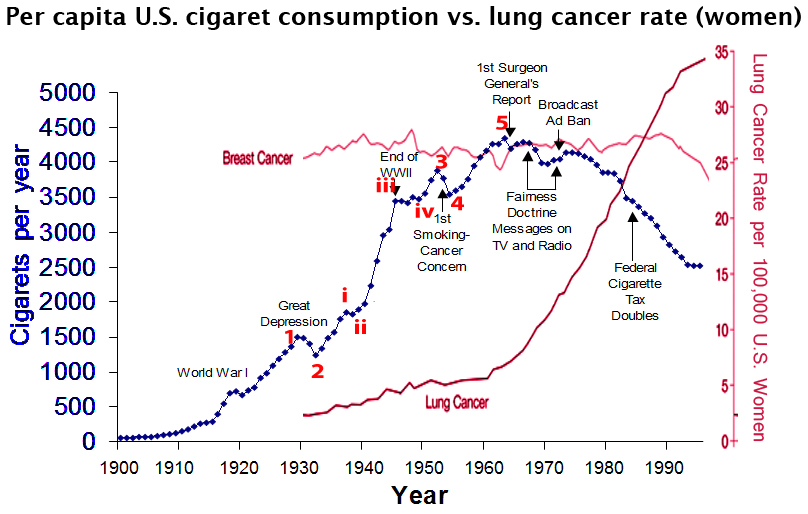
As per the diagram above, the Elliott wave structure of five waves up or down, with waning volume in the fifth wave (and very often an ending diagonal, which is a motive wave, but has the structure of a corrective wave) is not exclusive to the stock market. You’ll find it as the foundation for any major trend throughout society, worldwide. There is more definition to the structure based on how much of the population is involved (ie.-the size of the sample).
The red numbers is the chart above are mine, The data comes from the United States Department of Agriculture: The 1986 Surgeon General’s Report. Note that the third wave even has 5 motive sub waves within it (an Elliott wave hard rule)!
Also take note of the fact that the government gets involved once the trend has changed. But nevertheless, they’ll take the credit for the success of the change. This is just a fact of life, and happens over and over again throughout history.
Take employment, as an example. The government has no real affect on employment but they’ll take credit for it in the good times, and blame it on someone else when it turns sour. We always fire politicians when the market turns down, even though they have nothing to do with it.
Elliott wave are a natural phenomenon and logically are a result of exogenous forces (beyond the confines of the Earth). I’ll let you think about that one—a subject for another post, or video.
My Recent Predictions
Here’s a summary of my recent predictions. I’ve made last weekend’s Trader’s Gold report available so you can check them out (along with what I provide daily and each weekend). You’ll find it here.
- ES/SPX: Of course, I’ve been saying the third wave is not finished yet, You’ll find this weekend’s predictions below. We have one more wave left.
- EURUSD: As I’ve been predicting, it has now turned up into the final wave with a target of 1.13. I called the recent turn right to the pip. Likewise, as predicted, the US dollar has turned down, done a first and second wave, etc.
- USDJPY: As predicted, is still heading up to a target of about 118.60.
- Gold: As predicted has turned down hard. I didn’t predict the “hard” part, but I’m predicting at least a double bottom (likewise for silver).
- Oil: As I’ve been predicting since the start of the year, it’s turned down. It’s been going sideways since then. The next target level hasn’t changed: $33.00.
So there you have it.
Pay attention to cycles. We’re going into a deflationary spiral because that’s what always happens.
We will have a wave 4 and 5, because that’s what always happens.
Now, if you believe this time is different, good luck with that.
_____________________________
Here’s the latest daily chart of ES (emini futures)
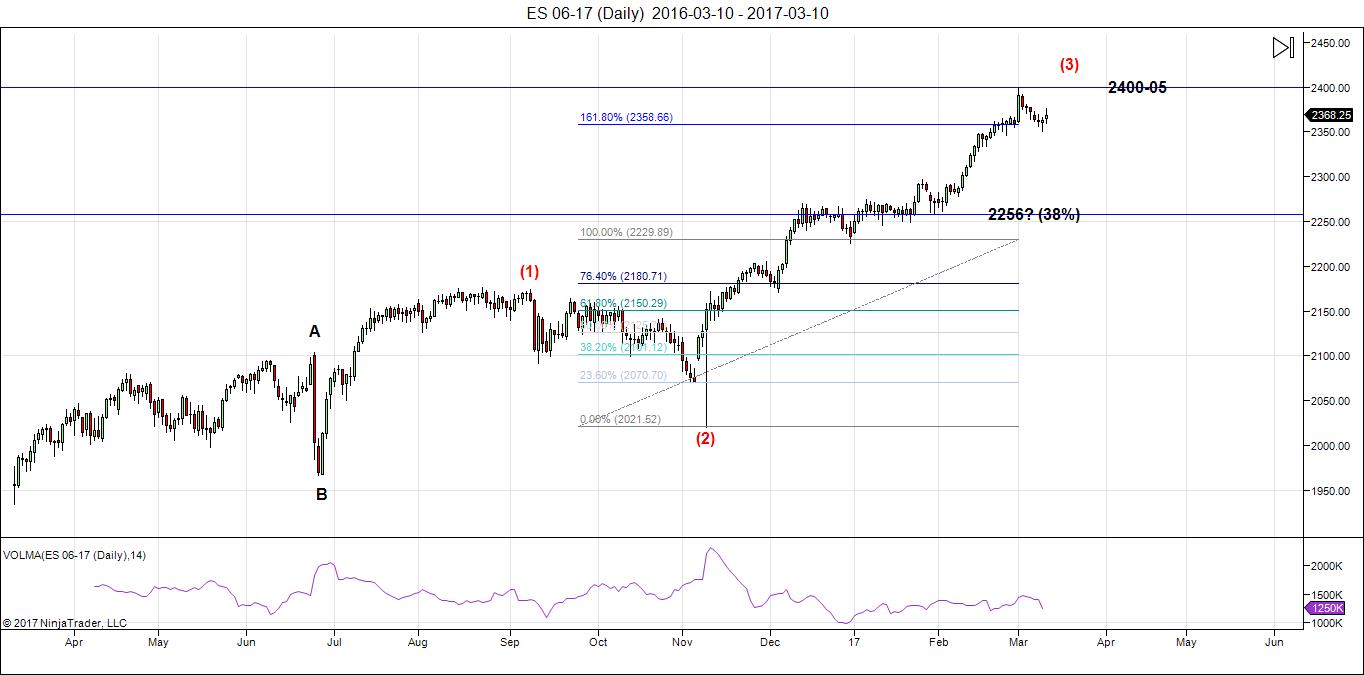
Above is the daily chart of ES. Nothing new here. The full wave up looks to be like a triple three (a combination wave) which is almost at completion (or will be with one small final wave up to about 2406—shown in the hourly chart below).
The larger 4th wave (after the top of 3 this week) will come down in three waves. After we finish the A and B waves, we should be able to project an end to the C wave of the 4th wave. Once we finish the fourth wave , we’ll get a final blow-off wave. I’m making a point of not projecting a final date for a top because the volume is so low, the markets are so erratic, and they’re moving so slowly.
Here are the path predictions going forward:
- Wave 4 will come down in 3 waves with any of the corrective patterns possibly in play.
- Wave 5 is likely to be an ending diagonal. In any event, it will be in 5 waves (not motive).
Summary: We’re at the top of wave 3 of the final larger 5 wave pattern, ready to turn down into four with one more very small wave up to a new high. I expect all major US indices to turn early this week. The larger wave 4 should come down in 3 waves (an ABC configuration to the target).
After completing the fourth wave, we’ll have one more wave to go, which could be an ending diagonal, as a fifth wave. It could also be a wave in 5 waves. It will move in tandem with the final wave in the USD currency pairs.
The long awaited bear market is getting closer.
_______________________
Here’s the latest HOURLY chart of ES (emini futures):
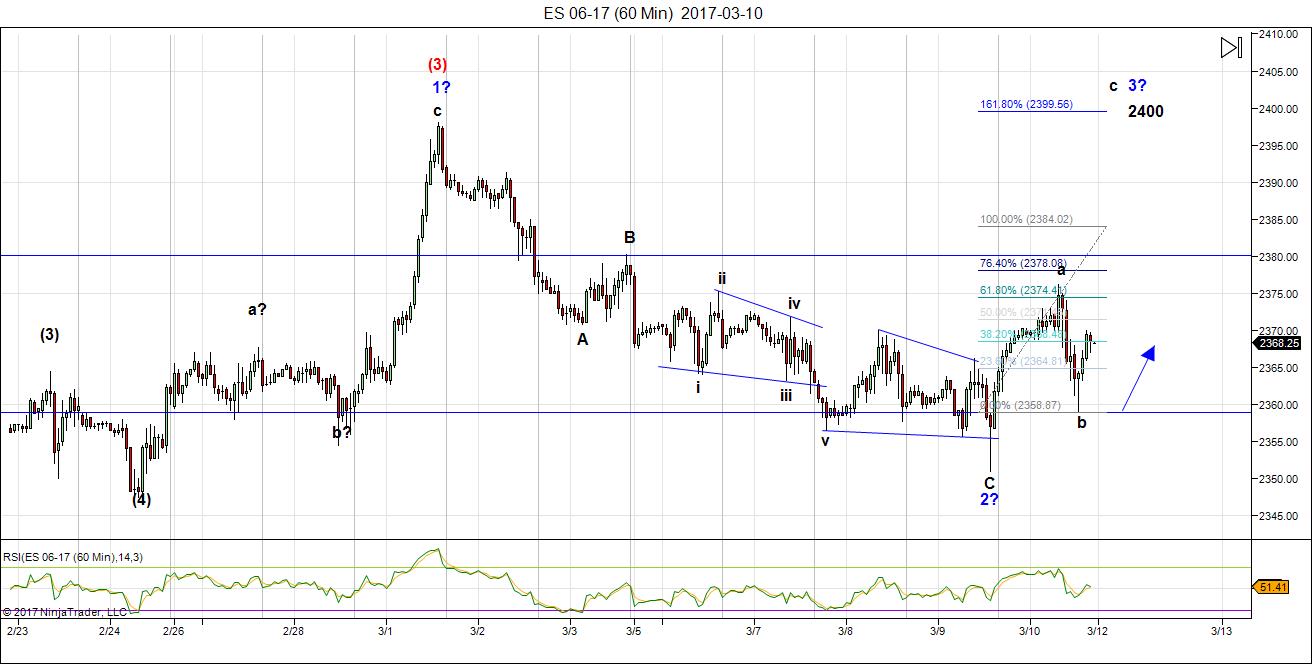
Above is the 60 minute chart of ES. As I’ve been saying, we have one more high still to go. Although I seem to be one of the only ones saying this, the wave structure simply couldn’t be clearer. The wave up is in three waves topping on March 1 (which was an Andy P. turn date). Three waves do not end a sequence unless it’s the last wave of an ending diagonal, which it is not.
However, it looks to me like the start of an ending diagonal, because in this position, I don’t know what else it could possibly be. We have 3 waves up, three waves down, and the current set-up from Thursday Friday predicts three waves up to 2400 (C wave = 1.618 X the A wave).
We also didn’t go to a new low, or reach a double bottom with the previous 4th wave. So we’re clearly in the fifth wave position. It can’t be a triangle, so all we have left is an ending diagonal. This would make the current wave up wave 3 of the ending diagonal. Look then for a smaller wave 4 and 5 after this wave up and that may take us to the final projected top of about 2105 and we might end up there Wednesday, just in time to hear the fat lady sing.
_____________________________
Sign up for: The Chart Show
Thursday, March 16 at 2:00 pm EST (US market time)

The Chart Show is a one hour webinar in which Peter Temple provides the Elliott Wave analysis in real time for the US market, gold, silver, oil, major USD currency pairs, and more. You won’t find a more accurate or comprehensive market prediction anywhere for this price.
Get caught up on the market from an Elliott Wave perspective. You’ll also get Andy Pancholi turn dates for the balance of the current month. There’ll be a Q&A session during and at the end of the webinar and the possibility (depending on time) of taking requests.
All registrants will receive the video playback of the webinar, so even if you miss it, you’ll be sent the full video replay within about an hour of its conclusion. For more information and to sign up, click here.


You are certainly right in that most analysts have either called a top, or allowed for the possibility of the current low being a small degree fourth wave with a final fifth up underway. I have to confess the ED is not all that clear to me but the price action has me doubting that we do have an interim top. There is something very strange going on in the markets are we are seeing reversal signals but the market simply refuses to go down. A few weeks ago we had an island reversal, and this last week we had an exhaustion gap fillled. We are living in strange times indeed, and in my mind all this is suggestive of the magnitude of the kind topping process we are in. The coming week should be enlightening!
O.K. I just read your update from last Friday and there it is clear that you see an ED down. Now I get it. In fact I was looking at the price action last week and was very confused by what I was seeing as I also thought the move down looked like an ED when I was expecting an impulsive third wave down. It is still not clear to me if you think we have completed a red third up or that you are saying we are still completing it. I think the consensus has always been that after the third up, we still had to complete a fourth wave, then a final fifth up to new all time highs. I am assuming your call for a top at around 2400 is not a final top, but the top of a third wave. Thanks so much for the charts!
If at first you don’t succeed! I now see your labels on the 60 minute chart and you are seeing the third wave as an incomplete ED right?
I was thrown off by where you placed the red three.
I’m seeing an incomplete ED at the top of the larger third wave.
Peter,
Your insights are internally consistent and original in your views regarding cycles of weather, EW, economic cycles together as market indicators. My view (thanks for the wish of good luck =) ), as it has been since much lower levels on US equities, is that we are entering a limited (say 3 to 6 years) market up turn, and that new technologies will be the main reason. The market rally will provide the auspicious atmosphere in which the roll out of A/I, Robotics, Materials, etc., will add paper wealth which will facilitate consumer adoption of the new tech. Also this rally will encourage the millenials to begin associating equity investing with a prudent long term wealth strategy. The 60 to 70 year age cohort will have to withdraw money from their IRA to pay mandatory withholding and pay taxes on the withdrawals. Everyone wins!
Valley,
Let’s hope this time is different. I note that the first news radio network (1920), the first public demonstration of tv (1931), the first telephone exchange (1878), the first film projector in a theatre (1900), the first “talkie” film (1927), the first Model T (1908), and the opening of Ford factories around the world (1924-25) didn’t do much to stop the depressions of 1907, 1920, or 1929.
We’re already into deflation (Europe is well ahead of the US in this regard). There’s a report today on loans being reduced in the US, which of course, as I’ve explained, with our crumby debt system, destroys money and freezes credit. http://www.zerohedge.com/news/2017-03-12/who-hit-brakes-bank-loan-creation-suddenly-tumbles-five-year-low
Without money, not much is going to happen, I’m afraid. Where is Ben with his helicopter when you need him?
Jeff Hirsch at Stock Almanac is predicting a super cycle in stock market lasting up to a decade and beginning in 2017 driven by new tech.
Harry Dent is predicting the opposite based upon demographics.
Guess it could go either way.
Simpler setup. Debt ceiling + rate hike. There you go 🙂
Valley ,
What does your PALS system say for the week.
Phase: post Full moon negative
Distance: pre apogee neutral
Declination: equatorial crossing tomorrow, three days strong, then weak.
Seasonals: weak until Friday
Planets: pre Venus inferior end of month, price usually rises next three months.
Summary: no clear direction this week.
“The US had come out of (WW 1) in really good shape financially (remember Fort Knox?), as it supplied most of the weapons and didn’t have war on its territory, except for Pearl Harbor.”
Only Pearl was in 1941, so you may want to drop that clause.
Oh, yeah, right. Thanks for catching that. Wrote a little too hurriedly.
Excellent work Peter! Thank you.
Thks. 🙂
Ref Zero Hedge loan turn down. The stock market is acting like it is anticipating a turn around. There is a lot of room for improvement with all the bad news abounding from low loans, Europe, Korea, China, 3rd world, etc.
https://www.peakprosperity.com/blog/107199/mother-all-financial-bubbles
Thanks Andre..
I read the blog sorry that the link was not clear about Mahendra and thanks for the help correcting it.
I guess March 15/16 will be very important I thing it will be a major high.
Mahendra was right with his prediction Nov,Dec 2016 and Jan 2017 but Feb was was wrong.
Watch out for the next Mercurius retograde periode that is all I can ad.
Peter,
Thanks for the new post.
Do you still follow Norm Winski?
Is there a new youtube somewhere on the net the last one I could find was March 2016?
The only thing I could find was this?
https://www.fxstreet.com/analysis/march-should-be-pivotal-201703081631
You have been noting in path going forward that “Wave 5 is likely to be an ending diagonal. In any event, it will be in 5 waves (not motive).”
What is the meaning of 5th wave “not motive”?
Amit,
You can find a lot of that info in the forum under Elliott Wave Resources
All impulsive wave are motive waves, but not all motive waves are impulsive…. 🙂
I know that motive waves are either impulsive or diagonal.
So so all impulsive wave are motive waves, but not all motive waves are impulsive…
But I thought 5 waves are always motive. So if the fifth wave is not a diagonal then it has to be impulsive. But Peter says 5th wave ED or ” not motive”. Hence the question.
For a wave to qualify as an ED, I think ALL the sub-waves, 1-5, must be Zig Zags. It is still a five wave move….
Amit,
“Impulsive is the same as “motive.” Zigzags have two sets of 5 waves in them (5-3-5) and that’s corrective. The subwaves of those 5 wavers don’t need to have 5 waves within them. Flats are also corrective (3-3-5) and the final wave, even though is made up of 5 waves, is not motive, same reason.
An ending diagonal can be in a fifth wave of a motive wave or a C wave. It’s really a corrective pattern, but can appear in a motive set of waves (trend) or in a corrective pattern, but always in the last wave.
Thanks for that clarification. I always assumed motive meant any wave that advanced the trend even if not in an “impulsive” wave, therefore an ED in the trend’s direction would be “motive”
Correct. Because of its structure, it’s actually corrective, but considered as a motive wave in a 5th of a motive, or impulsive series.
The confusion I think lies in waves of 5. You don’t find the distinction explained in “The Principle” book between motive 5’s and just regular 5’s. But there’s a big difference. Regular 5’s are all corrective waves. Only 5’s with subwaves of 5’s are actually motive. Perhaps why I see so many incorrect counts all over the place.
Peter,
what is the minimal time frame you are looking at to distinguish if the subwaves are in 5 or in 3 ?
Dimitri,
A one minute chart.
Thanks
Thanks for that clarification.
Pull up on stockcharts.com —$rut:$spx. and $tran:$spx—broad market is not following the biggest names. Elliott type divergence heading into a top. Arch crawford says that the advance decline line has already turned down so that a new high will have that divergence. Oil stocks make up a lot of the market so a/d line should fall hard.
Today I want to see if ES can retest last Friday low and if support fails, Thursday low. I need the retests before I get long.
Funny! I need those levels to break before I go short!
Peter’s title is fitting for today. Relax. Good day for a massage while you sleep. Zzzz.
Iuri apparently you’re not alone 🙂 green line: http://trader-moe.com/wp-content/uploads/2017/03/triple-witching-3-13.jpg
alex,
was i alone?? OMG – now you tell me!! being on a desert island is kinda fun! thanks for the trader moe’s chart.
now update time – charts are still standing and proving themselves. This is a classic “BULL TRAP”- Be warned!! bullish sentiment – even here in the forum is extraordinary. and to top things off – no one chartist truly has a lock down on the current EW – ….. bull trap, with mayo – hold the pickles.
https://invst.ly/3fxx5 RUT
https://invst.ly/3fxyh 3PDH
oh yeah,
here is “jody’s” update on the head and sh on the hourly ES he saw from the end of last week.
https://invst.ly/3fy31
so I was seeing to possibility of a (v) unfolding, but today’s action has me leaning more towards the head and shoulders pattern. I’ll have to look at a little closer when I get to the computer tonight, but it’s FAIR Time with the family today.. mmmmm corn dogs and Cotton candy! Haha!
cough – jody
corn dogs and cotton candy?? really?? ……with me being on a diet, and you just dropped the food version of thermo nuclear bomb!! OMG – you are corn dog and cotton candy EVIL!!!
:-)) ……. oh yeah, think ‘bull trap’!!
luri…..WHY are you on a diet, please?
Is it the DOC?
Is it the ‘Missus’?
OR did you just wake up and say…’I’m on diet’?
The reason I ask is that I ‘LURVE’ food and you are messin’ with my brain dude!!
I agree with you. I like your charts and its nice you keep updating them. Tii now they are right.
https://invst.ly/3fysz
neckline buying exhaustion? https://invst.ly/3fz1p
Buy the dip? Triple bottom on the one hr chart. 🙂 Up and away to 239 tomorrow? Not trading advice.
liz – you must stop this very minute from this obsession with cocaine!! because i KNOW it is the “cocaine” that is speaking when you write of [gasp] a “TRIPLE BOTTOM!!!”
Triple Bottom is a band – right?……….
ok liz, i will “see” your TRIPLE BOTTOM, and raise you a “BULL TRAP”……..!
Lol Luri. I don’t do cocaine. I just drink kool-aid! 😉 I think we get a tradeable bounce next 2 days. ES 2395 is that too much to ask? Then we go down again. Look at the RSI on the 1 hr chart. It’s curling up. It badly wants to go to 99. That said, if it opens higher tomorrow than yesterday’s close and we see a bloody red 1 hr candle then we might finally see that 2348 gap filled.
I meant TSI not RSI.
Making good sense, luri. especially “exhaustion buying at neckline”–or “please, I wanna break down but the Boss might not approve.”
whitemare,
i can tell YOUR blood tests will come back “DRUG FREE” ……..[cough – did you hear that one LIZ……??!]
i can tell whitemare that you are clear thinking and insightful, as indicated by your illuminated comments above – and that can only mean that you turned down the “Mena Arkansas Clinton/Bush/CIA” cocaine shipments – which seems to have been mysteriously found their way over to LIZ”S HOUSE!!! [cough]
:-))
🙂
Ever since I’ve returned from my holidays I’ve tried to step back from the ‘day to day’ market action. As part of that exercise I’ve been staring at the following chart for a few days now (sad really but necessary). (DJIA daily going back to just before 1972)
https://postimg.org/image/4i3uurruh/
From around 1972 to 1982 (700 to 1100 [about 4 hundred points] around 10 YEARS) the market was flat…but something started around 1986 although it tried to correct itself in 1987 to no avail. That’s the left hand side of the chart.
Now look at the right hand side of that chart. Let’s take the ‘best case scenario’ from Feb’16 low to now. (15500 to 20800 [about 5000 points] around 1 year).
If this trend continues then we’ll be going ‘back to the future’ with the chart starting to curl ‘backwards’.
For my money we either head ‘back to the future’ OR we are DONE here!!
No EW or any other kind of analysis works here IMHO.
Amen
Dimitri hahahahahaha!!
I DO AGREE with your sentiment though!!
Just to be clear about my earlier post. I am currently short about 4 ‘positions’.
Each day I take a ‘teeny tiny’ short with a ‘stop’ at the high of the previous day….for just that day’s position.
My strategy is to ride the bear down (IF it’s a bear of course) on a daily basis. By the end of the ‘bear’ I should be several hundred pounds/points short.
THAT!! however is a loooooong way away from where I am now.
I’ll keep you informed of my ‘progress/regress’ as it happens.
Please remember I’m in the UK and have the ‘luxury'(curse?) of spread betting.
p,
nirvana has no food. it is clear, light and weightless. I wish to achieve nirvana, so i must dispense with food completely [albeit in stages].
if my charts begin to glow with the wisdom of the universe – i am on my way!!
:-)))
luri, one question…..why nirvana? Unless we’ve had ALL that this earth has to offer we are not ready for nirvana.
So enjoy what has been given to us here before striving for something beyond friend.
BTW If you’re charts DO start to glow…report your water supplier to the authorities. LOL.
Dear Peter,
I am currently a basic member.
How do I register to get a 2 weeks free trial?
Pls register me to get a 2weeks free trial. I intend to switch my subscription to your website if you are accurate during these 2weeks.
Regards
Vincent
Hi Vince,
You can go here: https://worldcyclesinstitute.com/traders-gold-signup/
Mahendra the marketeer…”as in, buy my 2017 Financial Predictions book”
rotrot – March 11, 2017
https://worldcyclesinstitute.com/the-federal-reserve-and-the-great-depression/#comment-15976
Mahendra – March 14, 2017
https://www.mahendraprophecy.com/latest-news.php?id=1120
If his raising the price is a prelude to announcing a 90% discount, then he is indeed a brilliant marketeer…. 🙂
rotrot,
Wouldn’t that be “bad karma”? Ha
I reviewed a summary of Mahendra’s 2016 predictions, and found his monthly predictions of the stock market to be accurate roughly 2/3 of the time and in the times when he was wrong, an investor would likely have not been “hurt” by the wrong call. His specific stock and ETF recommendations appeared to be a little less accurate but better than 50/50. Does anyone subscribe to his material or has purchased his books, and if so, in your opinion is his annual prediction book a good supplement to what Peter offers?
If you’re a investor you can trade ma crosses without any other indicator whatsoever.
For the rest of us, being wrong for weeks bring certain death. I would be very careful with anyone giving dates at this point…
Mahendra is extremely bearish gold and bullish DUST…Tweet to Mahenda re DUST…
https://twitter.com/allerotrot/status/842180029551374336
Haha … well, while gold and SPX might eventually get to his targets, we’re a long way off. Both have more upside. In the case of gold, in years.
Bo Polny re silver and gold…”The second and MOST IMPORTANT concealed future TIME reference… ‘two hundred forty and eight’, represents the date of April 11, 2017.”
http://ymlp.com/zfFeGs
Mahendra wasn’t bluffing…he raised the price of the 2017 Financial Predictions book from $395 to $795…
https://www.mahendraprophecy.com/2017-financial-predictions-book.php
SO ……
The BIS has come out and said Canada is the first country that’s going to head into a recession (“r” should be a “d”, of course).
http://www.zerohedge.com/news/2017-03-15/canada-flagged-recession-bis
But what’s so ludicrous, is that the BIS is the central bankster group that creates Canada’s money (out of nothing) and charges us compounded interest for the privilege, thereby creating the problem. 80% of Canada’s debt is from interest payments to these folks.
And you can’t repay the debt, because the money would disappear out of the economy, thereby creating instant depression through deflation.
As I’ve been saying. It’s an amazing world we live in. As DT would say, “SAD!”
Sick or Bad Men! [cit]
Sorry, I have to go, my microwave is looking…
So back in the saddle.
Luri – you crack me up! oh i forgot to mention.. Funnel Cake. You know I had a chuckle as I shared one with my wife. lol
So it is really clear right now.. If we blast up after the announcement today we are heading to take out 2400 before we turn down. This is not MY preferred count.
If we head down and 2354 is taken out the neckline will be broken and the HS pattern I have been calling for will be confirmed.
Would could have a W1 down and (a) up (b) down and finishing (c) right now for W2 and the announcement starts W3 down.
I however would not be totally shocked if the fat lady raises rates and the market rises.
We shall see:)
The market **has** to go up after the announcement, no matter what it is. Their egos need to be satisfied they made the correct decision. Plus, it’s too early to pull the rug and be able to blame Trump for it.
You know the mantra…good news is good news and bad news is good news. Sometimes I’m convinced that they have absolute control of this thing and they will never allow it to go down.
Yup … 1928/29 all over again. The Fed is not disappointing. Closer we come … (ominous music here)
Tan, Tan, Tan, Tan,tada, Tan tada….. 🙂
Looks like the (c) wave i was watching has wrapped up. We should roll over from here.
Looking at a 1 minute chart I see this;
If the final leg of (c) started at 1pm you can see the ED on the 1 minute chart of the SPX
Connect the 1:06 pm top to the 1:48 top..
Party time;)
I was thinking the same thing and then…well, you saw! 🙂
I’m the only idi*t still waiting for that debt ceiling news? LOL 😀 It was all in my mind…no ceiling, just infinite borrowing with higher rates, debt hold by soon to be war enemies…ALL IS WELL
Andre’,
Yesterday, 3/15/17 ended up being a strong up…Are you still expecting 3/22/17 to be a high? Peter I believe is looking for a slightly new high and and a top of wave 3.
Peter has side stepped the “noise”. You two seem to be aligning in you expectation.
Any new twists to what you are expecting?
……’cough’…….. ahhhh is “KOOL AID” drinkin’ LIZ in the room??
……..LIZ…..look, we can argue about ‘who’ is right and “who” is wrong on the ‘triple bottom’ call on the charts post FOMC meeting till the cows come home, ….and “OK” my ‘cocaine’ comments may have been construed as ‘aggressive slander’…….but LIZzzzzzzz,……..it’s all good….. i mean ‘kool aid’ addiction is alright …..i mean better your kidneys than mine……… well errr…… what i really mean is that “maybe” you should try some water here and there…. pure and simple water……. …..
whew – well i thought that went pretty well, wouldn’t you say?? :-)) p.s. good call LIZ…. […..cough – ‘bull trap’]
https://invst.ly/3gliy
Hi Luri,
if you find yourself suddenly one day in Moscow we’ll go to drink some Vodka.
If You and Mahendra are right I’ll pay Vodka.
Otherwise it’s You who will pay because this market kills me.
dimitri,
the ‘darkest’ part of the night, are those moments just before the dawn!! should i dare say that “dark moment” happened on March 1st?? “gulp”
no worries, my friend – vodka it IS – and well as for the ‘payment’ …….. we shall “SIGN” the bill for it………. plastic payment with plastic money, for a plastic world………
Moonlight and vodka, takes me away,
Midnight in Moscow is lunchtime in L.A.,
Ooh boys, no plastic, cash only
…..but…but if you take away plastic – then “no more L.A.” for you!! and while i am at it, my personality has been likened to “plastic” many times in the past ……”why oh why” dimitri do you want to get rid of my personality?
Cash…..[cough]….what’s that?? you obviously will never be hired up at a central bank!!….
Well, our principal bank “Sberbank” together with “Aeroflot” are developing now the common platform based on blockchain algo.
So, you might be able to pay with some “coins” as well.
But no plastic, man
dimitri,
really? so are they using the blockchain to create their own digital currency, or will they be using bitcoin? i am an idiot. i bought 4 bitcoins back when they were $5 each. I sold them when they had reached 1100$ in the first spike up – it was the volatility that made me question bitcoin’s viability…..although the blockchain technology i knew had a huge future.
awesome dimitri!! wow!
http://www.coinfox.info/news/6762-sberbank-and-aeroflot-to-use-shared-blockchain-system
😀 <– This emoji in no way implies schadenfreude. We're all trying to figure this monster out. We just ride the waves– up or down.
Liz, liz…….liz
did you just call me ‘FAT’?? hmmm…… ‘schadenfreude’ is FAT right?? as in “fat head”??? wow , LIZ….. nothing like kicking a lad right smack in the ‘schadenfreude’…….. ok, repeat after me one last time – “i am on a DIET”!!! ask jody!! and purvez……
Luri, if you google (w/c is at 52 wk hi btw) schadenfreude, the meaning is “pleasure derived by someone from another person’s misfortune.”
If you look at ES 1 hr chart right now, I’m watching the 1 pm edt bar closely because the 11 am, 12 pm bars looks like the 10, 11, 12 bars last March 14 at the bottom of the bollinger bands which means, to me, that it might be coiling again to the upside.
arrrgh…..noooooooooo!!! coiling? …….now calm down LIZ and back away from that open window!
does this look like ‘coiling’ below the bb to you? https://invst.ly/3gmpw
….hmm…… and so, consolidating at the bottom of the range on the hourly ES is a “continuation” pattern, rather than a reversal pattern.
https://invst.ly/3gmrv
sorry liz, i meant this one for the Es hourly…
https://invst.ly/3gmtt
Luri, love your pretty chart. Look at the ‘b’ fractal, higher lows, pretty hammers…a triangle perhaps… might be the same playing out right now. If not, then I’ll join you in the wave down.
LizH: I have really appreciated your posts to this site, going back as far as when I joined. Do you have a twitter account or somewhere else to follow more of your ideas?
(Aside: My high school sweetheart was a LizH but she has since married some other dude, so I expect that you are someone else….)
the b fractal was at a point of price reversal – where fake buyers have stepped in on previous occasions. where we are in price now, no such area of support/reversal…..
elevator — DOWN anyone?
I would just love to see down for once, let alone the elevator…
I would love to see the crash but the line you have drawn looks too steep.
LizH: Your posts have been excellent. Do you post anywhere else, like Twitter, so I could follow more of your work?
Sorry about the double-post. There was a glitch on the first one.
StW, I apologize I only saw your post now. I’m silent in twtr. I only use it to follow potus, laugh at snowflakes and get the latest news. I just post here at Peter’s site because he, Joe and Andre give interesting info. Well, actually everyone here. I see it as some sort of war room. I’m trying to finish Peter’s vampire chronicles.
As for your aside, ?. Happy St. Patrick’s Day!
Armstrong on the debt ceiling:
There is a coming disaster thanks to the Obama/Boehner selling out the country. Politicians know that they can do anything as long as you push it off into the future after they leave office for all blame will fall of the next person holding office. Hence, Trump will be blamed for the entire debt – just watch. This will not end nicely.
HC Mercury enters gemini 3/20 and stays there 7 days (88/12). This is bearish. So Next week a major turn.
When Mercury enters Sagittarius (end of april) we should see a low.
This is just Mercury. But it is very clear april will be down. 4/10 is a strong date (gann date in hebrew year). This will be tested (high). 3/29 will be the low before that.
Thanks André!
Thanks Andre,
Next week we should see a turn
In the past you gave me the dates of the Mercury latitude cycle
I have March 19 ,April 9 and April 26.
Do you have the rest of the dates 2017?
Time price does not show them any more?
Have a nice weekend.
P.s. April 9 is Mercury retograde…this should be a negative cycle.. according the star man..
John.
will post them this weekend. And I think 4/10 will be a high, so…
Thank you…
merc lat
5/18
6/15
7/3
7/23
8/21
9/11
9/26
10/20
11/20
12/8
12/22
have fun,
Thanks Andre,
I sure will.
energy stream for next week
https://s13.postimg.org/6u62l6y5z/March_20_to_24_Energy_stream.gif
Thanks Tom,
I also have March 23/24 as a low.
Andre’,
Just trying to understand where you think we are….I think you are looking for a turn next week and that April will be down.
Where I am confused is your work indicates that April 10th will be a high. Are you able to venture a guess if that would be lower high than the high generated from next week’s turn?
My summary from your posts would be…Market turns down next week reaching a low around March 29th…then some type rally into a April 10th high. Then perhaps down again!
Any explanation would certainly help me and hopefully a number of others who read all your posts! Thanks in advance!
Ed,
22. 29 and 4/10 are very significant. So 22 is either a ‘w3’ or a ‘w5’ kind of wave (formulating carefully). It seems clear that after 4/10 volatility will really increase and then we are basically down into may. Will 4/10 be higher? I can’t tell. My focus is on timing and direction. 22 is very significant and I have some cycles that make a final turn next week and are then down into may. So I would be surprised if 4/10 would be higher. But 3/29 will be a low.
Hope this helps.
About next week.
3/24 is a dark day (carolan); that shoud be a high. Delta gives a high 22 so 23 must be a low.
In 1942 we had the new moon 3/25; that will give some support this week. Tidal inversions come 22 and 24. The master time factor gives 22 and 29.
Something weird in the tides. We have 4 tides a day and every 7 days (average) they should all turn. Usually this take a number of days as they never turn the same day. No idea why this is so, but I just notice.
3/22 we have 3 tides turning the same day. Both high tides are low and one low tide high. This indicates low gravity and thus a high in the market as delta suggests.
The last low tide turns Friday. This indicates Wednesday and Friday are the most significant highs. It also says that after Friday all tides are down (high tides up and low tides down).
Combined this suggests an abc down move into 3/29 week with the retrace into the weekend.
The sunspot indicator confirms a high 22, as does yoga velocity, Harmonics on the panic cycle (lillith/rahu) gives 24. The mauder cycle gives a low 3/21 and then 4/16.
Yesterday told you about HC Mercury in gemini from 3/20-27. This is bearish. and the period comfirms that after this week things will get a bit wilder.
I am a not sure what relevance all these dates people keep throwing out have to do with price action in the market. Despite my best efforts the past several weeks to find some correlation between numerous cited dates and what the market did. It seems to me the simple fact of the matter is that volatility has now been shorted to such an extreme that traders have cast all caution to the wind. This low volatility environment will encourage traders to remain at maximum leverage with minimal hedge protection until volatility begins to rise and brokerage risk managers force position liquidations. The danger I see is that if vol rises suddenly due to some kind of exogenous shock, like an outbreak of war, everyone will be forced to head for the exits at once. Forget about dates. Just watch volatility!
Verne,
we have seen with Brexit, US elections and Italian referendum last year and previous Greek and French elections that no unexpected event (I think even war) can crash the market. Everything is under control.
The only thing I see now is the debt ceiling that nobody talk about until now because it has been lifted so many times before.
But this time it may be different.
Us government had all the time before the 15 of March to borrow as much money as they would like in order to have enough time to negotiate the issue in congress.
Instead of that they have burned all 450 billions of cash they had accumulated before the elections and take the emergency measures now.
I think it will be very hard now for Trump to negotiate all his reforms and the debt ceiling at the same time. He has no marge of maneuver.
His choice is to give up the promised reforms or provoke the financial chaos.
The establishment holds him by gorge.
Dimitri you are quite right. In fact it is the dramatic reversals after the downside triggers of the events you cited that now accounts for so much of the complacency we are seeing. The way the central banks stepped in and bought back those steep declines was admittedly very impressive. My theory on that is that they are covering the exit of the smart money. There are so many reasons why trading at these levels displays fiduciary insanity, bankster largesse not withstanding. Another item not being discussed is the insolvent pension funds. These are all realities that no amount of bankster attempst to paper over weakness can ever remedy. We are talking about shortfalls in the tens of trillions. I can only conclude that the persistent complacency is due to a profound ignorance on the part of the majority of market participants. This is the danger that we face- we assume everyone else knows, or should know what is really going. That presumption will more often than not cost you money. To be certain, the crowd will eventually wake up to reality. The key is to plan your trading and positioning so as to remain viable when that does finally happen. That my friends, is not a matter of if, just when. What traders need to do is stop wasting time trying to figure out the short term market gyrations and make decisions and trades based on the larger picture. I continue to position my trades at least one year out and ladder into those positions. I could care less about what the market does in the next three to six months for it in no way changes the ultimate outcome.
Yes Verne it’s amazing. Dates that are wrong every single time, and we keep going like nothing happened. Pure definition of insanity.
I hear ya Alex. I like to keep an open mind. But you have correctly identified the definition of continuing to do the same thing expecting results differing from that previously achieved. At some point you have to allow yourself a dose of reality it seems to me, no offense to anyone intended.
Harry Dent – March 16, 2017
https://twitter.com/harrydentjr/status/842505662101966849
https://dentresearch.s3.amazonaws.com/PDFs/2016/Economic_Puzzle_ebook.pdf
Harry Dent’s theory on demographics and the spending wave is fundamentally correct in my opinion. He has done himself a dis-service and lost a lot of credibility in his persistent date-setting for a market crash. He has been at it since 2012 and one would have thought by now he would be wiser. He is entirely failing to account for the incredible spending power central banks have permitted to remain in the market place with interest rates perpetually near zero. Without it companies would never have been able to inflate PE ratios with the hundreds of billions in stock buy-backs financed with cheaply borrowed money. The vast majority of those loans will never be repaid and the bonds are going to zero when we finally get runway interest rates. The 30 year bull run in bonds is over. While I think we are very near to a top. I still think it is foolish to try and set arbitrary dates about when the market is going to collapse. The fact is none of us really knows. EW counts can give some idea of ultimate destination but tells absolutely nothing about time span. I used to get Harry’s work but cancelled a few years ago after I got tired of his bombastic prognostications. To his credit, he issued a mea cupla to his readers last year admitted that he got the timing completely wrong. About time if you ask me!
Vedic moon in Scorpio 17-20. Should give a low on Monday. Wednesday is a high; no doubt about that, A tiny bit uncertain about 29. Not the date. But as I expect early april a high, inversions can still mess up everything,
3/22 we enter the deathzone. But this zone runs into 3/28. Hc mercury in Gemini is 20-27; almost the same.
It is clear the market is weakening as shown in transports and small caps. And next week is a major period so I expect the turn before the end of the month, But I keep an open mind as to when the unrest begins. The dates are final. We’ll see what the market does with them.
Why I hesitate about 29.
Lunar return tend to replicate patterns. 3/20 is a lunar return on both the 1974 and the 1982 lows. So 3/20 a low makes sense.
But 3/27 is a lunar return on both the 1929 high and the 2007 high. 3/28 on the 1987 high and 29 on the 2015 high.
Other systems (delta) say a low.
Verne, all the dates cited by members may be like throwing darts but sometimes the estimated time of arrival hits the bull’s eye +/- a day. Here I said this last 12/12/16 referencing Andre’s dates:
“Andre’s hypo is 12/13/16 High and 12/23 low. Would be cool, for me, that 12/12 is high and 12/21 is the low solely based one the play of the two dates’ numbers.
Using day counting, from 9/29/15 low, day 26 was 11/3/15 high then down to 11/16/15. Today is day 26 from 11/4/16 low. “https://worldcyclesinstitute.com/revolution-in-the-land-of-mytopia/
SPY pivot high 12/13/16, pivot low 12/22/16.
A new post is live at https://worldcyclesinstitute.com/weve-been-here-before/