The bottom line is that the short term direction of the US equities isn’t clear. Monday (which may stretch into Tuesday) should provide the guidance as to what the market has in store. The two main options for Monday point in opposite directions. My preferred count has another small bounce before we head down in earnest. The support for this statement is in the ES (futures) chart, which shows up several charts below. The longer term direction is down.
Tuesday Update: We are now into the projected bounce—a second wave, except for the Nasdaq (which looks like it will go a fourth wave, as of this morning) and the DOW.
Targets for the bounce:
Nasdaq: 5,105
DOW: 17,685
SP500: 2,106
SPY: 210.54
Let’s look at the charts (from Sunday night):
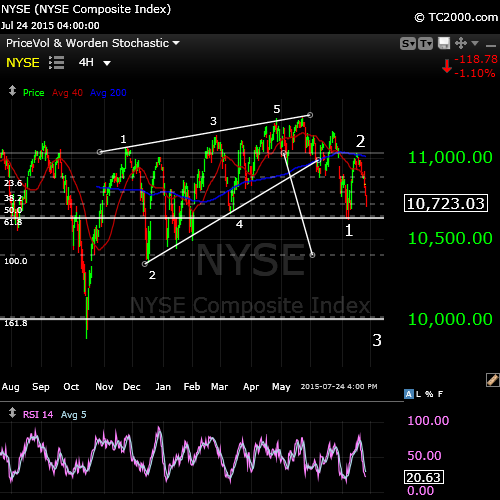
For the bigger picture, I revert back to the NYSE (above). As I’ve stated before this “mother of all exchanges” is where I look first to get a sense of overall direction. On this 4 hour chart, we’re showing the ending diagonal (with a double top), a first wave down, second wave retrace, and a move down to begin the third wave. I’m also showing the fibonacci extension to suggest a target for the third wave at 1.618 times the length of wave 1. Although the trend down isn’t confirmed yet, everything points to a very bearish result.
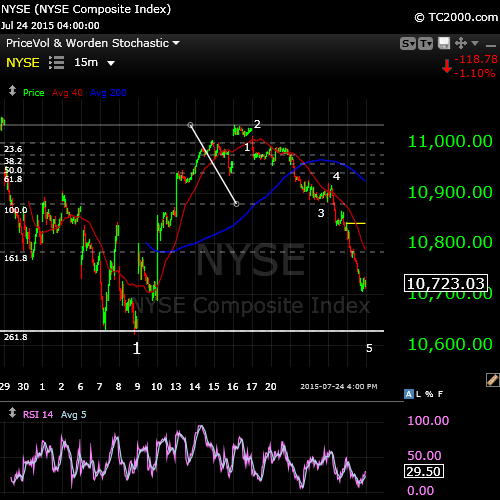
Above is a zoomed in 15 minute chart of the NYSE, showing the sub-wave structure. The NYSE could be setting up for a bounce (as it looks like we’re finishing a smaller degree 5 waves down—as per the labelling). The key level for the NYSE is $10,622,32. If it breaks this low, it should keep going. The next chart is the one that points more definitively to a small bounce.
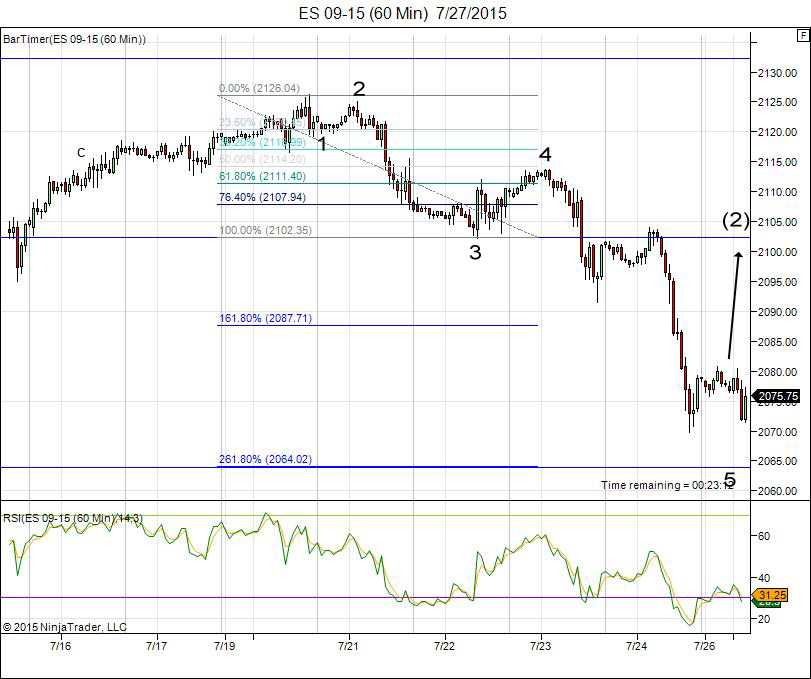
I trade the e-mini futures. The futures mirror the major US indices, but run around the clock (24 hours) from Sunday through Friday. They very often give a full picture of what’s happening “under the hood.” Here’s a look at the ES (em-mini futures for the SP500)—above. It appears to be completing 5 waves down and if so, a bounce is imminent.
The look of the wave is correct (as a motive wave) and the length is also correct (for a first wave) I do not expect the bounce to rise about the 62% retrace level (labeled as (2))before turning around and heading down. This morning, as I’m completing this post, we’re following through as expected (appear to be finishing a small 5th wave).
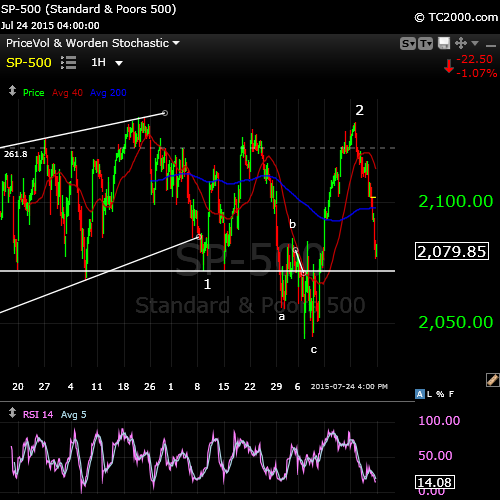
The SP500 above has a similar look if we were to drill down to the subwaves. The bigger picture is that the SP500 did not go to a new high last week (as projected here) and has set up as a second wave (which puts it in sync with the NYSE). The DOW is in a similar position. The key bearish break for the SP500 is $2044.42. If we break this level, we’ll likely head down immediately to complete the larger wave 3.
Cycles Analysis
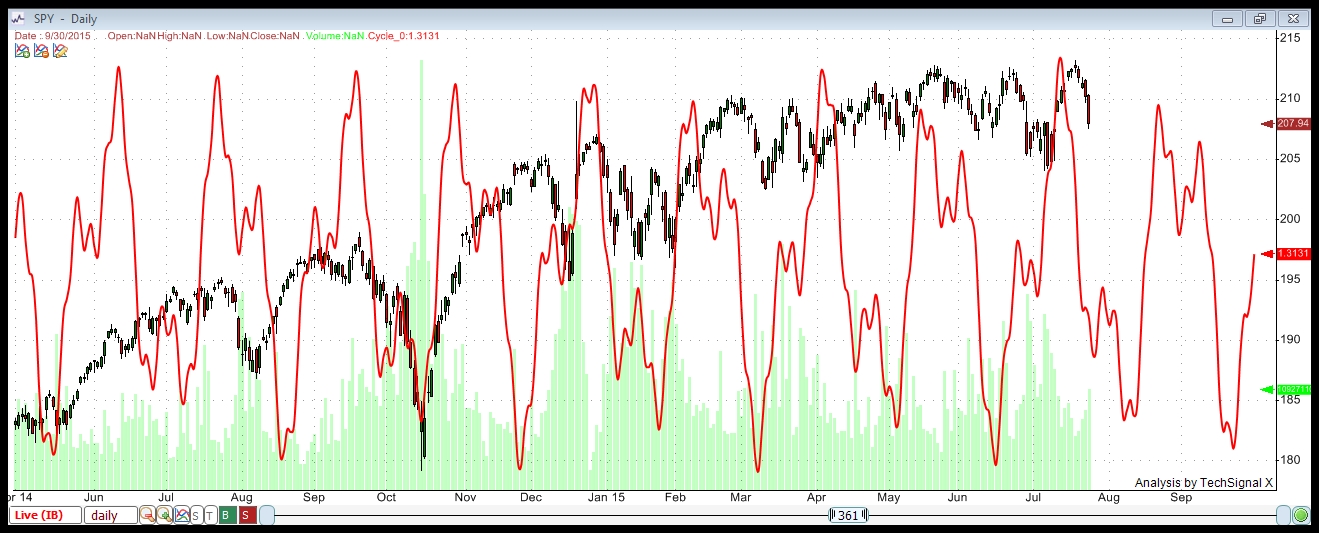
Here is a cycles analysis of SPY (Sp500) as at today’s date. We’re in a decidedly bearish cycle until the early part of August. The cycle analysis I run using very sophisticated software using 13 years of data (in this case) and back tests cycles for both the highest percentage of trade wins and the highest net profit (from trading both cycles lows and highs). This analysis is a result of the top 6 cycles synthesized into the single wave shown.

Finally, the Nasdaq chart above shows a 5 wave up ending wave and then an abc wave down. The abc wave suggests it will completely retrace back to to test the top (unless we head down further Monday to complete five waves). Supporting the idea of a retrace is the expectation for a double top at such an important top. This would line up with a bounce for the other indices.
Tuesday Update: The Nasdaq hit a new low this morning and my preferred count puts it in the first leg of the first wave, with a fourth wave bounce coming. No new high.
Gold (GLD) Ending Diagonal (BELOW)
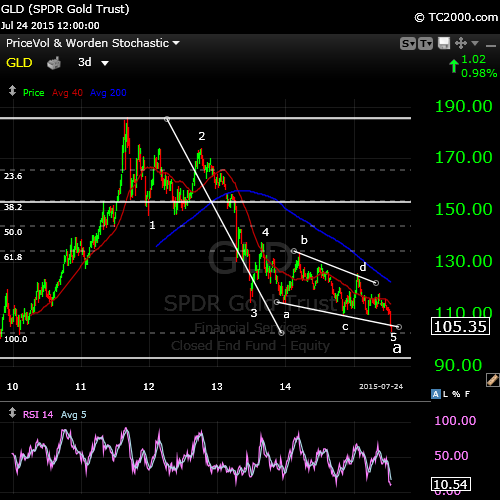
I got asked about gold this week. Above is the gold ETF (GLD) showing an ending diagonal to complete the a wave of the sequence. We should head up in the near future. We expect from here to complete a second (or b) wave, which should rise near the 62% level (around the $150 mark) before heading down in a third (or c) wave to the conclusion of this bearish pattern (obviously months into the future).
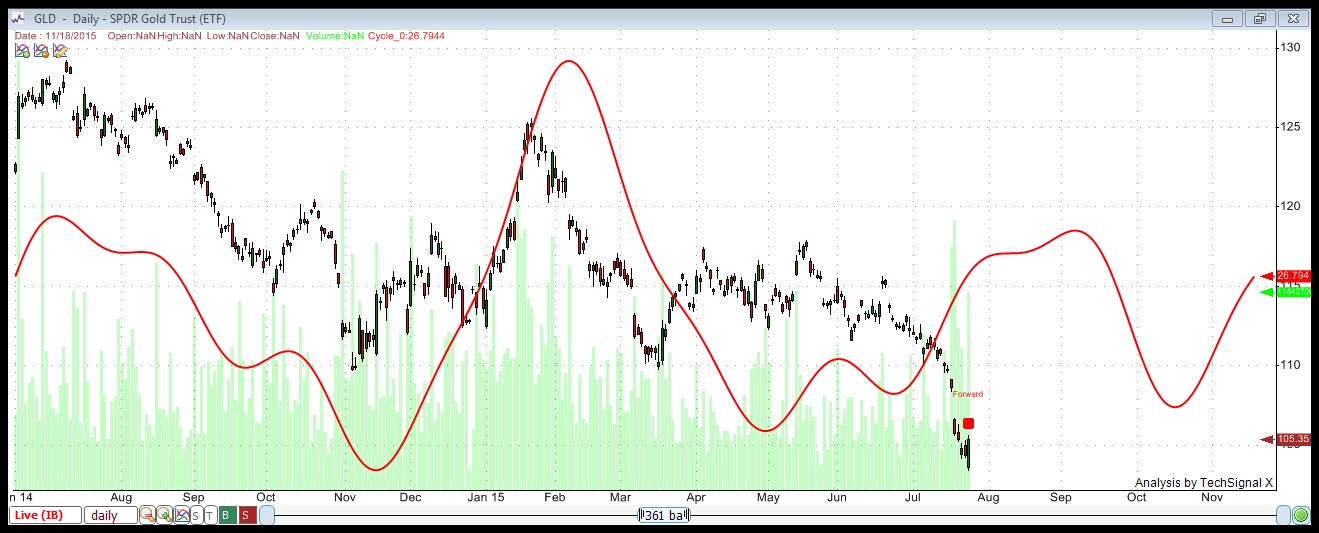
Above is a cycles analysis of GLD, using similar parameters as those used for the SPY analysis. Here we’re showing a bullish cycle which support the expectation for a rise in GLD.


Thanks Peter,
Looks very promising
I m impressed by your cycles analysis chart.
So I m short and will stay short till beginning of august (first week).
Cheers..
This bounce we’re in will likely last through Tuesday and then it should be all downhill.
Peter, appreciate your chart analysis… very well explained.
In general, I see the stocks dropping into August 7th-10th. The 17-year cycle has been has been targeting May – Sept. 2015 for at least a 20% drop. I see it as similar to the 2000-2001 period where every impulsive decline spurred new buying leading to an opposing corrective rally, and every rally met with a new sell-off to new lows.
The Shanghai Composite representing the global outlook lost 32+% in approx. 4 weeks, then rebounded to retest its previous support low turned into resistance at the 4,180 level. That resistance has contained the recent rebound and Shanghai should be enroute to the 3,075 level.
Thanks again for your insights.
Thanks, Joel,
We churned today. It took all day to turn this puppy around, so I expect the bounce to now last through Wednesday. Then we should hit the middle of the third, for a few days of “nowhere to hide …” Futures are headed up already tonight.
Hi Peter,
I think things will play out the way you see them ‘the bounce’
Tommorow/thursday is bradley turn again so things will have to come down again
After that monday august 3 we have another bradley turn so if we have a big drop friday/monday I wil be out of shorts and look what will happen…the rest of the week…
Cheers.
I would expect the top of this second wave bounce to happen on Wednesday afternoon when the fat lady sings …
Joel,
I have got the same gut feeling this pattern is already happening since oktober 2014.
So maybe we have a 10% sell off till August 7-10 and after that a bounce till september 4..
cheers
You maybe right John, although I do not see any more than a 5% correction on this wave down. All the best every one.
Andre,
I got stuck in your analysis that you made on July 25 (below)
So I took a look at the bradley chart 2008 and studied the period september /oktober
what happend.
Just like now there are a lot of twist and turns in the graphic and there is a correlation between the period Juli 23 /2015 till oktober 10 /2015 and September 20 /2008 till oktober 10/2008
So there is a good chance that you are going to be spot on..
Only when I look at the bradley the market will ben down from August 3 till 7 /10
After that a litlle up and severely down till August 22 like you suggested
Cheers.
andre July 25, 2015, 4:39 am
Let’s get it over with so I don’t have to spend my Sunday behind my desk.
Short term I’m inclined to change my forecast – with your permission. August 8-10 still will be an important turn window. But I think it will be a high. So next week is down – no doubts there- after a little pull up into Monday/Tuesday. And then down into 7/31 – 8/3. Then up into 8/10 and severe decline into 8/20-21. August 22 we have a full moon in the natal Nyse-chart and HC venus will be opposite Jupiter. August 27th we have a long term bradley date. Long term means outer planets, so +/- a week is acceptable. Given the general down trend I see it make more sense to expect longer down waves than up waves.
John,
Down into august 8th is a very likely scenario. Still trying to integrate Gann Timing, Astrotiming, Solunartiming and daycount timing. Next weekend I’ll update my forecast and give the reasons why I think what I think.
Thanks for your answer..
Hi guys!
First of all, Peter thanks again for the analysis! Much appreciated!
A questions about Astrology and the market for André/John or whoever can answer it for me:
Which book/website should I read to understand why things happen as they do (top at 27 April, now again a top at 20 juli after the unexplainable move upward)? I mean, look at the prediction that André and John give looking from a astrology perspective. Looking at my own systeem, I know that 3 August will be important, but I can’t tell if it will be a bottom or top… So I would like to read some good literature about this astrology stuff to improve myself in this field. I know that it is important to explanain why things happen in the markets…
I was looking for books and I found the books by Raymond Merriman. Are these any good???
Volume I. Cycles and Patterns in Indexes
Volume II. Geocosmic Correlations to Investment Cycles
Volume III. Geocosmic Correlations to Trading Cycles
Volume IV. Geocosmic Correlations to Short-Term Trading (not yet completed)
Volume V. Technical Tools and Trading Cycles (not yet completed)
I like to hear from your guys! If you have better alternatives, please share! 🙂 Thank you in advance!
Greetings,
Wouter
Wouter,
I don’t read books but have all the information from the net..make my own analysis and read sites likes this.
The bradley siderograph is interesting :
And I follow astro Time price research you will find the bradley there..
http://time-price-research-astrofin.blogspot.nl/search/label/Bradley%20Index
http://bradleysiderograph.com/turn-dates/dax/
Succes ik hoop dat je er iets aan hebt…
Hi John!
I already use tpr, a great website!
I am just looking for more knowledge on Astro. I want to be able to make predictions like André!
Still, thanks for your help. 😉
Groetjes,
W
Thanks for this list, Wouter,
He seems to get good marks on Amazon (I think that’s where you got your list). I’m going to get one of them: The Ultimate Book on Stock Market Timing: Cycles and Patterns in the Indexes. Hadn’t heard of him before.
Hi Peter!
No problem! He also posts a weekly outlook every sunday I believe (marketingtiming.somethingsomething, just look it up on the net). Looking at André’s post, I might be looking for some other books. 😉 But when you read it, I like to hear what you think of it! 😉
Greetings,
W
Wouter, can’t help you there. One reason being I concentrate on heliocentric astro and do my own research there. I have read books by Merriman, but they usually are like : 68% chance for change in trend within 8 days before or after. Not sure how that can help.
Hey André!
I think you can help a little, just by pointing which direction I should be looking. You started at zero too right? Well I already have a nice working system, I am just missing the ‘astrology part’ to make a prediction in time… So are you sure you don’t know a great book or website where I can learn what you learned when you started? 😉
As I just replied to Peter, I will not go for a book that is not specific enough on the subject. So thanks for your comment on Merriman!
Greetings,
W
Another balance and comprehensive view of the markets from the EW angle. Thanks Peter. And thank you much for the gold review. With FMOC and OPEX, I think we’ll find out what direction the miner is going some time this week. I am in accumulation mode for GDXJ. 🙂
Much appreciated.
You’re welcome. Yea, I think you’re right about gold.
You might want to take a look at this. Yet another cycle analysis. Basically points to 8/18 low, with some retrace in between. And gives a high around 8/3. Guess a few days off would be acceptable, but confirms that the first few weeks in August will be down.
http://time-price-research-astrofin.blogspot.nl/2015/07/spx-near-term-projections.html
Cheers,
André
And this :
http://time-price-research-astrofin.blogspot.nl/2015/06/sergey-tarassov-annual-and-moon-based.html
Thanks André for the links! I never watched these Astro articles, but I got them in my favorites now. 😉
Cheers,
W
New post.
Hi Peter,
No new post here?
You not seeing it?
https://worldcyclesinstitute.com/third-of-the-third/